 Fourplex
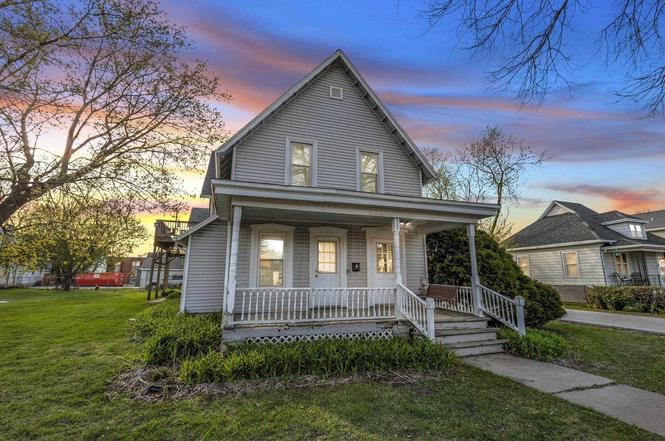
434 S Jackson St · Green Bay, WI
Flood risk 1/10 · Minimal
- FEMA flood zone
- X (unshaded)
- Chance of flooding over 30 yrs
- 0.0%
- Est. flood insurance / yr
- $473 – $860
Fire risk 1/10 · Minimal
- Est. fire insurance / yr
- $636 – $1,182
Heat risk 2/10 · Minimal
- Hot days now (above 96°F)
- 7 days/yr
- Hot days in 30 yrs
- 12 days/yr
Wind risk 2/10 · Minimal
- Chance of severe wind over 30 yrs
- —
Air-quality risk 3/10 · Minor
- Unhealthy air days now
- 2 days/yr
- Unhealthy air days in 30 yrs
- 4 days/yr
Risk factors via First Street. Map © Google.
Why this score? — see what drove the B- grade
The composite is a weighted blend of 9 inputs, each scored 0–100. Each bar is that input's sub-score; the figure is the points it added to the 100-point composite (weight × sub-score).
- Cash flow +30.0/30.0
- 1% rule +10.0/10.0
- DSCR +10.0/10.0
- ARV discount +7.5/15.0
- Rent growth +3.7/5.0
- Livability +3.6/5.0
- Condition / age +2.5/5.0
- Schools +1.7/10.0
- Appreciation +0.0/10.0
$399,900
🖨 Deal sheet 📄 Offer letter ✓ Due diligence
Multi-family units
County records classify this as Multi-Family (2-4 Unit). Listing-text estimate: 4 units. confirmed
Listing remarks
Welcome to this income-producing fourplex offering strong investment potential with the opportunity to add a fifth studio unit (Photos of the unfinished unit show the potential add-on unit) All other four units are fully renovated. One unit is currently vacant, possible owner-occupancy or for immediate rental income right after closing. Whether you?re looking to expand your portfolio or house hack, this property offers flexibility and upside. New Boiler system 2024!
Key facts
- 0.32 acre lot
- Built 1872
- Listed 50 days
Property features AI
Exterior
- Parking: Outdoor parking
- Utilities: Municipal water; Municipal sewer; Natural gas heating with forced air
- Home design: Multi-family property; Combination 2-story and bi-level building; Estimated total living area between 3,001 and 3,500
- Construction: Vinyl construction
- Exterior features: Vinyl exterior; Lot under 1/2 acre (0.32 acre); Residential zoning
Interior
- Kitchen: Appliances included (in-unit) — all appliances currently in units
- Bedrooms: Unit 1: 3 bedrooms; Unit 2: 1 bedroom; Unit 3: 2 bedrooms; Unit 4: 1 bedroom
- Bathrooms: Unit 1: 1 full bath and 1 half bath; Unit 2: 1 full bath; Unit 3: 1 full bath; Unit 4: 1 full bath
- Interior features: Full stone basement; All appliances currently in units included
- Laundry & utility: Washer/dryer included if currently present in units
Neighborhood map
What this means for you Summary
Snapshot
- This is a 4 × 7-bed/4.5-bath units multifamily listed at $400k.
Deal economics
- At list price, monthly cash flow is $2k ($28k/yr) — positive. Per door: $579/mo.
- The deal already cash-flows at list — no discount required.
- Meets the 1% rule at list price ($6k rent vs $400k).
- Recommended offer: $388k (3.0% below list) — sets the bar for market timing.
- Cap rate 13.2% vs local median 3.2% in Green Bay — top-decile yield for the area; either an underpriced asset or a hidden risk that comps aren't pricing in. Stress-test before assuming the spread holds.
Location & tenants
- Location reads 71/100 on livability (#238 in WI) — a middle-class / working-renter tenant base. Strengths: cost of living A+, housing A+, health & safety A; Watch: crime D, schools D-, commute F.
- Green Bay Area Public School District (urban): math 18% / reading 20% proficiency, ranked #333 of 342 in WI (top 97%) — low school quality limits family demand, transient renter base, plan for 1-2y turnover.
- Market conditions: Rents rising fast (+4.7%/yr); 50 active listings in the ZIP; solid renter incomes; 1,585 units permitted in Brown County in 2024 (877 in 5+ unit buildings).
- At $6,428/mo this rent would consume 98% of the median local household income ($79k/yr) (locally 494% of renters already pay >50% of income on rent) — very limited rent-growth headroom before tenants either downsize or default.
Forward outlook
- Local home prices are declining (-3.0%/yr); year-one equity from $3k of loan paydown is wiped out by about $12k of value loss. Plan a longer hold.
- Brown County population projected at +10% by 2050 — modest demand growth; plan on rents tracking national, not racing it.
- At projected returns (-3.0% appreciation + 4.7% rent growth), your $112k cash investment doubles in ~5 years — after that, you're playing with house money.
Negotiation context
- It's been on market 51 days — a 3% lower offer ($388k) is reasonable based on typical stale-listing flexibility.
- 5 sale attempts since 3y ago with the ask held roughly flat each time — persistent listings suggest the price (not the market) is what's stuck; bring a comps-based counter.
Risks & watch-outs
- Watch-outs: built in 1872 — expect roof / HVAC / electrical / plumbing capex.
Questions for the listing agent
- It's been on market 51 days. Have you received any prior offers? Is the seller open to a 3% concession, seller financing, or rate buy-down credit?
- Can we see the unit-by-unit rent roll, current vacancy, and any below-market leases? What's the average tenancy length?
- What capital expenditures (roof, boiler, parking lot, exteriors) have been made in the last 5 years, and what's planned in the next 2?
- Built in 1872 — when were the roof, HVAC, electrical panel, plumbing, and water heater last replaced?
- Is there a deadline driving the sale (1031 exchange, divorce, estate, relocation)? That informs how much negotiation room exists.
- Schools are D-rated, which usually means shorter tenancies and higher turnover. Who's the typical renter profile here, and what's been the actual vacancy rate?
- Crime grade is D in this area — have there been break-ins, vandalism, or insurance claims at this property in the last 3 years? What carrier currently insures it and at what premium?
- What's the average days-on-market for RENTAL listings here right now (not sales)? A rising rental-DOM trend means longer vacancies and softer asking-rent achievability than the comps imply.
- What's the recent tenant-quality profile in this submarket — average credit score on applications, eviction rate, late-payment / NSF rate, and stable-employment percentage? A property-management company in the area should have these aggregated.
- How much new apartment / multifamily construction is in the pipeline within 1–3 miles? Heavy new supply (>2% of stock underway) typically softens rents 12–24 months out; light construction supports rent growth.
Investment metrics
- 1% rule
- 1.61% ✓
- Cap rate
- 13.24%
- Cash-on-cash
- 24.80%
- DSCR
- 2.10
- GRM
- 5.2
CMA / ARV
No comps found within radius.
Projected returns pro-forma
-3.0% appreciation · 4.65% rent growth · sell at horizon
- IRR
- 20.1%
- Equity multiple
- 1.84×
- Total profit
- $93,554
- Equity at exit
- $59,626
- IRR
- 29.4%
- Equity multiple
- 3.84×
- Total profit
- $317,710
- Equity at exit
- $34,576
Cash invested: $111,972 (down + closing). Projections, not guarantees.
Landlord ↔ Tenant lean methodology
- Overall (STATE)
- 73 Landlord-Friendly
- State Wisconsin
- 73 Landlord-Friendly · R+2
- County
- — inherits STATE
- City
- — inherits STATE
ZIP-level market 54301
- Home prices YoY
- -21.7%
- Rents YoY
- 4.7%
- Active inventory
- 50
- Price-to-rent
- 20.7×
Monthly cashflow live
- Estimated rent
- $6,428 medium interval (Pro) →
- Mortgage (P&I)
- −$2,097
- Tax est. 1.5%
- −$500 /mo · $5,998/yr
- Insurance
- −$167
- HOA
- −$0
- Vacancy / Maint / Mgmt
- −$1,350
- Net cashflow
- $2,315
Break-even live
4-unit breakdown (identical units grouped — click to expand)
| Units | Beds | Baths | Est. rent |
|---|---|---|---|
| 4× units | 7 | 4.5 | $6,428 |
| #1 | 7 | 4.5 | $1,607 |
| #2 | 7 | 4.5 | $1,607 |
| #3 | 7 | 4.5 | $1,607 |
| #4 | 7 | 4.5 | $1,607 |
| Total (4 units) | $6,428 | ||
UW: 25.0% down · 7.5% · 30yr · 1.5% tax · 5.0% vac · 8.0% maint · 8.0% mgmt
Financing live
Cash to close
- Down payment
- $99,975
- Closing costs
- $11,997
- Reserves months
- —
- Total cash needed
- —
Loan-product check · same deal, 3 products live
Conventional
25% down · 7.5% · 30yr
- Down + closing
- —
- Monthly P&I
- —
- Monthly cashflow
- —
- DSCR
- —
- Eligible?
- —
Personal DTI + credit; lowest rate.
DSCR
20% down · 8.5% · 30yr
- Down + closing
- —
- Monthly P&I
- —
- Monthly cashflow
- —
- DSCR
- —
- Eligible?
- —
No personal income docs; deal must DSCR.
Hard money
10% down · 12.0% · 12mo
- Down + closing
- —
- Monthly P&I
- —
- Monthly cashflow
- —
- DSCR
- —
- Eligible?
- —
Short-term bridge; refi at stabilization.
Listing history 28 events
-
2026-06-19days on market $399,900 Active 51 DOM
-
2026-06-18days on market $399,900 Active 50 DOM
-
2026-06-17status $399,900 Active 49 DOM
-
2026-06-17days on market $399,900 Active w/ Contract 49 DOM
-
2026-06-16days on market $399,900 Active w/ Contract 48 DOM
-
2026-06-15days on market $399,900 Active w/ Contract 47 DOM
-
2026-06-14days on market $399,900 Active w/ Contract 45 DOM
-
2026-06-13days on market $399,900 Active w/ Contract 44 DOM
-
2026-06-10days on market $399,900 Active w/ Contract 42 DOM
-
2026-06-09days on market $399,900 Active w/ Contract 41 DOM
-
2026-06-08days on market $399,900 Active w/ Contract 40 DOM
-
2026-06-07days on market $399,900 Active w/ Contract 39 DOM
-
2026-06-03days on market $399,900 Active w/ Contract 35 DOM
-
2026-06-02days on market $399,900 Active w/ Contract 34 DOM
-
2026-06-01days on market $399,900 Active w/ Contract 33 DOM
-
2026-05-31days on market $399,900 Active w/ Contract 32 DOM
-
2026-05-30days on market $399,900 Active w/ Contract 31 DOM
-
2026-05-05historical Active w/ Contract
-
2026-04-29$399,900 Active
-
2025-03-25historical $745
-
2025-03-11$745
-
2024-03-14historical $850
-
2024-01-26$850
-
2024-01-20historical $700
-
2024-01-06$700
-
2023-12-21historical $700
-
2023-12-19price $700
-
2023-11-17$750
ⓘ Source: listings_history table (triggers on properties + properties_extension) + one-shot
backfill from property_details.listing_events for pre-trigger history.
Climate risk First Street
- Flood 1/10 Low FEMA zone X (unshaded) · 0% chance over 30 yrs
- Wildfire 1/10 Low
- Heat 2/10 Low 7 d/yr ≥96°F today · 12 d/yr by 30 yrs out
- Wind 2/10 Low
- Air quality 3/10 Moderate 2 unhealthy d/yr today · 4 by 30 yrs out
Nearby sold comps map
Loading sold comps map…
Walkable amenities ~0.75 mi
Loading nearby amenities…
Taxation est. · year 1
- Rental income
- $77,136
- − Mortgage interest
- −$22,401
- − Property taxes
- −$5,998
- − Insurance
- −$2,000
- − Repairs & maintenance
- −$6,171
- − Management
- −$6,171
- − Depreciation
- −$11,633
- Taxable income
- $22,762
- Est. tax owed @ 24.0%
- −$5,463
- After-tax cash flow
- $22,311/yr
For passive investors: Depreciation is non-cash, so a rental often shows a tax loss while cash-flowing — sheltering income. Rental losses are passive: they offset passive income freely, and up to $25,000/yr can offset ordinary (W-2) income if you actively participate and your MAGI is under $100k (phasing out to $0 by $150k); unused losses carry forward. On sale, claimed depreciation is recaptured at up to 25%, and gains may owe capital-gains tax (a 1031 exchange can defer both). Figures are a year-1 estimate at your 24.0% rate — not tax advice; consult a CPA.
Schools (NCES district)
- District
- Green Bay Area Public School District
- NCES district ID
- 5505820
- Math proficiency
- 18% ▼ -13.00%
- Reading proficiency
- 20% ▼ -8.00%
- Median HH income
- $46,617
- Composite
- 16.76/100
- National rank
- #9160
- State rank
- #333 of 342 in WI
Livability — Green Bay
- Score
- 71/100
- State rank
- #238
- US rank
- #6377
Category grades
Schools grade is shown separately in the Schools card above.
Census & demographics
- Census place
- Green Bay, WI
- County
- Brown County · 159,123 people
- City population
- 86,988
- Metro
- Green Bay, WI
- Population (ZIP)
- 21,724
- Household income
- $78,684
- Rent vs Own
- Severe rent burden
- 494.0
Population outlook (Brown County) Hauer SSP2
- Today (2025)
- 277,484 people
- By 2030
- 285,604 · +2.9%
- By 2040
- 298,167 · +7.5%
- By 2050
- 305,141 · +10.0%
- By 2075
- 315,496 · +13.7%
- By 2100
- 305,184 · +10.0%
Race, ethnicity, and origin ACS 2023
- Neighborhood character
- Predominantly White (82%)
- Race & ethnicity
- White 82% Hispanic / Latino 9% Two or more races 4% Black 3% Native American 2% Asian 2%
- Hispanic origin (detail)
- Mexican 7%
- Common ancestry
- Romanian 7% English 6% Portuguese 4%
- Foreign-born
- 6% · Canada
- Languages at home
- 89% English-only · Spanish 6% Other Indo-European 1% Russian/Polish/Slavic 1%
Political lean MEDSL · Brown
- 2024 margin
- Lean R (+7.5) · D 45.6% · R 53.1% · Other 1.3%
- 2008→2024 swing
- -16.7pp toward R · 2008: 9.2pp · 2024: -7.5pp
- All cycles
- 2024: R+7.5 2020: R+7.2 2016: R+10.8 2012: R+1.8 2008: D+9.2
Not yet ingested
- Civics
- —
Market trends
- HPI YoY
- ▼ -80.30%
- Current HPI
- 290.4354
- Rent YoY
- ▲ 4.65%
- Metro
- Green Bay, WI
- State GDP YoY
- ▲ 2.10%
- F500 in state
- 20
Industry mix (Fortune 500 HQ in WI)
| Industry | F500 HQs | Revenue |
|---|---|---|
| Industrial Machinery | 4 | $23B |
|
||
| Industrial Technology | 2 | $36B |
|
||
| Insurance | 1 | $36B |
|
||
| Professional Services | 1 | $19B |
|
||
| Utilities | 1 | $9B |
|
||
| Consumer Goods | 1 | $3B |
|
||
Price history
11 events — show timeline
- 2026-05-05 Contingent — RANW
- 2026-04-29 Listed $399,900 RANW
- 2025-03-25 Rental Removed $745 LEASESTAR
- 2025-03-11 Listed for Rent $745 LEASESTAR
- 2024-03-14 Rental Removed $850 APPFOLIO
- 2024-01-26 Listed for Rent $850 APPFOLIO
- 2024-01-20 Rental Removed $700 APPFOLIO
- 2024-01-06 Listed for Rent $700 APPFOLIO
- 2023-12-21 Rental Removed $700 APPFOLIO
- 2023-12-19 Price Changed $700 APPFOLIO
- 2023-11-17 Listed for Rent $750 APPFOLIO
Cash-flow waterfall
monthlySold comps — $/sqft
last 12 mo · ≤1 miLoading sold comps…