6554 Greeley Hill Rd #10 · Greeley Hill, CA
Flood risk 1/10 · Minimal
- FEMA flood zone
- D
- Chance of flooding over 30 yrs
- 0.0%
- Est. flood insurance / yr
- $544 – $1,084
Fire risk 8/10 · Major
- Est. fire insurance / yr
- $659 – $1,223
Heat risk 4/10 · Minor
- Hot days now (above 96°F)
- 7 days/yr
- Hot days in 30 yrs
- 17 days/yr
Wind risk 1/10 · Minimal
- Chance of severe wind over 30 yrs
- —
Air-quality risk 10/10 · Severe
- Unhealthy air days now
- 37 days/yr
- Unhealthy air days in 30 yrs
- 44 days/yr
Risk factors via First Street. Map © Google.
Why this score? — see what drove the B grade
The composite is a weighted blend of 9 inputs, each scored 0–100. Each bar is that input's sub-score; the figure is the points it added to the 100-point composite (weight × sub-score).
- Cash flow +30.0/30.0
- 1% rule +10.0/10.0
- DSCR +10.0/10.0
- ARV discount +7.5/15.0
- Appreciation +5.9/10.0
- Schools +3.0/10.0
- Rent growth +2.5/5.0
- Condition / age +2.5/5.0
- Livability +2.0/5.0
$29,995
🖨 Deal sheet 📄 Offer letter ✓ Due diligence
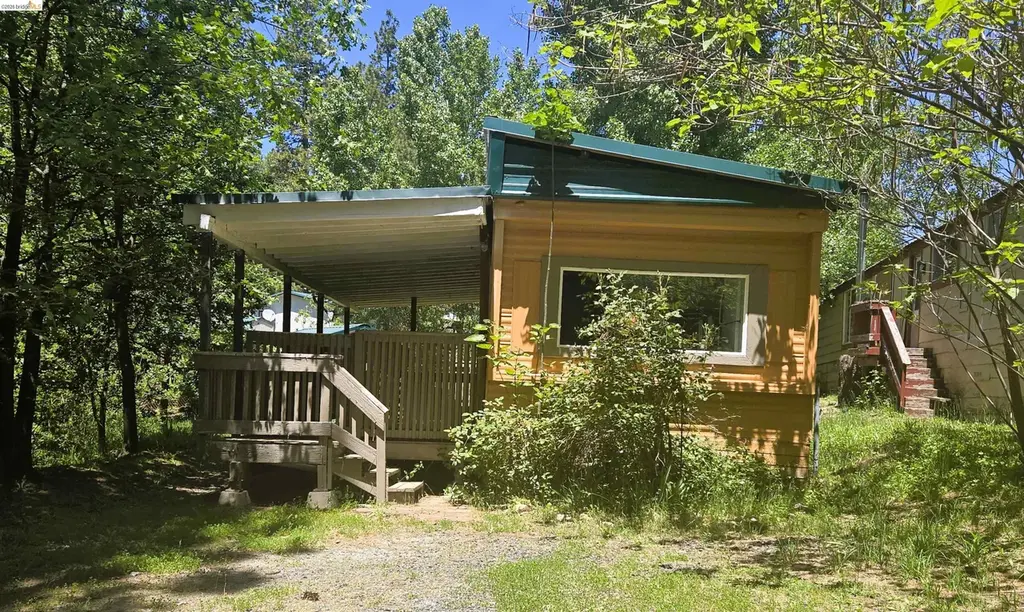
Listing remarks
This place can make a wonderful home for the ones who love camping, solitude, fishing, hiking. .. It's only 26 miles from Yosemite National Park. This is a "Fixer-Upper" to the one who would like a deal. .. Here it is!
Key facts
- Listed 29 days
Property features AI
Finance
- HOA & community: Pets allowed upon approval; Located in Yosemite Terrace Estates
Exterior
- Parking: Parking spaces available
- Utilities: Septic tank and public sewer
- Home design: Manufactured in park (mobile home); Single-wide; Faces south; 960 square feet
- Construction: Metal construction
- Exterior features: Covered porch; Front yard; Back yard; Level lot
Interior
- Kitchen: Eat-in kitchen; Gas range; Refrigerator
- Bedrooms: 1 bedroom (street level)
- Flooring: Tile; Vinyl; Carpet
- Bathrooms: 1 full bathroom with shower-over-tub and window
- Heating & cooling: Central heating; Central air
- Interior features: Sun porch; Main entry
Neighborhood map
What this means for you Summary
Snapshot
- This is a 2-bed/2.0-bath single-family listed at $30k.
Deal economics
- At list price, monthly cash flow is $738 ($9k/yr) — positive.
- The deal already cash-flows at list — no discount required.
- Meets the 1% rule at list price ($1k rent vs $30k).
- Recommended offer: $30k (1.5% below list) — sets the bar for market timing.
Location & tenants
- Location reads 40/100 on livability (#1,392 in CA) — a working-class tenant base; expect higher turnover. Watch: schools F, crime F, amenities F.
- Mariposa County Unified (rural): math 27% / reading 42% proficiency, ranked #282 of 517 in CA (top 54%) — families likely to look elsewhere, expect single-tenant / working-renter base with shorter leases.
- Market conditions: 71 active listings in the ZIP; 89 units permitted in Mariposa County in 2024 (0 in 5+ unit buildings).
Forward outlook
- In year one you build about $727 of equity ($207 loan paydown + $520 appreciation (1.7% local appreciation)).
- Mariposa County population projected at -23% by 2050 — secular population decline; favor cash flow + early exit over multi-decade hold.
- At projected returns (1.7% appreciation + 3.0% rent growth), your $8k cash investment doubles in ~1 year — after that, you're playing with house money.
Negotiation context
- It's been on market 30 days — a 2% lower offer ($30k) is reasonable based on typical stale-listing flexibility.
Risks & watch-outs
- Climate carrying-cost: severe wildfire risk — expect insurance premiums to compound above CPI over the hold.
Questions for the listing agent
- Is there a deadline driving the sale (1031 exchange, divorce, estate, relocation)? That informs how much negotiation room exists.
- Schools are F-rated, which usually means shorter tenancies and higher turnover. Who's the typical renter profile here, and what's been the actual vacancy rate?
- Crime grade is F in this area — have there been break-ins, vandalism, or insurance claims at this property in the last 3 years? What carrier currently insures it and at what premium?
- What's the average days-on-market for RENTAL listings here right now (not sales)? A rising rental-DOM trend means longer vacancies and softer asking-rent achievability than the comps imply.
- What's the recent tenant-quality profile in this submarket — average credit score on applications, eviction rate, late-payment / NSF rate, and stable-employment percentage? A property-management company in the area should have these aggregated.
- How much new for-sale + rental construction is in the pipeline within 1–3 miles? Heavy new supply typically softens prices + rents 12–24 months out; constrained supply supports both.
Investment metrics
- 1% rule
- 3.86% ✓
- Cap rate
- 35.80%
- Cash-on-cash
- 105.39%
- DSCR
- 5.69
- GRM
- 2.2
CMA / ARV
No comps found within radius.
Projected returns pro-forma
1.73% appreciation · 3.0% rent growth · sell at horizon
- IRR
- —
- Equity multiple
- 6.79×
- Total profit
- $48,629
- Equity at exit
- $11,402
- IRR
- —
- Equity multiple
- 14.08×
- Total profit
- $109,850
- Equity at exit
- $16,096
Cash invested: $8,399 (down + closing). Projections, not guarantees.
Landlord ↔ Tenant lean methodology
- Overall (STATE)
- 18 Strongly Tenant-Friendly
- State California
- 18 Strongly Tenant-Friendly · D+13
- County
- — inherits STATE
- City
- — inherits STATE
ZIP-level market 95311
- Home prices YoY
- 1.2%
- Active inventory
- 71
- Price-to-rent
- 2.2×
Monthly cashflow live
- Estimated rent
- $1,158 medium interval (Pro) →
- Mortgage (P&I)
- −$157
- Tax from tax record
- −$7 /mo · $86/yr
- Insurance
- −$12
- HOA
- −$0
- Vacancy / Maint / Mgmt
- −$243
- Net cashflow
- $738
Break-even live
UW: 25.0% down · 7.5% · 30yr · 1.5% tax · 5.0% vac · 8.0% maint · 8.0% mgmt
Financing live
Cash to close
- Down payment
- $7,499
- Closing costs
- $900
- Reserves months
- —
- Total cash needed
- —
Loan-product check · same deal, 3 products live
Conventional
25% down · 7.5% · 30yr
- Down + closing
- —
- Monthly P&I
- —
- Monthly cashflow
- —
- DSCR
- —
- Eligible?
- —
Personal DTI + credit; lowest rate.
DSCR
20% down · 8.5% · 30yr
- Down + closing
- —
- Monthly P&I
- —
- Monthly cashflow
- —
- DSCR
- —
- Eligible?
- —
No personal income docs; deal must DSCR.
Hard money
10% down · 12.0% · 12mo
- Down + closing
- —
- Monthly P&I
- —
- Monthly cashflow
- —
- DSCR
- —
- Eligible?
- —
Short-term bridge; refi at stabilization.
Listing history 18 events
-
2026-06-19days on market $29,995 Active 30 DOM
-
2026-06-18days on market $29,995 Active 29 DOM
-
2026-06-17days on market $29,995 Active 28 DOM
-
2026-06-16days on market $29,995 Active 27 DOM
-
2026-06-15days on market $29,995 Active 26 DOM
-
2026-06-14days on market $29,995 Active 24 DOM
-
2026-06-13days on market $29,995 Active 23 DOM
-
2026-06-10days on market $29,995 Active 21 DOM
-
2026-06-09days on market $29,995 Active 20 DOM
-
2026-06-08days on market $29,995 Active 19 DOM
-
2026-06-07days on market $29,995 Active 18 DOM
-
2026-06-05days on market $29,995 Active 15 DOM
-
2026-06-03days on market $29,995 Active 14 DOM
-
2026-06-02days on market $29,995 Active 13 DOM
-
2026-06-01days on market $29,995 Active 12 DOM
-
2026-05-31days on market $29,995 Active 11 DOM
-
2026-05-30days on market $29,995 Active 10 DOM
-
2026-05-20$29,995 Active
ⓘ Source: listings_history table (triggers on properties + properties_extension) + one-shot
backfill from property_details.listing_events for pre-trigger history.
Tax reassessment forecast CA · Resets to sale price
- Current annual tax
- $86 · $7/mo
- Projected year-2 tax
- $228 · $19/mo
- Expected delta
- +$142/yr (+$12/mo · 164.5%)
ⓘ Screening estimate from a state-policy table — verify with the county assessor before closing.
Climate risk First Street
- Flood 1/10 Low FEMA zone D · 0% chance over 30 yrs
- Wildfire 8/10 Severe
- Heat 4/10 Moderate 7 d/yr ≥96°F today · 17 d/yr by 30 yrs out
- Wind 1/10 Low
- Air quality 10/10 Extreme 37 unhealthy d/yr today · 44 by 30 yrs out
Nearby sold comps map
Loading sold comps map…
Walkable amenities ~0.75 mi
Loading nearby amenities…
Taxation est. · year 1
- Rental income
- $13,892
- − Mortgage interest
- −$1,680
- − Property taxes
- −$86
- − Insurance
- −$150
- − Repairs & maintenance
- −$1,111
- − Management
- −$1,111
- − Depreciation
- −$873
- Taxable income
- $8,880
- Est. tax owed @ 24.0%
- −$2,131
- After-tax cash flow
- $6,720/yr
For passive investors: Depreciation is non-cash, so a rental often shows a tax loss while cash-flowing — sheltering income. Rental losses are passive: they offset passive income freely, and up to $25,000/yr can offset ordinary (W-2) income if you actively participate and your MAGI is under $100k (phasing out to $0 by $150k); unused losses carry forward. On sale, claimed depreciation is recaptured at up to 25%, and gains may owe capital-gains tax (a 1031 exchange can defer both). Figures are a year-1 estimate at your 24.0% rate — not tax advice; consult a CPA.
Schools (NCES district)
- District
- Mariposa County Unified
- NCES district ID
- 0623940
- Math proficiency
- 27% ▼ -12.00%
- Reading proficiency
- 42% ▼ -5.00%
- Median HH income
- $48,669
- Composite
- 29.75/100
- National rank
- #6438
- State rank
- #282 of 517 in CA
Livability — Greeley Hill
- Score
- 40/100
- State rank
- #1392
- US rank
- #27320
Category grades
Schools grade is shown separately in the Schools card above.
Census & demographics
- Census place
- Greeley Hill, CA
- City population
- 2,282
- Population (ZIP)
- 2,282
Population outlook (Mariposa County) Hauer SSP2
- Today (2025)
- 15,956 people
- By 2030
- 15,078 · -5.5%
- By 2040
- 13,413 · -15.9%
- By 2050
- 12,232 · -23.3%
- By 2075
- 11,143 · -30.2%
- By 2100
- 10,187 · -36.2%
Race, ethnicity, and origin ACS 2023
- Neighborhood character
- Predominantly White (69%)
- Race & ethnicity
- White 69% Hispanic / Latino 25% Two or more races 9% Native American 1%
- Hispanic origin (detail)
- Mexican 22%
- Common ancestry
- Russian 4% Lithuanian 2% Estonian 2%
- Foreign-born
- 10% · Canada, China
- Languages at home
- 85% English-only · Spanish 14%
Political lean MEDSL · Mariposa
- 2024 margin
- Strong R (+21.1) · D 38.1% · R 59.1% · Other 2.8%
- 2008→2024 swing
- -8.6pp toward R · 2008: -12.4pp · 2024: -21.1pp
- All cycles
- 2024: R+21.1 2020: R+18.1 2016: R+23.2 2012: R+17.4 2008: R+12.4
Not yet ingested
- Civics
- —
Market trends
- HPI YoY
- ▲ 1.73%
- Current HPI
- 151.1386
- Rent YoY
- —
- Metro
- —
- State GDP YoY
- ▲ 3.21%
- F500 in state
- 116
Industry mix (Fortune 500 HQ in CA)
| Industry | F500 HQs | Revenue |
|---|---|---|
| Technology | 27 | $1,492B |
|
||
| Financial Services | 3 | $174B |
|
||
| Retail | 3 | $44B |
|
||
| Insurance | 3 | $26B |
|
||
| Media / Entertainment | 2 | $115B |
|
||
| Pharmaceuticals / Biotech | 2 | $62B |
|
||
Price history
1 event — show timeline
- 2026-05-20 Listed $29,995 bridgeMLS, Bay East AOR, or Contra Costa AOR
Property tax history
+2.8%/yrLatest (2020): $86 · +3.2% YoY. Source: county tax records.
Cash-flow waterfall
monthlySold comps — $/sqft
last 12 mo · ≤1 miLoading sold comps…