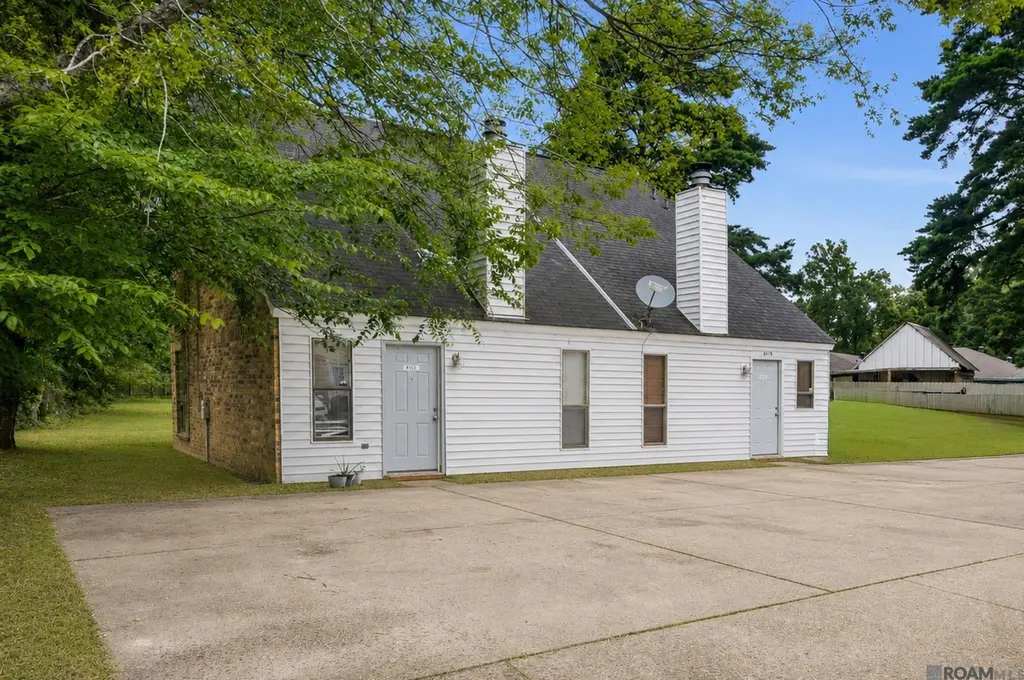
8152 Baringer Rd · Old Jefferson, LA
Flood risk 1/10 · Minimal
- FEMA flood zone
- X
- Chance of flooding over 30 yrs
- 0.0%
- Est. flood insurance / yr
- $507 – $1,088
Fire risk 1/10 · Minimal
- Est. fire insurance / yr
- $1,269 – $2,357
Heat risk 8/10 · Major
- Hot days now (above 108°F)
- 7 days/yr
- Hot days in 30 yrs
- 21 days/yr
Wind risk 9/10 · Severe
- Chance of severe wind over 30 yrs
- 99.0%
Air-quality risk 3/10 · Minor
- Unhealthy air days now
- 2 days/yr
- Unhealthy air days in 30 yrs
- 3 days/yr
Risk factors via First Street. Map © Google.
Why this score? — see what drove the C+ grade
The composite is a weighted blend of 9 inputs, each scored 0–100. Each bar is that input's sub-score; the figure is the points it added to the 100-point composite (weight × sub-score).
- Cash flow +28.4/30.0
- DSCR +10.0/10.0
- ARV discount +7.8/15.0
- 1% rule +7.2/10.0
- Livability +3.7/5.0
- Rent growth +3.0/5.0
- Condition / age +2.5/5.0
- Schools +2.4/10.0
- Appreciation +0.0/10.0
$130,000
🖨 Deal sheet 📄 Offer letter ✓ Due diligence
Listing remarks
Prime Location Location in Baton Rouge! Close to everything! Great for first time homebuyers or investors! This adorable 2 bedroom one and a half bath has an open floor plan i know you ll love! Close to shopping, restaurants and Woman's hospital Your at the heart of everything happening in Baton Rouge! St George School system! What are you waiting for schedule a private showing before its to late!!
Key facts
- Open floor plan
- 2 parking spots
- Built 1984
Tags
Property features AI
Exterior
- Parking: 2 parking spaces; Open parking available
- Home design: Attached townhouse (residential); Unit in a townhouse community; Located in Fox Run Townhouses
- Construction: Vinyl siding and brick exterior; Slab foundation; Built with shingle roofing
- Exterior features: Partial wood fencing; Shingle roof
Interior
- Flooring: Wood; Carpet; Laminate
- Bathrooms: 1 full bathroom; 1 partial bathroom
- Heating & cooling: Central heating; Central air conditioning
- Interior features: Fireplace (1); Wood, carpet and laminate flooring
Neighborhood map
What this means for you Summary
Snapshot
- This is a 2-bed/1.5-bath townhouse listed at $130k.
Deal economics
- At list price, monthly cash flow is $419 ($5k/yr) — positive.
- The deal already cash-flows at list — no discount required.
- Meets the 1% rule at list price ($2k rent vs $130k).
- Recommended offer: $128k (1.5% below list) — sets the bar for market timing.
- Cap rate 10.2% vs local median 4.4% in Old Jefferson — top-decile yield for the area; either an underpriced asset or a hidden risk that comps aren't pricing in. Stress-test before assuming the spread holds.
Location & tenants
- Location reads 73/100 on livability (#36 in LA) — a middle-class / working-renter tenant base. Strengths: schools A+, housing A+, employment A; Watch: amenities F, commute F.
- East Baton Rouge Parish (urban): math 22% / reading 34% proficiency, ranked #47 of 98 in LA (top 48%) — low school quality limits family demand, transient renter base, plan for 1-2y turnover; 77% free/reduced lunch — lower-income household profile, screen leases tightly.
- Market conditions: Rents rising (+2.0%/yr); 360 active listings in the ZIP; 9 comparable units currently listed for rent nearby; rentals lingering (median 44d on market — plan ~5-8 weeks vacancy on turnover, expect pricing pressure); 56% of comp listings sitting > 30 days — soft ceiling on asking rent; solid renter incomes; 2,252 units permitted in East Baton Rouge Parish in 2024 (440 in 5+ unit buildings).
Forward outlook
- Local home prices are declining (-3.0%/yr); year-one equity from $899 of loan paydown is wiped out by about $4k of value loss. Plan a longer hold.
- East Baton Rouge County population projected at +4% by 2050 — modest demand growth; plan on rents tracking national, not racing it.
- At projected returns (-3.0% appreciation + 2.0% rent growth), your $36k cash investment doubles in ~10 years — after that, you're playing with house money.
Negotiation context
- It's been on market 23 days — a 2% lower offer ($128k) is reasonable based on typical stale-listing flexibility.
- 7 sale attempts since 2y ago with the ask held roughly flat each time — persistent listings suggest the price (not the market) is what's stuck; bring a comps-based counter.
Risks & watch-outs
- Climate carrying-cost: severe wind risk, 99% chance of damaging wind over 30y; extreme-heat days projected 7→21/yr by 2055 (HVAC capex compounding) — expect insurance premiums to compound above CPI over the hold.
Questions for the listing agent
- Is there a deadline driving the sale (1031 exchange, divorce, estate, relocation)? That informs how much negotiation room exists.
- Schools are A-rated — typically a magnet for longer-tenancy family renters. What's the average tenant stay here, and is there a school-zone premium baked into asking?
- What's the average days-on-market for RENTAL listings here right now (not sales)? A rising rental-DOM trend means longer vacancies and softer asking-rent achievability than the comps imply.
- What's the recent tenant-quality profile in this submarket — average credit score on applications, eviction rate, late-payment / NSF rate, and stable-employment percentage? A property-management company in the area should have these aggregated.
- How much new for-sale + rental construction is in the pipeline within 1–3 miles? Heavy new supply typically softens prices + rents 12–24 months out; constrained supply supports both.
Investment metrics
- 1% rule
- 1.22% ✓
- Cap rate
- 10.16%
- Cash-on-cash
- 13.83%
- DSCR
- 1.62
- GRM
- 6.8
CMA / ARV
- ARV (on-the-fly)
- $131,000
- Comps found
- 2
Show comp detail 2 sales within ~0.75 mi
| Address | Dist | Beds/Ba | Sqft | Sold | Price | $/sf | Match |
|---|---|---|---|---|---|---|---|
| 15819 Maison Orleans Ct | 0.69mi | 2/2.5 | 1,136 (+14%) | 13mo | $125,000 | $110 | 30 |
| 15859 Maison Orleans Ct | 0.75mi | 2/2.5 | 1,135 (+14%) | 18mo | $149,000 | $131 | 24 |
Match score weights: distance 35% · size 25% · config 20% · recency 20%. Top-matched comps best support the ARV.
Projected returns pro-forma
-3.0% appreciation · 2.05% rent growth · sell at horizon
- IRR
- 3.0%
- Equity multiple
- 1.11×
- Total profit
- $4,127
- Equity at exit
- $19,383
- IRR
- 11.6%
- Equity multiple
- 1.88×
- Total profit
- $31,881
- Equity at exit
- $11,240
Cash invested: $36,400 (down + closing). Projections, not guarantees.
Landlord ↔ Tenant lean methodology
- Overall (STATE)
- 90 Strongly Landlord-Friendly
- State Louisiana
- 90 Strongly Landlord-Friendly · R+12
- County
- — inherits STATE
- City
- — inherits STATE
ZIP-level market 70817
- Rents YoY
- 2.0%
- Active inventory
- 360
- Price-to-rent
- 6.8×
Monthly cashflow live
- Estimated rent
- $1,584 high interval (Pro) →
- Mortgage (P&I)
- −$682
- Tax from tax record
- −$96 /mo · $1,148/yr
- Insurance
- −$54
- HOA
- −$0
- Vacancy / Maint / Mgmt
- −$333
- Net cashflow
- $419
Break-even live
UW: 25.0% down · 7.5% · 30yr · 1.5% tax · 5.0% vac · 8.0% maint · 8.0% mgmt
Financing live
Cash to close
- Down payment
- $32,500
- Closing costs
- $3,900
- Reserves months
- —
- Total cash needed
- —
Loan-product check · same deal, 3 products live
Conventional
25% down · 7.5% · 30yr
- Down + closing
- —
- Monthly P&I
- —
- Monthly cashflow
- —
- DSCR
- —
- Eligible?
- —
Personal DTI + credit; lowest rate.
DSCR
20% down · 8.5% · 30yr
- Down + closing
- —
- Monthly P&I
- —
- Monthly cashflow
- —
- DSCR
- —
- Eligible?
- —
No personal income docs; deal must DSCR.
Hard money
10% down · 12.0% · 12mo
- Down + closing
- —
- Monthly P&I
- —
- Monthly cashflow
- —
- DSCR
- —
- Eligible?
- —
Short-term bridge; refi at stabilization.
Rent comps 9 comps
| Address | Beds | Baths | Sqft | Rent | $/sqft | DOM | Units | Dist |
|---|---|---|---|---|---|---|---|---|
| 8154 Jefferson Park Dr Unit 8154 Baton Rouge, LA | 3.0 | 2.0 | 1200 | $1,200 | $1.00 | 43d | 1 | 0.16mi |
| 14810 Jefferson Hwy Baton Rouge, LA | 2.0 | 2.0 | 1101 | $1,979 | $1.80 | 43d | 1 | 0.42mi |
| 8028 Pine Valley Dr Baton Rouge, LA | 3.0 | 2.0 | 1124 | $2,100 | $1.87 | 43d | 1 | 0.47mi |
| 16124 Batavia Ave Baton Rouge, LA | 3.0 | 2.0 | 1417 | $1,700 | $1.20 | 43d | 1 | 0.78mi |
| 9113 Alder Dr Baton Rouge, LA | 3.0 | 2.0 | 1327 | $1,700 | $1.28 | 23d | 1 | 0.81mi |
| 16333 Columns Way Baton Rouge, LA | 1.0–3.0 | 1.0–2.0 | 1036 | $1,712 | $1.65 | 14d | 41 | 0.82mi |
| 15959 Tiger Bend Rd Baton Rouge, LA | 1.0–2.0 | 1.0–1.5 | 934 | $1,265 | $1.35 | 14d | 3 | 1.10mi |
| 14020 Tiger Bend Rd Apt 11 Baton Rouge, LA | 2.0 | 1.5 | 1176 | $1,100 | $0.94 | 23d | 1 | 1.14mi |
| 14020 Tiger Bend Rd Apt 4 Baton Rouge, LA | 2.0 | 1.5 | 1176 | $1,100 | $0.94 | 43d | 1 | 1.17mi |
Listing history 28 events
-
2026-06-18days on market $130,000 Active 23 DOM
-
2026-06-17days on market $130,000 Active 22 DOM
-
2026-06-16days on market $130,000 Active 21 DOM
-
2026-06-15days on market $130,000 Active 20 DOM
-
2026-06-14days on market $130,000 Active 18 DOM
-
2026-06-10days on market $130,000 Active 15 DOM
-
2026-06-09days on market $130,000 Active 14 DOM
-
2026-06-08days on market $130,000 Active 13 DOM
-
2026-06-07days on market $130,000 Active 12 DOM
-
2026-06-05days on market $130,000 Active 9 DOM
-
2026-06-03days on market $130,000 Active 8 DOM
-
2026-06-02days on market $130,000 Active 7 DOM
-
2026-06-01days on market $130,000 Active 6 DOM
-
2026-05-31days on market $130,000 Active 5 DOM
-
2026-05-31days on market $130,000 Active 4 DOM
-
2026-05-26$130,000 Active
-
2026-03-01historical $900
-
2026-02-04$900
-
2025-10-30historical $900
-
2025-09-18$900
-
2025-06-08historical $900
-
2025-05-01$900
-
2025-05-01historical $900
-
2025-04-26$900
-
2024-05-05historical $900
-
2024-05-03historical $900
-
2024-04-17$900
-
2024-04-17$900
ⓘ Source: listings_history table (triggers on properties + properties_extension) + one-shot
backfill from property_details.listing_events for pre-trigger history.
Tax reassessment forecast LA · Resets to sale price
- Current annual tax
- $1,148 · $96/mo
- Projected year-2 tax
- $1,148 · $96/mo
- Expected delta
- $0/yr ($0/mo · 0.0%)
ⓘ Screening estimate from a state-policy table — verify with the county assessor before closing.
Climate risk First Street
- Flood 1/10 Low FEMA zone X · 0% chance over 30 yrs
- Wildfire 1/10 Low
- Heat 8/10 Severe 7 d/yr ≥108°F today · 21 d/yr by 30 yrs out
- Wind 9/10 Extreme 99% chance of damaging wind over 30 yrs
- Air quality 3/10 Moderate 2 unhealthy d/yr today · 3 by 30 yrs out
Nearby sold comps map
Loading sold comps map…
Walkable amenities ~0.75 mi
Loading nearby amenities…
Taxation est. · year 1
- Rental income
- $19,002
- − Mortgage interest
- −$7,282
- − Property taxes
- −$1,148
- − Insurance
- −$650
- − Repairs & maintenance
- −$1,520
- − Management
- −$1,520
- − Depreciation
- −$3,782
- Taxable income
- $3,099
- Est. tax owed @ 24.0%
- −$744
- After-tax cash flow
- $4,288/yr
For passive investors: Depreciation is non-cash, so a rental often shows a tax loss while cash-flowing — sheltering income. Rental losses are passive: they offset passive income freely, and up to $25,000/yr can offset ordinary (W-2) income if you actively participate and your MAGI is under $100k (phasing out to $0 by $150k); unused losses carry forward. On sale, claimed depreciation is recaptured at up to 25%, and gains may owe capital-gains tax (a 1031 exchange can defer both). Figures are a year-1 estimate at your 24.0% rate — not tax advice; consult a CPA.
Schools (NCES district)
- District
- East Baton Rouge Parish
- NCES district ID
- 2200540
- Math proficiency
- 22% ▼ -36.00%
- Reading proficiency
- 34% ▼ -31.00%
- Median HH income
- $46,263
- Composite
- 24.14/100
- National rank
- #7745
- State rank
- #47 of 98 in LA
Livability — Old Jefferson
- Score
- 73/100
- State rank
- #36
- US rank
- #5501
Category grades
Schools grade is shown separately in the Schools card above.
Census & demographics
- Census place
- Old Jefferson, LA
- County
- East Baton Rouge Parish · 399,686 people
- Metro
- Baton Rouge, LA
- Population (ZIP)
- 33,482
- Household income
- $102,639
- Rent vs Own
- Severe rent burden
- 755.0
Population outlook (East Baton Rouge County) Hauer SSP2
- Today (2025)
- 464,810 people
- By 2030
- 472,137 · +1.6%
- By 2040
- 480,243 · +3.3%
- By 2050
- 484,422 · +4.2%
- By 2075
- 492,069 · +5.9%
- By 2100
- 476,347 · +2.5%
Race, ethnicity, and origin ACS 2023
- Neighborhood character
- Majority White (64%)
- Race & ethnicity
- White 64% Black 21% Two or more races 9% Hispanic / Latino 5% Asian 3%
- Common ancestry
- Lithuanian 13% Italian 2% Serbian 2%
- Foreign-born
- 6% · Canada, Vietnam, China
- Languages at home
- 91% English-only · Spanish 3% Arabic 1% Vietnamese 1%
Political lean MEDSL · East Baton Rouge
- 2024 margin
- D (+11.1) · D 54.5% · R 43.4% · Other 2.1%
- 2008→2024 swing
- +8.9pp toward D · 2008: 2.2pp · 2024: 11.1pp
- All cycles
- 2024: D+11.1 2020: D+13.1 2016: D+9.2 2012: D+5.2 2008: D+2.2
Not yet ingested
- Civics
- —
Market trends
- HPI YoY
- ▼ -149.27%
- Current HPI
- 170.6826
- Rent YoY
- ▲ 2.05%
- Metro
- Baton Rouge, LA
- State GDP YoY
- ▲ 3.29%
- F500 in state
- 10
Industry mix (Fortune 500 HQ in LA)
| Industry | F500 HQs | Revenue |
|---|---|---|
| Telecommunications | 2 | $23B |
|
||
| Utilities | 1 | $12B |
|
||
| Wholesale / Distribution | 1 | $5B |
|
||
| Advertising | 1 | $2B |
|
||
Price history
13 events — show timeline
- 2026-05-26 Listed $130,000 GBRMLS
- 2026-03-01 Rental Removed $900 TENANTTURNER2
- 2026-02-04 Listed for Rent $900 TENANTTURNER2
- 2025-10-30 Rental Removed $900 TENANTTURNER2
- 2025-09-18 Listed for Rent $900 TENANTTURNER2
- 2025-06-08 Rental Removed $900 TENANTTURNER2
- 2025-05-01 Listed for Rent $900 TENANTTURNER2
- 2025-05-01 Rental Removed $900 RENT.
- 2025-04-26 Listed for Rent $900 RENT.
- 2024-05-05 Rental Removed $900 APPFOLIO
- 2024-05-03 Rental Removed $900 RENT.
- 2024-04-17 Listed for Rent $900 RENT.
- 2024-04-17 Listed for Rent $900 APPFOLIO
Property tax history
+3.0%/yrLatest (2025): $1,148 · -0.5% YoY. Source: county tax records.
Cash-flow waterfall
monthlySold comps — $/sqft
last 12 mo · ≤1 miLoading sold comps…