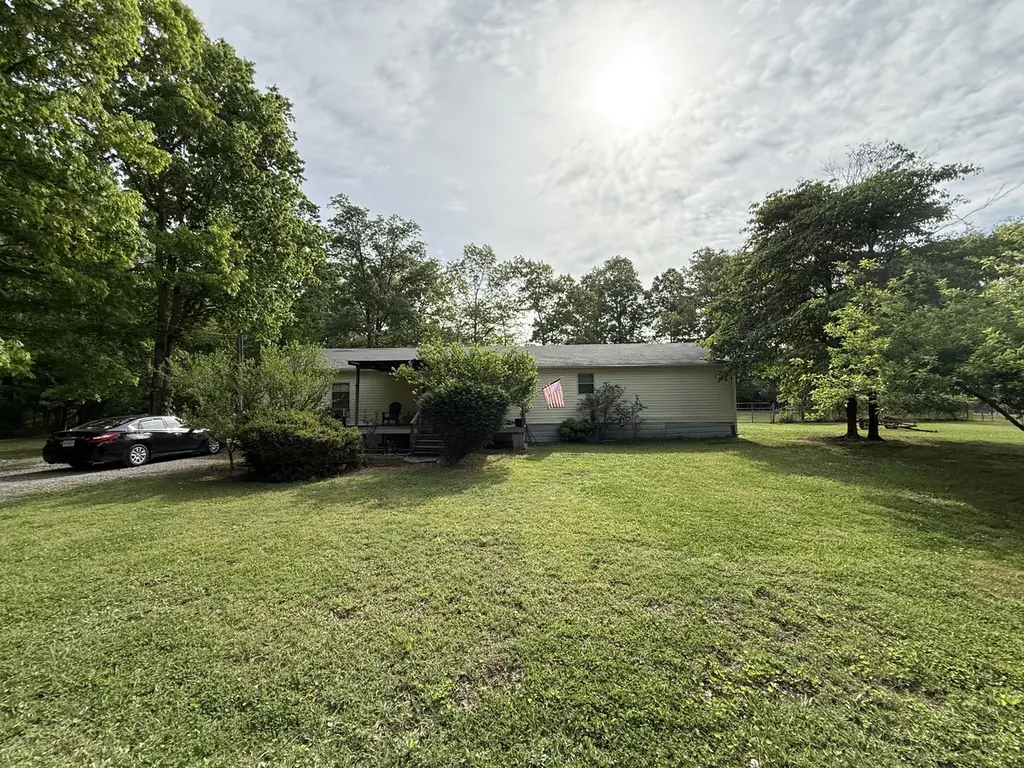
160 Oak Dr · Lakewood Park, TN
Flood risk 1/10 · Minimal
- FEMA flood zone
- X (unshaded)
- Chance of flooding over 30 yrs
- 0.0%
- Est. flood insurance / yr
- $507 – $1,088
Fire risk 3/10 · Minor
- Est. fire insurance / yr
- $949 – $1,763
Heat risk 4/10 · Minor
- Hot days now (above 103°F)
- 7 days/yr
- Hot days in 30 yrs
- 20 days/yr
Wind risk 4/10 · Minor
- Chance of severe wind over 30 yrs
- 8.0%
Air-quality risk 2/10 · Minimal
- Unhealthy air days now
- 1 days/yr
- Unhealthy air days in 30 yrs
- 2 days/yr
Risk factors via First Street. Map © Google.
Why this score? — see what drove the C- grade
The composite is a weighted blend of 9 inputs, each scored 0–100. Each bar is that input's sub-score; the figure is the points it added to the 100-point composite (weight × sub-score).
- Cash flow +16.3/30.0
- Appreciation +10.0/10.0
- ARV discount +7.7/15.0
- DSCR +5.1/10.0
- 1% rule +4.6/10.0
- Livability +2.6/5.0
- Rent growth +2.5/5.0
- Condition / age +2.5/5.0
- Schools +2.1/10.0
$140,000
🖨 Deal sheet 📄 Offer letter ✓ Due diligence
Listing remarks MLS
Mobile home on large lot with plenty of improvements! Roof, siding, central heat and air unit, water heater all recently replaced. Hot tub stays too! If measurements are important, please remeasure.
Key facts
- 0.96 acre lot
- Built 1999
- Listed 43 days
Property features AI
Finance
- Other: Directions provided to the property
- HOA & community: Has an HOA with an annual fee of $150 (includes grounds maintenance); Pets allowed
Exterior
- Parking: No covered parking reported; No off-street parking total reported
- Utilities: Well water; Private sewer; Electricity available
- Home design: Residential mobile home; Single-story (one level); Above-grade finished area about 1,820 square feet
- Construction: Vinyl siding; Foundation: Other; Year built: existing
- Exterior features: Back yard fencing; Lot roughly 0.96 acres with irregular dimensions (approx. 80.34 x 186.73)
Interior
- Kitchen: Kitchen present (approx. 13x12) with oven, range, dishwasher, and refrigerator
- Bedrooms: 5 bedrooms (all on the main level); Bedroom sizes include 9x12, 13x13, 13x11, and 11x12 with an extra-large closet
- Flooring: Laminate flooring
- Bathrooms: 3 full bathrooms
- Heating & cooling: Electric heating; Wall/window cooling units
- Interior features: Oven, Range, Dishwasher, Refrigerator, Washer, Dryer; Laminate flooring; No basement
- Laundry & utility: Washer and dryer; Utility room (approx. 12x7)
Neighborhood map
What this means for you Summary
Snapshot
- This is a 5-bed/3.0-bath other listed at $140k.
Deal economics
- At list price, monthly cash flow is $78 ($937/yr) — positive.
- The deal already cash-flows at list — no discount required.
- To meet the 1% rule (rent ≥ 1% of price), the offer needs to be $134k (4.3% below list).
- Recommended offer: $134k (4.3% below list) — sets the bar for 1% rule.
- Cap rate 7.0% vs local median 2.1% in Lakewood Park — top-decile yield for the area; either an underpriced asset or a hidden risk that comps aren't pricing in. Stress-test before assuming the spread holds.
Location & tenants
- Location reads 52/100 on livability (#395 in TN) — a working-class tenant base; expect higher turnover. Strengths: cost of living A+, housing A+; Watch: health & safety C-, crime F, amenities F.
- Coffee County (rural): math 22% / reading 27% proficiency, ranked #87 of 139 in TN (top 63%) — low school quality limits family demand, transient renter base, plan for 1-2y turnover.
- Zoned schools: Deerfield Elementary School (math 27% / reading 22%, grade F, #546 of 952 statewide, top 61%, 259 students, 0% FRL); Coffee County Central High School (math 10% / reading 31%, grade F, #175 of 332 statewide, top 53%, 1,285 students, 0% FRL) — zoned schools average 0% FRL vs 50% district-wide (50 pts lower); this property's tenant base skews higher-income than the district average.
- Market conditions: 36 active listings in the ZIP; 389 units permitted in Coffee County in 2024 (6 in 5+ unit buildings).
Forward outlook
- In year one you build about $15k of equity ($968 loan paydown + $14k appreciation (10.0% local appreciation)).
- Coffee County population projected at +9% by 2050 — modest demand growth; plan on rents tracking national, not racing it.
- At projected returns (10.0% appreciation + 3.0% rent growth), your $39k cash investment doubles in ~3 years — after that, you're playing with house money.
- By year 3, paydown + projected appreciation supports a ~$38k cash-out refi (75% LTV) — recoverable capital for the next deal without selling this one.
Negotiation context
- It's been on market 44 days — a 3% lower offer ($136k) is reasonable based on typical stale-listing flexibility.
- 2 sale attempts since 13y ago with the ask held roughly flat each time — persistent listings suggest the price (not the market) is what's stuck; bring a comps-based counter.
Questions for the listing agent
- It's been on market 44 days. Have you received any prior offers? Is the seller open to a 4% concession, seller financing, or rate buy-down credit?
- What does the HOA fee cover, when was the last increase, and are there any pending special assessments or reserve-fund shortfalls?
- Is there a deadline driving the sale (1031 exchange, divorce, estate, relocation)? That informs how much negotiation room exists.
- Schools are F-rated, which usually means shorter tenancies and higher turnover. Who's the typical renter profile here, and what's been the actual vacancy rate?
- Crime grade is F in this area — have there been break-ins, vandalism, or insurance claims at this property in the last 3 years? What carrier currently insures it and at what premium?
- What's the average days-on-market for RENTAL listings here right now (not sales)? A rising rental-DOM trend means longer vacancies and softer asking-rent achievability than the comps imply.
- What's the recent tenant-quality profile in this submarket — average credit score on applications, eviction rate, late-payment / NSF rate, and stable-employment percentage? A property-management company in the area should have these aggregated.
- How much new for-sale + rental construction is in the pipeline within 1–3 miles? Heavy new supply typically softens prices + rents 12–24 months out; constrained supply supports both.
Investment metrics
- 1% rule
- 0.96% ✗
- Cap rate
- 6.96%
- Cash-on-cash
- 2.39%
- DSCR
- 1.11
- GRM
- 8.7
CMA / ARV
- ARV (median comp)
- $140,487
- List price
- $140,000
- Delta
- -0.35%
- Verdict
- FAIR
- Comps
- 2 within 1.0 mi
Projected returns pro-forma
10.0% appreciation · 3.0% rent growth · sell at horizon
- IRR
- 26.0%
- Equity multiple
- 3.07×
- Total profit
- $81,250
- Equity at exit
- $126,123
- IRR
- 22.8%
- Equity multiple
- 7.01×
- Total profit
- $235,411
- Equity at exit
- $271,989
Cash invested: $39,200 (down + closing). Projections, not guarantees.
Landlord ↔ Tenant lean methodology
- Overall (STATE)
- 87 Strongly Landlord-Friendly
- State Tennessee
- 87 Strongly Landlord-Friendly · R+13
- County
- — inherits STATE
- City
- — inherits STATE
ZIP-level market 37018
- Home prices YoY
- 24.8%
- Active inventory
- 36
- Price-to-rent
- 8.7×
Monthly cashflow live
- Estimated rent
- $1,340 medium interval (Pro) →
- Mortgage (P&I)
- −$734
- Tax est. 1.5%
- −$175 /mo · $2,100/yr
- Insurance
- −$58
- HOA
- −$13
- Vacancy / Maint / Mgmt
- −$281
- Net cashflow
- $78
Break-even live
UW: 25.0% down · 7.5% · 30yr · 1.5% tax · 5.0% vac · 8.0% maint · 8.0% mgmt
Financing live
Cash to close
- Down payment
- $35,000
- Closing costs
- $4,200
- Reserves months
- —
- Total cash needed
- —
Loan-product check · same deal, 3 products live
Conventional
25% down · 7.5% · 30yr
- Down + closing
- —
- Monthly P&I
- —
- Monthly cashflow
- —
- DSCR
- —
- Eligible?
- —
Personal DTI + credit; lowest rate.
DSCR
20% down · 8.5% · 30yr
- Down + closing
- —
- Monthly P&I
- —
- Monthly cashflow
- —
- DSCR
- —
- Eligible?
- —
No personal income docs; deal must DSCR.
Hard money
10% down · 12.0% · 12mo
- Down + closing
- —
- Monthly P&I
- —
- Monthly cashflow
- —
- DSCR
- —
- Eligible?
- —
Short-term bridge; refi at stabilization.
HOA detail
- Monthly dues
- $13 · $156/yr
- Likely covers
- water
Listing history 19 events
-
2026-06-19days on market $140,000 Active 44 DOM
-
2026-06-18days on market $140,000 Active 43 DOM
-
2026-06-17days on market $140,000 Active 42 DOM
-
2026-06-16days on market $140,000 Active 41 DOM
-
2026-06-15days on market $140,000 Active 40 DOM
-
2026-06-14days on market $140,000 Active 38 DOM
-
2026-06-13days on market $140,000 Active 37 DOM
-
2026-06-10days on market $140,000 Active 35 DOM
-
2026-06-09days on market $140,000 Active 34 DOM
-
2026-06-08days on market $140,000 Active 33 DOM
-
2026-06-07days on market $140,000 Active 32 DOM
-
2026-06-05days on market $140,000 Active 29 DOM
-
2026-06-02days on market $140,000 Active 27 DOM
-
2026-06-01days on market $140,000 Active 26 DOM
-
2026-05-31days on market $140,000 Active 25 DOM
-
2026-05-30days on market $140,000 Active 24 DOM
-
2026-05-06$140,000 Active 734-char remark
-
2014-12-06historical 202-char remark
Show marketing remark (202 chars)
Mobile home on large lot with plenty of improvements! Roof, siding, central heat and air unit, water heater all recently replaced. Hot tub stays too! If measurements are important, please remeasure.
-
2013-10-27$43,000 202-char remark
Show marketing remark (202 chars)
Mobile home on large lot with plenty of improvements! Roof, siding, central heat and air unit, water heater all recently replaced. Hot tub stays too! If measurements are important, please remeasure.
ⓘ Source: listings_history table (triggers on properties + properties_extension) + one-shot
backfill from property_details.listing_events for pre-trigger history.
Climate risk First Street
- Flood 1/10 Low FEMA zone X (unshaded) · 0% chance over 30 yrs
- Wildfire 3/10 Moderate
- Heat 4/10 Moderate 7 d/yr ≥103°F today · 20 d/yr by 30 yrs out
- Wind 4/10 Moderate 8% chance of damaging wind over 30 yrs
- Air quality 2/10 Low 1 unhealthy d/yr today · 2 by 30 yrs out
Nearby sold comps map
Loading sold comps map…
Walkable amenities ~0.75 mi
Loading nearby amenities…
Taxation est. · year 1
- Rental income
- $16,080
- − Mortgage interest
- −$7,842
- − Property taxes
- −$2,100
- − Insurance
- −$700
- − Repairs & maintenance
- −$1,286
- − Management
- −$1,286
- − HOA
- −$156
- − Depreciation
- −$4,073
- Taxable loss
- −$1,364
- Est. tax savings @ 24.0%
- +$327
- After-tax cash flow
- $1,264/yr
For passive investors: Depreciation is non-cash, so a rental often shows a tax loss while cash-flowing — sheltering income. Rental losses are passive: they offset passive income freely, and up to $25,000/yr can offset ordinary (W-2) income if you actively participate and your MAGI is under $100k (phasing out to $0 by $150k); unused losses carry forward. On sale, claimed depreciation is recaptured at up to 25%, and gains may owe capital-gains tax (a 1031 exchange can defer both). Figures are a year-1 estimate at your 24.0% rate — not tax advice; consult a CPA.
Schools (NCES district)
- District
- Coffee County
- NCES district ID
- 4700780
- Math proficiency
- 22% ▼ -13.00%
- Reading proficiency
- 27% ▼ -9.00%
- Median HH income
- $44,951
- Composite
- 21.15/100
- National rank
- #8428
- State rank
- #87 of 139 in TN
Livability — Lakewood Park
- Score
- 52/100
- State rank
- #395
- US rank
- #24746
Category grades
Schools grade is shown separately in the Schools card above.
Census & demographics
- Census place
- Lakewood Park, TN
- Population (ZIP)
- 2,459
Population outlook (Coffee County) Hauer SSP2
- Today (2025)
- 57,234 people
- By 2030
- 58,571 · +2.3%
- By 2040
- 60,972 · +6.5%
- By 2050
- 62,537 · +9.3%
- By 2075
- 65,694 · +14.8%
- By 2100
- 63,355 · +10.7%
Race, ethnicity, and origin ACS 2023
- Neighborhood character
- Predominantly White (89%)
- Race & ethnicity
- White 89% Two or more races 6% Asian 3% Hispanic / Latino 3%
- Common ancestry
- Italian 3% Romanian 1% Slovak 1%
- Foreign-born
- 3%
- Languages at home
- 96% English-only · Other Indo-European 3% Spanish 1%
Political lean MEDSL · Coffee
- 2024 margin
- Solid R (+55.1) · D 21.8% · R 76.9% · Other 1.3%
- 2008→2024 swing
- -25.7pp toward R · 2008: -29.4pp · 2024: -55.1pp
- All cycles
- 2024: R+55.1 2020: R+50.2 2016: R+48.6 2012: R+37.1 2008: R+29.4
Not yet ingested
- Civics
- —
Market trends
- HPI YoY
- ▲ 103.01%
- Current HPI
- 518.5912
- Rent YoY
- —
- Metro
- —
- State GDP YoY
- ▲ 2.78%
- F500 in state
- 22
Industry mix (Fortune 500 HQ in TN)
| Industry | F500 HQs | Revenue |
|---|---|---|
| Healthcare | 3 | $91B |
|
||
| Retail | 3 | $72B |
|
||
| Transportation / Logistics | 1 | $88B |
|
||
| Paper / Packaging | 1 | $19B |
|
||
| Insurance | 1 | $13B |
|
||
| Energy | 1 | $12B |
|
||
Price history
+225.6% since first listed3 events — show timeline
- 2026-05-06 Listed $140,000 REALTRACS as Distributed by MLS Grid
- 2014-12-06 Listing Removed — REALTRACS as Distributed by MLS Grid
- 2013-10-27 Listed $43,000 REALTRACS as Distributed by MLS Grid
Property tax history
-4.8%/yrLatest (2025): $182 · +0.0% YoY. Source: county tax records.
Cash-flow waterfall
monthlySold comps — $/sqft
last 12 mo · ≤1 miLoading sold comps…