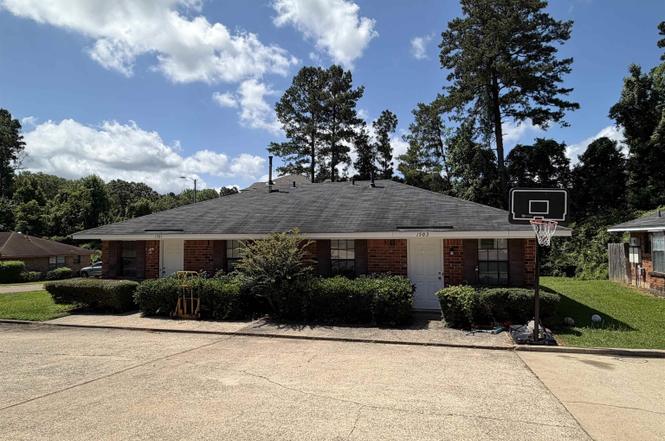
1501 Jewel St Unit 1503 Jewel · Ruston, LA
Flood risk 1/10 · Minimal
- FEMA flood zone
- X (unshaded)
- Chance of flooding over 30 yrs
- 0.0%
- Est. flood insurance / yr
- $507 – $1,088
Fire risk 3/10 · Minor
- Est. fire insurance / yr
- $1,269 – $2,357
Heat risk 7/10 · Major
- Hot days now (above 111°F)
- 7 days/yr
- Hot days in 30 yrs
- 21 days/yr
Wind risk 6/10 · Moderate
- Chance of severe wind over 30 yrs
- 73.0%
Air-quality risk 1/10 · Minimal
- Unhealthy air days now
- 0 days/yr
- Unhealthy air days in 30 yrs
- 0 days/yr
Risk factors via First Street. Map © Google.
Why this score? — see what drove the C- grade
The composite is a weighted blend of 9 inputs, each scored 0–100. Each bar is that input's sub-score; the figure is the points it added to the 100-point composite (weight × sub-score).
- Cash flow +19.5/30.0
- ARV discount +7.5/15.0
- DSCR +6.2/10.0
- 1% rule +5.2/10.0
- Rent growth +4.2/5.0
- Livability +3.4/5.0
- Schools +3.3/10.0
- Condition / age +2.2/5.0
- Appreciation +0.0/10.0
$175,000
🖨 Deal sheet 📄 Offer letter ✓ Due diligence
Listing remarks
Income-Producing Duplex in North Ruston! Add this fully occupied duplex to your investment portfolio and start collecting income from day one. Featuring two units, each offering 2 bedrooms and 1 bathrooms, this property provides a layout that continues to attract long-term tenants. Ideally situated in North Ruston, residents enjoy convenient access to shopping, dining, medical services, and major transportation routes. The property is currently generating $1,450 per month in rental income with both sides occupied, offering immediate cash flow for investors. Whether you're a seasoned investor or looking to purchase your first rental property, this duplex presents an excellent opportunity in
Key facts
- Listed 2 days
Tags
Property features AI
Exterior
- Parking: Open parking available
- Security: Smoke detector(s)
- Utilities: Public water; Public sewer; Natural gas not available
- Home design: Duplex (residential income property)
- Construction: Brick veneer construction; Asphalt roof; Slab foundation; Built with public utilities available
- Exterior features: No patio or porch; Paved road access
Interior
- Kitchen: Dishwasher; Electric water heater
- Heating & cooling: Central heating; Central air; Ceiling fan(s) for cooling
- Interior features: Ceiling fans throughout; Smoke detectors
- Laundry & utility: In-unit laundry
Neighborhood map
What this means for you Summary
Snapshot
- This is a 4-bed/?-bath condo listed at $175k. Condition is rated fair.
Deal economics
- At list price, monthly cash flow is $200 ($2k/yr) — positive.
- The deal already cash-flows at list — no discount required.
- Meets the 1% rule at list price ($2k rent vs $175k).
- Cap rate 7.7% vs local median 3.2% in Ruston — top-decile yield for the area; either an underpriced asset or a hidden risk that comps aren't pricing in. Stress-test before assuming the spread holds.
Location & tenants
- Location reads 68/100 on livability (#86 in LA) — a middle-class / working-renter tenant base. Strengths: cost of living A+, health & safety A+; Watch: amenities C-, crime F, commute F.
- Lincoln Parish (town): math 35% / reading 45% proficiency, ranked #24 of 98 in LA (top 24%) — families likely to look elsewhere, expect single-tenant / working-renter base with shorter leases; 62% free/reduced lunch — lower-income household profile, screen leases tightly.
- Market conditions: Rents rising fast (+6.6%/yr); 276 active listings in the ZIP; 5 comparable units currently listed for rent nearby; rentals lingering (median 44d on market — plan ~5-8 weeks vacancy on turnover, expect pricing pressure); 100% of comp listings sitting > 30 days — soft ceiling on asking rent; lower-income renter base — watch delinquency; 171 units permitted in Lincoln Parish in 2024 (0 in 5+ unit buildings).
- At $1,784/mo this rent would consume 58% of the median local household income ($37k/yr) (locally 2476% of renters already pay >50% of income on rent) — very limited rent-growth headroom before tenants either downsize or default.
Forward outlook
- Local home prices are declining (-3.0%/yr); year-one equity from $1k of loan paydown is wiped out by about $5k of value loss. Plan a longer hold.
- Lincoln County population projected at +15% by 2050 — long-run rental-demand tailwind backs the buy-and-hold thesis.
- At projected returns (-3.0% appreciation + 6.6% rent growth), your $49k cash investment doubles in ~10 years — after that, you're playing with house money.
Negotiation context
- Only 2 days on market — expect competitive offers; lowballing is unlikely to land.
Risks & watch-outs
- Climate carrying-cost: major wind risk, 73% chance of damaging wind over 30y; extreme-heat days projected 7→21/yr by 2055 (HVAC capex compounding) — expect insurance premiums to compound above CPI over the hold.
Questions for the listing agent
- Have any recent inspections been done? Can we get a copy of the seller's disclosures and any deferred-maintenance estimates?
- Any open or pending special assessments — roof, HVAC, plumbing, elevator, façade? What's the per-unit balance and payoff schedule, and is the seller paying it off at close or rolling it to the buyer?
- Is there a deadline driving the sale (1031 exchange, divorce, estate, relocation)? That informs how much negotiation room exists.
- Schools are B-rated — typically a magnet for longer-tenancy family renters. What's the average tenant stay here, and is there a school-zone premium baked into asking?
- Crime grade is F in this area — have there been break-ins, vandalism, or insurance claims at this property in the last 3 years? What carrier currently insures it and at what premium?
- What's the average days-on-market for RENTAL listings here right now (not sales)? A rising rental-DOM trend means longer vacancies and softer asking-rent achievability than the comps imply.
- What's the recent tenant-quality profile in this submarket — average credit score on applications, eviction rate, late-payment / NSF rate, and stable-employment percentage? A property-management company in the area should have these aggregated.
- How much new apartment / multifamily construction is in the pipeline within 1–3 miles? Heavy new supply (>2% of stock underway) typically softens rents 12–24 months out; light construction supports rent growth.
Investment metrics
- 1% rule
- 1.02% ✓
- Cap rate
- 7.66%
- Cash-on-cash
- 4.89%
- DSCR
- 1.22
- GRM
- 8.2
CMA / ARV
No comps found within radius.
Projected returns pro-forma
-3.0% appreciation · 6.6% rent growth · sell at horizon
- IRR
- -4.7%
- Equity multiple
- 0.82×
- Total profit
- $-8,919
- Equity at exit
- $26,093
- IRR
- 8.8%
- Equity multiple
- 1.78×
- Total profit
- $38,301
- Equity at exit
- $15,131
Cash invested: $49,000 (down + closing). Projections, not guarantees.
Landlord ↔ Tenant lean methodology
- Overall (STATE)
- 90 Strongly Landlord-Friendly
- State Louisiana
- 90 Strongly Landlord-Friendly · R+12
- County
- — inherits STATE
- City
- — inherits STATE
ZIP-level market 71270
- Home prices YoY
- -16.1%
- Rents YoY
- 6.6%
- Active inventory
- 276
- Price-to-rent
- 8.2×
Monthly cashflow live
- Estimated rent
- $1,784 high interval (Pro) →
- Mortgage (P&I)
- −$918
- Tax est. 1.5%
- −$219 /mo · $2,625/yr
- Insurance
- −$73
- HOA
- −$0
- Vacancy / Maint / Mgmt
- −$375
- Net cashflow
- $200
Break-even live
UW: 25.0% down · 7.5% · 30yr · 1.5% tax · 5.0% vac · 8.0% maint · 8.0% mgmt
Financing live
Cash to close
- Down payment
- $43,750
- Closing costs
- $5,250
- Reserves months
- —
- Total cash needed
- —
Loan-product check · same deal, 3 products live
Conventional
25% down · 7.5% · 30yr
- Down + closing
- —
- Monthly P&I
- —
- Monthly cashflow
- —
- DSCR
- —
- Eligible?
- —
Personal DTI + credit; lowest rate.
DSCR
20% down · 8.5% · 30yr
- Down + closing
- —
- Monthly P&I
- —
- Monthly cashflow
- —
- DSCR
- —
- Eligible?
- —
No personal income docs; deal must DSCR.
Hard money
10% down · 12.0% · 12mo
- Down + closing
- —
- Monthly P&I
- —
- Monthly cashflow
- —
- DSCR
- —
- Eligible?
- —
Short-term bridge; refi at stabilization.
Rent comps 5 comps
| Address | Beds | Baths | Sqft | Rent | $/sqft | DOM | Units | Dist |
|---|---|---|---|---|---|---|---|---|
| 907 Arnold St Ruston, LA | 3.0 | 2.0 | — | $1,900 | — | 43d | 1 | 0.47mi |
| 2015 Alexander Ave Ruston, LA | 3.0 | 2.0 | 1550 | $1,750 | $1.13 | 43d | 1 | 0.69mi |
| 209 Goode Ave Ruston, LA | 3.0 | 2.0 | 1600 | $2,100 | $1.31 | 43d | 1 | 0.84mi |
| 1608 W Kentucky Ave Ruston, LA | 4.0 | 3.0 | 2000 | $1,800 | $0.90 | 43d | 1 | 0.95mi |
| 705 Tech Dr Ruston, LA | 3.0 | 1.0 | 1192 | $1,200 | $1.01 | 43d | 1 | 1.47mi |
HOA detail condo
- Monthly dues
- $0 · $0/yr
- Assessments
- None detected in remarks — confirm with the listing agent.
Listing history 4 events
-
2026-06-17status $175,000 Pending 2 DOM
-
2026-06-17days on market $175,000 Active 2 DOM
-
2026-06-16remarks 699-char remark
-
2026-06-16$175,000 Active 1 DOM
ⓘ Source: listings_history table (triggers on properties + properties_extension) + one-shot
backfill from property_details.listing_events for pre-trigger history.
Climate risk First Street
- Flood 1/10 Low FEMA zone X (unshaded) · 0% chance over 30 yrs
- Wildfire 3/10 Moderate
- Heat 7/10 Severe 7 d/yr ≥111°F today · 21 d/yr by 30 yrs out
- Wind 6/10 Major 73% chance of damaging wind over 30 yrs
- Air quality 1/10 Low 0 unhealthy d/yr today · 0 by 30 yrs out
Nearby sold comps map
Loading sold comps map…
Walkable amenities ~0.75 mi
Loading nearby amenities…
Taxation est. · year 1
- Rental income
- $21,403
- − Mortgage interest
- −$9,803
- − Property taxes
- −$2,625
- − Insurance
- −$875
- − Repairs & maintenance
- −$1,712
- − Management
- −$1,712
- − Depreciation
- −$5,091
- Taxable loss
- −$415
- Est. tax savings @ 24.0%
- +$100
- After-tax cash flow
- $2,496/yr
For passive investors: Depreciation is non-cash, so a rental often shows a tax loss while cash-flowing — sheltering income. Rental losses are passive: they offset passive income freely, and up to $25,000/yr can offset ordinary (W-2) income if you actively participate and your MAGI is under $100k (phasing out to $0 by $150k); unused losses carry forward. On sale, claimed depreciation is recaptured at up to 25%, and gains may owe capital-gains tax (a 1031 exchange can defer both). Figures are a year-1 estimate at your 24.0% rate — not tax advice; consult a CPA.
Condition & rehab AI · 2 photos
The property is in fair condition with moderate rehabilitation needs, primarily focusing on landscaping and exterior painting to enhance its curb appeal and overall value.
Repairs flagged
- Major Landscaping — Overgrown and minimal landscaping
- Moderate Exterior paint — Siding appears faded and in need of repainting
Value-add opportunities
- Both Landscaping — Enhances curb appeal and property value
- Both Exterior paint — Improves the home's appearance and value
Renovation cost estimate screening
| Repair item | Severity | Est. cost |
|---|---|---|
| Landscaping · Overgrown and minimal landscaping | Major | $15,000–50,000 |
| Exterior paint · Siding appears faded and in need of repainting | Moderate | $3,000–15,000 |
| Total estimated repair cost · 2 items | $18,000–65,000 |
Value-add ROI direction
- Both Landscaping — Enhances curb appeal and property value ↑
- Both Exterior paint — Improves the home's appearance and value ↑
ⓘ Cost ranges are severity-bucket heuristics (US national rule-of-thumb). Get contractor quotes + a written scope before underwriting a rehab budget.
Schools (NCES district)
- District
- Lincoln Parish
- NCES district ID
- 2200990
- Math proficiency
- 35% ▼ -32.00%
- Reading proficiency
- 45% ▼ -27.00%
- Median HH income
- $33,901
- Composite
- 32.92/100
- National rank
- #5599
- State rank
- #24 of 98 in LA
Livability — Ruston
- Score
- 68/100
- State rank
- #86
- US rank
- #9522
Category grades
Schools grade is shown separately in the Schools card above.
Census & demographics
- Census place
- Ruston, LA
- County
- Lincoln Parish · 32,885 people
- City population
- 32,885
- Metro
- Ruston, LA
- Population (ZIP)
- 32,885
- Household income
- $36,791
- Rent vs Own
- Severe rent burden
- 2476.0
Population outlook (Lincoln County) Hauer SSP2
- Today (2025)
- 49,595 people
- By 2030
- 50,954 · +2.7%
- By 2040
- 53,601 · +8.1%
- By 2050
- 57,178 · +15.3%
- By 2075
- 69,580 · +40.3%
- By 2100
- 79,862 · +61.0%
Race, ethnicity, and origin ACS 2023
- Neighborhood character
- Diverse neighborhood (Simpson 0.60)
- Race & ethnicity
- White 51% Black 38% Two or more races 6% Hispanic / Latino 4% Asian 2% Native American 1%
- Common ancestry
- Lithuanian 4% Slovak 2% Serbian 1%
- Foreign-born
- 3% · Canada, Vietnam
- Languages at home
- 95% English-only · Spanish 2% Other Indo-European 1% Arabic 1%
Political lean MEDSL · Lincoln
- 2024 margin
- Strong R (+25.4) · D 36.5% · R 62.0% · Other 1.6%
- 2008→2024 swing
- -13.0pp toward R · 2008: -12.5pp · 2024: -25.4pp
- All cycles
- 2024: R+25.4 2020: R+19.5 2016: R+19.6 2012: R+14.7 2008: R+12.5
Not yet ingested
- Civics
- —
Market trends
- HPI YoY
- ▼ -40.69%
- Current HPI
- 212.8211
- Rent YoY
- ▲ 6.60%
- Metro
- Ruston, LA
- State GDP YoY
- ▲ 3.29%
- F500 in state
- 10
Industry mix (Fortune 500 HQ in LA)
| Industry | F500 HQs | Revenue |
|---|---|---|
| Telecommunications | 2 | $23B |
|
||
| Utilities | 1 | $12B |
|
||
| Wholesale / Distribution | 1 | $5B |
|
||
| Advertising | 1 | $2B |
|
||
Price history
+2.9% since first listed2 events — show timeline
- 2026-06-16 Price Changed $175,000 NELABOR
- 2026-06-16 Listed $170,000 NELABOR
Cash-flow waterfall
monthlySold comps — $/sqft
last 12 mo · ≤1 miLoading sold comps…