1925 Big Vein Rd · Parrott, VA
Flood risk 1/10 · Minimal
- FEMA flood zone
- X (unshaded)
- Chance of flooding over 30 yrs
- 0.0%
- Est. flood insurance / yr
- $507 – $1,088
Fire risk 5/10 · Moderate
- Est. fire insurance / yr
- $666 – $1,236
Heat risk 3/10 · Minor
- Hot days now (above 96°F)
- 7 days/yr
- Hot days in 30 yrs
- 20 days/yr
Wind risk 2/10 · Minimal
- Chance of severe wind over 30 yrs
- 0.0%
Air-quality risk 1/10 · Minimal
- Unhealthy air days now
- 0 days/yr
- Unhealthy air days in 30 yrs
- 0 days/yr
Risk factors via First Street. Map © Google.
Why this score? — see what drove the C+ grade
The composite is a weighted blend of 9 inputs, each scored 0–100. Each bar is that input's sub-score; the figure is the points it added to the 100-point composite (weight × sub-score).
- Cash flow +25.6/30.0
- DSCR +8.5/10.0
- ARV discount +7.5/15.0
- 1% rule +5.6/10.0
- Schools +5.4/10.0
- Rent growth +3.5/5.0
- Condition / age +2.5/5.0
- Livability +2.0/5.0
- Appreciation +0.0/10.0
$179,500
🖨 Deal sheet 📄 Offer letter ✓ Due diligence
Listing remarks
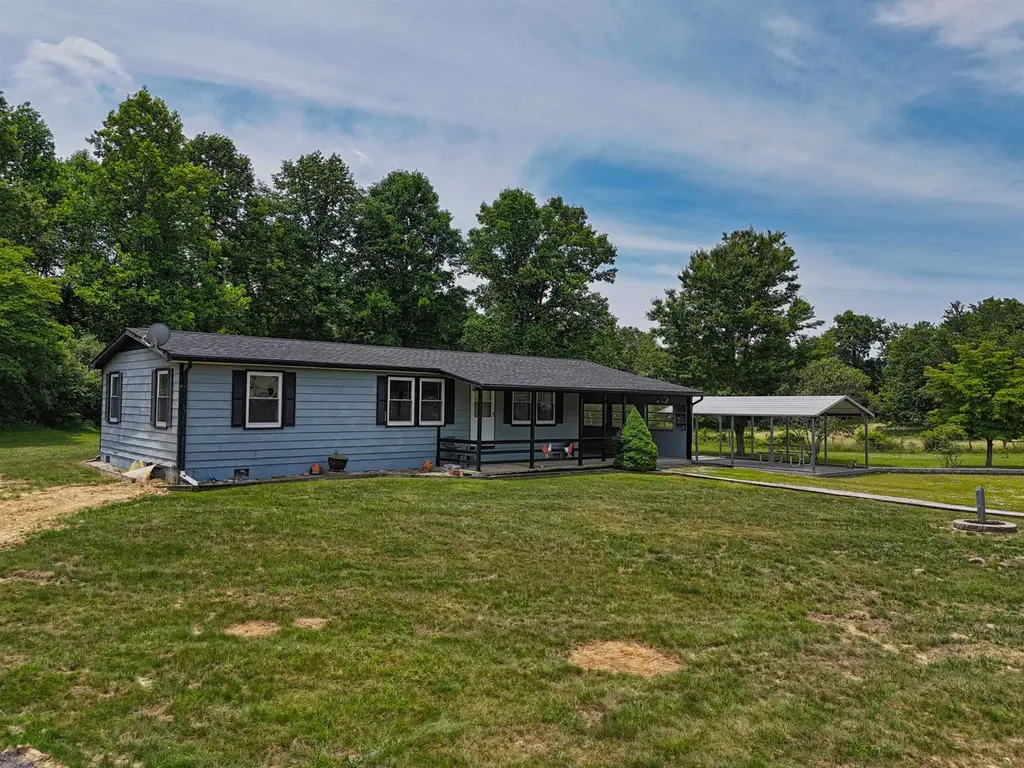
Enjoy the perfect blend of country living and convenience with this charming 3-bedroom, 1-bath home tucked away in a peaceful rural setting, just minutes from town. The 1.6-acre lot offers plenty of room for gardening, outdoor recreation, pets, or simply enjoying the open space. Inside, the home's manageable size makes upkeep easy and efficient. Recent improvements include a new well, a newer roof, and carpet. Outside, you'll find two carports for covered parking and a storage shed for tools and equipment. Whether you're looking for a starter home, downsizing, or seeking a quiet retreat with room to roam, this property is ready to welcome you home.
Key facts
- Outdoor recreation
- New well
- Newer roof
Tags
Property features AI
Finance
- Other: Property classified as residential, mobile home; Lot about 1.62 acres
Exterior
- Parking: Gravel parking
- Utilities: Private well water; Septic tank
- Home design: Mobile home (detached); One story; Entry level on one floor; Shingle roof
- Construction: Aluminum siding; Built as single-level structure
- Exterior features: Porch; Garden; Shed(s); Private maintained road; Agricultural zoning
Interior
- Kitchen: Electric range; Refrigerator; Dishwasher not listed
- Flooring: Carpet; Vinyl
- Bathrooms: One full bathroom
- Heating & cooling: Electric baseboard heating; Window air conditioning unit(s)
- Interior features: Electric water heater; Garden view; Porch
- Laundry & utility: Washer; Dryer
Neighborhood map
What this means for you Summary
Snapshot
- This is a 3-bed/1.0-bath manufactured listed at $180k.
Deal economics
- At list price, monthly cash flow is $422 ($5k/yr) — positive.
- The deal already cash-flows at list — no discount required.
- Meets the 1% rule at list price ($2k rent vs $180k).
Location & tenants
- Location reads 39/100 on livability (#578 in VA) — a limited-amenity area; tenant pool skews transient or value-seeking. Strengths: cost of living A+, crime A; Watch: amenities F, commute F, employment F.
- Montgomery County Public School District (urban): math 57% / reading 70% proficiency, ranked #47 of 131 in VA (top 36%) — acceptable for families but not a draw, mixed tenant base, ~2y average lease.
- Zoned schools: Blacksburg Middle (math 62% / reading 77%, grade A, #85 of 342 statewide, top 26%, 946 students, 30% FRL); Blacksburg High (math 80% / reading 92%, grade A, #20 of 319 statewide, top 6%, 1,321 students, 23% FRL).
- Zoned-school proficiency averages 78% at this address vs 64% district-wide (+14 pts) — the actual schools serving this property are materially stronger than the Montgomery County Public School District average implies; a family-tenant draw the district grade alone would hide.
- Market conditions: Rents rising (+4.0%/yr); 313 active listings in the ZIP; 323 units permitted in Montgomery County in 2024 (0 in 5+ unit buildings).
- This rent runs 34% of the median local income ($68k/yr) — at the standard rent-burdened threshold; future hikes will face affordability resistance.
Forward outlook
- Local home prices are declining (-3.0%/yr); year-one equity from $1k of loan paydown is wiped out by about $5k of value loss. Plan a longer hold.
- Montgomery County population projected at +13% by 2050 — modest demand growth; plan on rents tracking national, not racing it.
- At projected returns (-3.0% appreciation + 4.0% rent growth), your $50k cash investment doubles in ~10 years — after that, you're playing with house money.
Negotiation context
- Only 8 days on market — expect competitive offers; lowballing is unlikely to land.
Risks & watch-outs
- Climate carrying-cost: moderate wildfire risk — expect insurance premiums to compound above CPI over the hold.
Questions for the listing agent
- Built in 1976 — when were the roof, HVAC, electrical panel, plumbing, and water heater last replaced?
- Is there a deadline driving the sale (1031 exchange, divorce, estate, relocation)? That informs how much negotiation room exists.
- Schools are F-rated, which usually means shorter tenancies and higher turnover. Who's the typical renter profile here, and what's been the actual vacancy rate?
- What's the average days-on-market for RENTAL listings here right now (not sales)? A rising rental-DOM trend means longer vacancies and softer asking-rent achievability than the comps imply.
- What's the recent tenant-quality profile in this submarket — average credit score on applications, eviction rate, late-payment / NSF rate, and stable-employment percentage? A property-management company in the area should have these aggregated.
- How much new for-sale + rental construction is in the pipeline within 1–3 miles? Heavy new supply typically softens prices + rents 12–24 months out; constrained supply supports both.
Investment metrics
- 1% rule
- 1.06% ✓
- Cap rate
- 9.12%
- Cash-on-cash
- 10.09%
- DSCR
- 1.45
- GRM
- 7.8
CMA / ARV
No comps found within radius.
Projected returns pro-forma
-3.0% appreciation · 3.95% rent growth · sell at horizon
- IRR
- -0.2%
- Equity multiple
- 0.99×
- Total profit
- $-401
- Equity at exit
- $26,764
- IRR
- 10.3%
- Equity multiple
- 1.83×
- Total profit
- $41,749
- Equity at exit
- $15,520
Cash invested: $50,260 (down + closing). Projections, not guarantees.
Landlord ↔ Tenant lean methodology
- Overall (STATE)
- 55 Moderately Landlord-Leaning
- State Virginia
- 55 Moderately Landlord-Leaning · D+2
- County
- — inherits STATE
- City
- — inherits STATE
ZIP-level market 24060
- Rents YoY
- 4.0%
- Active inventory
- 313
- Price-to-rent
- 7.8×
Monthly cashflow live
- Estimated rent
- $1,912 medium interval (Pro) →
- Mortgage (P&I)
- −$941
- Tax from tax record
- −$72 /mo · $859/yr
- Insurance
- −$75
- HOA
- −$0
- Vacancy / Maint / Mgmt
- −$401
- Net cashflow
- $422
Break-even live
UW: 25.0% down · 7.5% · 30yr · 1.5% tax · 5.0% vac · 8.0% maint · 8.0% mgmt
Financing live
Cash to close
- Down payment
- $44,875
- Closing costs
- $5,385
- Reserves months
- —
- Total cash needed
- —
Loan-product check · same deal, 3 products live
Conventional
25% down · 7.5% · 30yr
- Down + closing
- —
- Monthly P&I
- —
- Monthly cashflow
- —
- DSCR
- —
- Eligible?
- —
Personal DTI + credit; lowest rate.
DSCR
20% down · 8.5% · 30yr
- Down + closing
- —
- Monthly P&I
- —
- Monthly cashflow
- —
- DSCR
- —
- Eligible?
- —
No personal income docs; deal must DSCR.
Hard money
10% down · 12.0% · 12mo
- Down + closing
- —
- Monthly P&I
- —
- Monthly cashflow
- —
- DSCR
- —
- Eligible?
- —
Short-term bridge; refi at stabilization.
Listing history 8 events
-
2026-06-17status $179,500 Pending 8 DOM
-
2026-06-16days on market $179,500 Active 8 DOM
-
2026-06-15days on market $179,500 Active 7 DOM
-
2026-06-14days on market $179,500 Active 5 DOM
-
2026-06-13days on market $179,500 Active 4 DOM
-
2026-06-10days on market $179,500 Active 2 DOM
-
2026-06-09remarks 656-char remark
-
2026-06-09$179,500 Active 1 DOM
ⓘ Source: listings_history table (triggers on properties + properties_extension) + one-shot
backfill from property_details.listing_events for pre-trigger history.
Tax reassessment forecast VA · Resets to sale price
- Current annual tax
- $859 · $72/mo
- Projected year-2 tax
- $1,472 · $123/mo
- Expected delta
- +$613/yr (+$51/mo · 71.4%)
ⓘ Screening estimate from a state-policy table — verify with the county assessor before closing.
Climate risk First Street
- Flood 1/10 Low FEMA zone X (unshaded) · 0% chance over 30 yrs
- Wildfire 5/10 Major
- Heat 3/10 Moderate 7 d/yr ≥96°F today · 20 d/yr by 30 yrs out
- Wind 2/10 Low 0% chance of damaging wind over 30 yrs
- Air quality 1/10 Low 0 unhealthy d/yr today · 0 by 30 yrs out
Nearby sold comps map
Loading sold comps map…
Walkable amenities ~0.75 mi
Loading nearby amenities…
Taxation est. · year 1
- Rental income
- $22,939
- − Mortgage interest
- −$10,055
- − Property taxes
- −$859
- − Insurance
- −$898
- − Repairs & maintenance
- −$1,835
- − Management
- −$1,835
- − Depreciation
- −$5,222
- Taxable income
- $2,236
- Est. tax owed @ 24.0%
- −$537
- After-tax cash flow
- $4,533/yr
For passive investors: Depreciation is non-cash, so a rental often shows a tax loss while cash-flowing — sheltering income. Rental losses are passive: they offset passive income freely, and up to $25,000/yr can offset ordinary (W-2) income if you actively participate and your MAGI is under $100k (phasing out to $0 by $150k); unused losses carry forward. On sale, claimed depreciation is recaptured at up to 25%, and gains may owe capital-gains tax (a 1031 exchange can defer both). Figures are a year-1 estimate at your 24.0% rate — not tax advice; consult a CPA.
Schools (NCES district)
- District
- Montgomery County Public School District
- NCES district ID
- 5102520
- Math proficiency
- 57% ▼ -29.00%
- Reading proficiency
- 70% ▼ -11.00%
- Median HH income
- $46,618
- Composite
- 53.6/100
- National rank
- #1440
- State rank
- #47 of 131 in VA
Livability — Parrott
- Score
- 39/100
- State rank
- #578
- US rank
- #27384
Category grades
Schools grade is shown separately in the Schools card above.
Census & demographics
- County
- Montgomery County · 78,218 people
- Metro
- Blacksburg-Christiansburg, VA
- Population (ZIP)
- 48,541
- Household income
- $67,675
- Rent vs Own
- Severe rent burden
- 3694.0
Population outlook (Montgomery County) Hauer SSP2
- Today (2025)
- 105,748 people
- By 2030
- 110,301 · +4.3%
- By 2040
- 115,652 · +9.4%
- By 2050
- 119,651 · +13.1%
- By 2075
- 126,005 · +19.2%
- By 2100
- 129,771 · +22.7%
Race, ethnicity, and origin ACS 2023
- Neighborhood character
- Predominantly White (80%)
- Race & ethnicity
- White 80% Asian 8% Two or more races 4% Hispanic / Latino 4% Black 3%
- Common ancestry
- Romanian 3% Italian 3% Slovak 2%
- Foreign-born
- 14% · China, Canada, South Korea
- Languages at home
- 86% English-only · Other Indo-European 4% Chinese 3% Spanish 3%
Political lean MEDSL · Montgomery
- 2024 margin
- Toss-up / Even · D 50.9% · R 47.4% · Other 1.7%
- 2008→2024 swing
- -1.4pp toward R · 2008: 4.9pp · 2024: 3.5pp
- All cycles
- 2024: D+3.5 2020: D+5.8 2016: D+1.3 2012: R+0.2 2008: D+4.9
Not yet ingested
- Civics
- —
Market trends
- HPI YoY
- ▼ -176.54%
- Current HPI
- 289.8166
- Rent YoY
- ▲ 3.95%
- Metro
- Blacksburg-Christiansburg, VA
- State GDP YoY
- ▲ 2.40%
- F500 in state
- 50
Industry mix (Fortune 500 HQ in VA)
| Industry | F500 HQs | Revenue |
|---|---|---|
| Aerospace / Defense | 4 | $236B |
|
||
| Technology / Defense | 3 | $32B |
|
||
| Financial Services | 2 | $176B |
|
||
| Utilities | 2 | $27B |
|
||
| Insurance | 2 | $25B |
|
||
| Technology | 2 | $15B |
|
||
Price history
1 event — show timeline
- 2026-06-08 Listed $179,500 NRVMLS
Property tax history
+1.2%/yrLatest (2025): $859 · +1.3% YoY. Source: county tax records.
Cash-flow waterfall
monthlySold comps — $/sqft
last 12 mo · ≤1 miLoading sold comps…