 🏗️ New Construction
940 Pertuso Ln · Plum Grove, TX
Flood risk No data
- FEMA flood zone
- —
- Chance of flooding over 30 yrs
- —
- Est. flood insurance / yr
- —
Fire risk No data
- Est. fire insurance / yr
- —
Heat risk No data
- Hot days now (above threshold)
- —
- Hot days in 30 yrs
- —
Wind risk No data
- Chance of severe wind over 30 yrs
- —
Air-quality risk No data
- Unhealthy air days now
- —
- Unhealthy air days in 30 yrs
- —
Risk factors via First Street. Map © Google.
Why this score? — see what drove the D- grade
The composite is a weighted blend of 9 inputs, each scored 0–100. Each bar is that input's sub-score; the figure is the points it added to the 100-point composite (weight × sub-score).
- Cash flow +11.8/30.0
- ARV discount +7.5/15.0
- DSCR +3.5/10.0
- 1% rule +3.4/10.0
- Schools +3.1/10.0
- Livability +2.9/5.0
- Rent growth +2.5/5.0
- Condition / age +2.5/5.0
- Appreciation +0.7/10.0
$141,990
🖨 Deal sheet (PDF) 📄 Offer letter ✓ Due diligence
Listing remarks
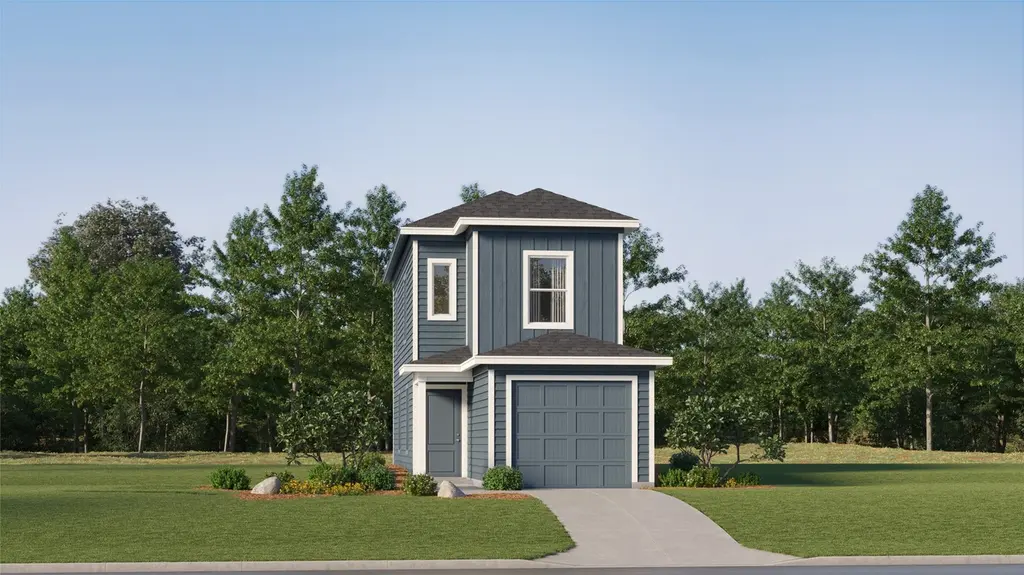
New Construction Lennar Houston Home - The Kofa Floor Plan - This new two-story home has a practical floorplan with a fully-equipped kitchen and inviting family room on the first floor. Two bedrooms can be found upstairs, including the restful owner’s suite, offering residents an en-suite bathroom and walk-in closet. The completion date, prices and features may vary and are subject to change. Please verify with Lennar directly. Photos are for illustrative purposes only.
Key facts
- Inviting family room
- Walk-in closet
- Kofa floor plan
Tags
Property features AI
Finance
- HOA & community: Community managed by KRJ Management, Inc.; Annual association fee of $2,300
Exterior
- Parking: Attached 2-car garage
- Utilities: Public water; Public sewer
- Home design: Residential property; Under construction (new construction); Slab foundation
- Construction: Cement siding; Composition roof; Built in 2026
- Exterior features: Back yard fence; Subdivision setting
Interior
- Kitchen: Dishwasher; Electric oven; Electric range; Gas oven; Gas range
- Bedrooms: 4 total rooms (beds/other rooms not individually specified)
- Flooring: Carpet; Vinyl
- Bathrooms: 2 full bathrooms; 1 half bathroom
- Heating & cooling: Central heating (electric and gas); Central air conditioning (electric and gas)
- Interior features: Breakfast bar; Kitchen/family room combo; Primary bedroom with private bath; Separate shower; Tub/shower combination
- Laundry & utility: Washer hookup; Electric dryer hookup; Gas dryer hookup
Neighborhood map
What this means for you Summary
Snapshot
- This is a 2-bed/2.5-bath land listed at $142k.
Deal economics
- At list price, monthly cash flow is $-57 ($-683/yr) — negative.
- The deal already cash-flows at list — no discount required.
- Meets the 1% rule at list price ($2k rent vs $142k).
- Recommended offer: $138k (3.0% below list) — sets the bar for market timing.
- Cap rate 6.0% vs local median 5.0% in Plum Grove — meaningfully above typical; check what's discounted (condition, days-on-market, listing class) to confirm the premium yield is real.
Location & tenants
- Location reads 58/100 on livability (#1,206 in TX) — a working-class tenant base; expect higher turnover. Strengths: crime A+, cost of living A+, housing A+; Watch: amenities F, commute F, health & safety F.
- Huffman ISD (rural): math 32% / reading 35% proficiency, ranked #500 of 826 in TX (top 60%) — families likely to look elsewhere, expect single-tenant / working-renter base with shorter leases.
- Zoned schools: Falcon Ridge El (math 30% / reading 35%, grade F, #2,234 of 4,322 statewide, top 52%, 689 students, 49% FRL); Huffman Middle (math 36% / reading 32%, grade F, #892 of 1,662 statewide, top 55%, 907 students, 42% FRL); Hargrave H S (math 31% / reading 46%, grade F, #866 of 1,632 statewide, top 54%, 1,125 students, 36% FRL).
- Market conditions: 585 active listings in the ZIP; 2 comparable units currently listed for rent nearby; solid renter incomes; 29,883 units permitted in Harris County in 2024 (8,621 in 5+ unit buildings).
Forward outlook
- Local home prices are declining (-3.0%/yr); year-one equity from $1k of loan paydown is wiped out by about $6k of value loss. Plan a longer hold.
- Harris County population projected at +47% by 2050 — long-run rental-demand tailwind backs the buy-and-hold thesis.
Negotiation context
- It's been on market 43 days — a 3% lower offer ($138k) is reasonable based on typical stale-listing flexibility.
Questions for the listing agent
- What do current leases actually rent for vs. the listed asking? Can we see a recent rent roll and the last 12 months of T-12 income?
- It's been on market 43 days. Have you received any prior offers? Is the seller open to a 3% concession, seller financing, or rate buy-down credit?
- What does the HOA fee cover, when was the last increase, and are there any pending special assessments or reserve-fund shortfalls?
- Is there a deadline driving the sale (1031 exchange, divorce, estate, relocation)? That informs how much negotiation room exists.
- Schools are F-rated, which usually means shorter tenancies and higher turnover. Who's the typical renter profile here, and what's been the actual vacancy rate?
- The area grade is low — what's the realistic commute time and amenity access for the typical tenant pool here? Any planned neighborhood developments (good or bad) we should know about?
- What's the average days-on-market for RENTAL listings here right now (not sales)? A rising rental-DOM trend means longer vacancies and softer asking-rent achievability than the comps imply.
- What's the recent tenant-quality profile in this submarket — average credit score on applications, eviction rate, late-payment / NSF rate, and stable-employment percentage? A property-management company in the area should have these aggregated.
- How much new for-sale + rental construction is in the pipeline within 1–3 miles? Heavy new supply typically softens prices + rents 12–24 months out; constrained supply supports both.
Investment metrics
- 1% rule
- 0.84% ✗
- Cap rate
- 5.97%
- Cash-on-cash
- -1.15%
- DSCR
- 0.95
- GRM
- 9.9
CMA / ARV
- ARV (median comp)
- $211,990
- List price
- $141,990
- Delta
- -33.02%
- Verdict
- UNDERPRICED
- Comps
- 20 within 1.0 mi
Projected returns pro-forma
-3.0% appreciation · 3.0% rent growth · sell at horizon
- IRR
- -18.2%
- Equity multiple
- 0.36×
- Total profit
- $-37,951
- Equity at exit
- $31,608
- IRR
- -10.4%
- Equity multiple
- 0.37×
- Total profit
- $-37,618
- Equity at exit
- $18,329
Cash invested: $59,357 (down + closing). Projections, not guarantees.
Landlord ↔ Tenant lean methodology
- Overall (STATE)
- 87 Strongly Landlord-Friendly
- State Texas
- 87 Strongly Landlord-Friendly · R+5
- County
- — inherits STATE
- City
- — inherits STATE
ZIP-level market 77336
- Home prices YoY
- -1.8%
- Active inventory
- 585
- Price-to-rent
- 6.7×
Monthly cashflow live
- Estimated rent
- $1,775 medium interval (Pro) →
- Mortgage (P&I)
- −$1,112
- Tax from tax record
- −$67 /mo · $810/yr
- Insurance
- −$88
- HOA
- −$192
- Vacancy / Maint / Mgmt
- −$373
- Net cashflow
- $-57
Break-even live
Sensitivity live
| Price | -10% $63 | -5% $3 | +0% $-57 | +5% $-117 | +10% $-177 |
|---|---|---|---|---|---|
| Rent | -10% $-197 | -5% $-127 | +0% $-57 | +5% $13 | +10% $83 |
| Rate | -1.0pp $50 | -0.5pp $-3 | base $-57 | +0.5pp $-112 | +1.0pp $-168 |
UW: 25.0% down · 7.5% · 30yr · 1.5% tax · 5.0% vac · 8.0% maint · 8.0% mgmt
Financing live
Cash to close
- Down payment
- $52,998
- Closing costs
- $6,360
- Reserves months
- —
- Total cash needed
- —
Loan-product check · same deal, 3 products live
Conventional
25% down · 7.5% · 30yr
- Down + closing
- —
- Monthly P&I
- —
- Monthly cashflow
- —
- DSCR
- —
- Eligible?
- —
Personal DTI + credit; lowest rate.
DSCR
20% down · 8.5% · 30yr
- Down + closing
- —
- Monthly P&I
- —
- Monthly cashflow
- —
- DSCR
- —
- Eligible?
- —
No personal income docs; deal must DSCR.
Hard money
10% down · 12.0% · 12mo
- Down + closing
- —
- Monthly P&I
- —
- Monthly cashflow
- —
- DSCR
- —
- Eligible?
- —
Short-term bridge; refi at stabilization.
Rent comps 2 comps
| Address | Beds | Baths | Sqft | Rent | $/sqft | DOM | Units | Dist |
|---|---|---|---|---|---|---|---|---|
| 934 Pertuso Ln Huffman, TX | 3.0 | 2.0 | 1360 | $1,800 | $1.32 | 24d | 1 | 0.02mi |
| 31416 Pratola Serra Cir Huffman, TX | 3.0 | 2.0 | 1461 | $1,675 | $1.15 | 2d | 1 | 0.17mi |
HOA detail
- Monthly dues
- $192 · $2,304/yr
Listing history 15 events
-
2026-06-18days on market $141,990 Active 43 DOM
-
2026-06-17remarks 474-char remark
-
2026-06-17days on market $141,990 Active 42 DOM
-
2026-06-16days on market $141,990 Active 41 DOM
-
2026-06-15days on market $141,990 Active 40 DOM
-
2026-06-13days on market $141,990 Active 38 DOM
-
2026-06-09days on market $141,990 Active 34 DOM
-
2026-06-08days on market $141,990 Active 33 DOM
-
2026-06-07days on market $141,990 Active 32 DOM
-
2026-06-04days on market $141,990 Active 29 DOM
-
2026-06-03days on market $141,990 Active 28 DOM
-
2026-06-02days on market $141,990 Active 27 DOM
-
2026-06-01days on market $141,990 Active 26 DOM
-
2026-05-31days on market $141,990 Active 25 DOM
-
2026-05-06$141,990 Active 441-char remark
ⓘ Source: listings_history table (triggers on properties + properties_extension) + one-shot
backfill from property_details.listing_events for pre-trigger history.
Tax reassessment forecast TX · Resets to sale price
- Current annual tax
- $810 · $67/mo
- Projected year-2 tax
- $2,598 · $217/mo
- Expected delta
- +$1,788/yr (+$149/mo · 220.8%)
ⓘ Screening estimate from a state-policy table — verify with the county assessor before closing.
Nearby sold comps map
Loading sold comps map…
Walkable amenities ~0.75 mi
Loading nearby amenities…
Taxation est. · year 1
- Rental income
- $21,306
- − Mortgage interest
- −$11,875
- − Property taxes
- −$810
- − Insurance
- −$1,060
- − Repairs & maintenance
- −$1,704
- − Management
- −$1,704
- − HOA
- −$2,304
- − Depreciation
- −$6,167
- Taxable loss
- −$4,319
- Est. tax savings @ 24.0%
- +$1,036
- After-tax cash flow
- $354/yr
For passive investors: Depreciation is non-cash, so a rental often shows a tax loss while cash-flowing — sheltering income. Rental losses are passive: they offset passive income freely, and up to $25,000/yr can offset ordinary (W-2) income if you actively participate and your MAGI is under $100k (phasing out to $0 by $150k); unused losses carry forward. On sale, claimed depreciation is recaptured at up to 25%, and gains may owe capital-gains tax (a 1031 exchange can defer both). Figures are a year-1 estimate at your 24.0% rate — not tax advice; consult a CPA.
Schools (NCES district)
- District
- Huffman ISD
- NCES district ID
- 4823820
- Math proficiency
- 32% ▼ -9.00%
- Reading proficiency
- 35% ▼ -9.00%
- Median HH income
- $65,848
- Composite
- 30.61/100
- National rank
- #6195
- State rank
- #500 of 826 in TX
Livability — Plum Grove
- Score
- 58/100
- State rank
- #1206
- US rank
- #21049
Category grades
Schools grade is shown separately in the Schools card above.
Census & demographics
- County
- Harris County · 4,702,590 people
- Metro
- Houston-The Woodlands-Sugar Land, TX
- Population (ZIP)
- 14,342
- Household income
- $96,404
- Rent vs Own
- Severe rent burden
- 377.0
Population outlook (Harris County) Hauer SSP2
- Today (2025)
- 5,571,493 people
- By 2030
- 6,089,821 · +9.3%
- By 2040
- 7,142,806 · +28.2%
- By 2050
- 8,185,864 · +46.9%
- By 2075
- 10,574,329 · +89.8%
- By 2100
- 12,109,958 · +117.4%
Race, ethnicity, and origin ACS 2023
- Neighborhood character
- Majority White (65%)
- Race & ethnicity
- White 65% Hispanic / Latino 23% Two or more races 9% Black 5% Native American 4%
- Hispanic origin (detail)
- Mexican 20%
- Common ancestry
- Lithuanian 4% Slovak 2% Romanian 2%
- Foreign-born
- 9% · Canada
- Languages at home
- 79% English-only · Spanish 18% Other Indo-European 2%
Political lean MEDSL · Harris
- 2024 margin
- Lean D (+5.5) · D 52.0% · R 46.4% · Other 1.6%
- 2008→2024 swing
- +3.9pp toward D · 2008: 1.6pp · 2024: 5.5pp
- All cycles
- 2024: D+5.5 2020: D+13.3 2016: D+12.4 2012: D+0.1 2008: D+1.6
Not yet ingested
- Civics
- —
Market trends
- HPI YoY
- ▼ -8.59%
- Current HPI
- 472.03
- Rent YoY
- —
- Metro
- Houston-The Woodlands-Sugar Land, TX
- State GDP YoY
- ▲ 3.95%
- F500 in state
- 110
Industry mix (Fortune 500 HQ in TX)
| Industry | F500 HQs | Revenue |
|---|---|---|
| Energy | 16 | $1,198B |
|
||
| Technology | 5 | $198B |
|
||
| Engineering / Construction | 4 | $72B |
|
||
| Energy Services | 3 | $60B |
|
||
| Utilities | 3 | $41B |
|
||
| Healthcare | 2 | $330B |
|
||
Price history
1 event — show timeline
- 2026-05-06 Listed $141,990 HARMLS
Cash-flow waterfall
monthlySold comps — $/sqft
last 12 mo · ≤1 miLoading sold comps…