 🌊 Lakefront
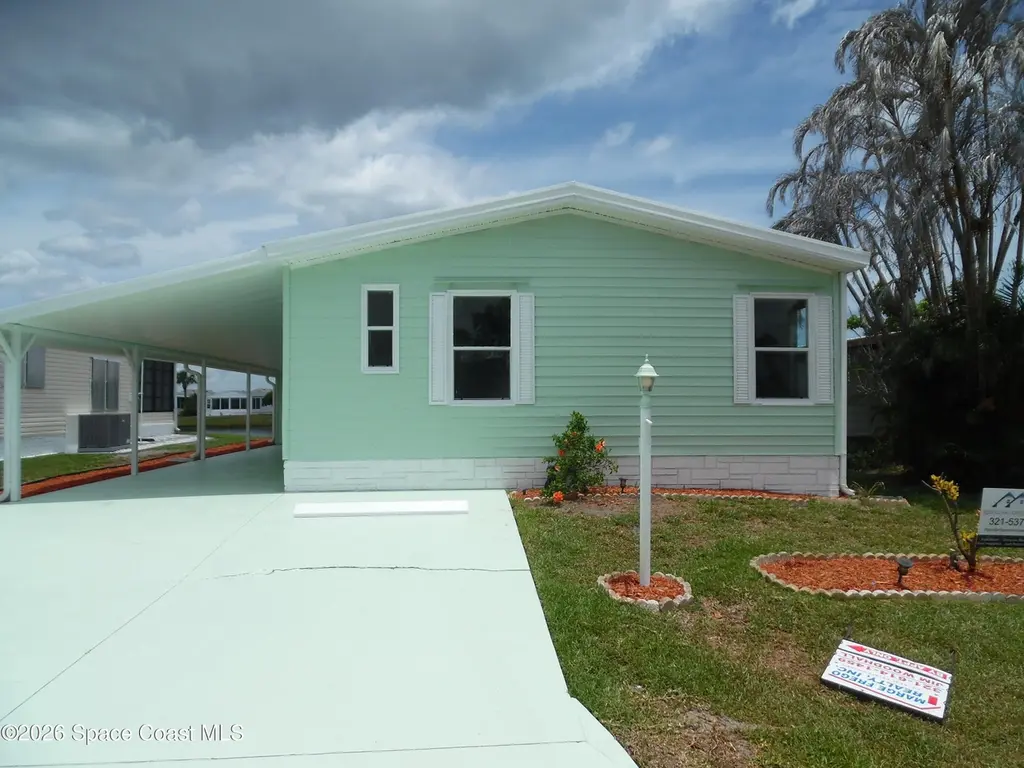
1040 E Dracena Dr E Unit P28 · Micco, FL
Flood risk 1/10 · Minimal
- FEMA flood zone
- A
- Chance of flooding over 30 yrs
- 0.0%
- Est. flood insurance / yr
- $1,009 – $1,996
Fire risk 5/10 · Moderate
- Est. fire insurance / yr
- $947 – $1,759
Heat risk 10/10 · Severe
- Hot days now (above 105°F)
- 7 days/yr
- Hot days in 30 yrs
- 24 days/yr
Wind risk 10/10 · Severe
- Chance of severe wind over 30 yrs
- 99.0%
Air-quality risk 1/10 · Minimal
- Unhealthy air days now
- 0 days/yr
- Unhealthy air days in 30 yrs
- 0 days/yr
Risk factors via First Street. Map © Google.
Why this score? — see what drove the C- grade
The composite is a weighted blend of 9 inputs, each scored 0–100. Each bar is that input's sub-score; the figure is the points it added to the 100-point composite (weight × sub-score).
- Cash flow +21.7/30.0
- ARV discount +7.5/15.0
- DSCR +6.9/10.0
- 1% rule +5.3/10.0
- Schools +4.7/10.0
- Livability +3.2/5.0
- Rent growth +2.5/5.0
- Condition / age +2.5/5.0
- Appreciation +0.0/10.0
$172,500
🖨 Deal sheet 📄 Offer letter ✓ Due diligence
Listing remarks MLS
Furnished Waterfront Home in 55+ Snug Harbor Lakes with Double Drive Home is located across from th3e Community Center. Everything you would want from Linens to Storm to Sprinkler System and More. Home is being Sold AS-IS with the right of Inpections
Key facts
- Lake views
- Direct lake frontage
- Double wide driveway
Tags
Property features AI
Finance
- Other: Unfurnished unit; Senior community
- HOA & community: Community association (Snug Harbor Lakes Association); Association fee $75 monthly; Association maintains grounds and trash; Community amenities include clubhouse, fitness center, basketball court, tennis courts, racquetball, shuffleboard, park, storage, full-time management
Exterior
- Parking: Attached parking; Attached carport; Carport with 3 spaces; Off-street parking; Has attached garage
- Utilities: 150 amp electric service (underground); Public sewer; Cable available; Electricity connected; Sewer connected; Water connected
- Home design: Manufactured home; One level; Faces west
- Construction: Frame construction; Vinyl siding
- Exterior features: Covered, screened rear porch; Porch; Tennis court(s); Other exterior amenities; Shed(s); Workshop; Few trees on lot
Interior
- Kitchen: Dishwasher; Disposal; Electric oven; Electric range; Refrigerator
- Bedrooms: 2 bedrooms
- Flooring: Laminate flooring; Vinyl flooring
- Bathrooms: 2 full bathrooms
- Heating & cooling: Central heating (electric); Central air (electric)
- Interior features: Breakfast nook; Pantry; Primary bathroom with tub and separate shower; Walk-in closet(s)
- Laundry & utility: In-unit laundry with washer and dryer hookups; Electric dryer hookup; Utility sink
Neighborhood map
What this means for you Summary
Snapshot
- This is a 2-bed/2.0-bath manufactured listed at $172k.
Deal economics
- At list price, monthly cash flow is $141 ($2k/yr) — positive.
- The deal already cash-flows at list — no discount required.
- Meets the 1% rule at list price ($2k rent vs $172k).
- Recommended offer: $170k (1.5% below list) — sets the bar for market timing.
Location & tenants
- Location reads 65/100 on livability (#633 in FL) — a middle-class / working-renter tenant base. Strengths: cost of living A+, housing A+; Watch: employment D, amenities F, commute F.
- Brevard (suburban): math 53% / reading 57% proficiency, ranked #19 of 73 in FL (top 26%) — acceptable for families but not a draw, mixed tenant base, ~2y average lease.
- Zoned schools: Sunrise Elementary School (math 52% / reading 57%, grade C, #892 of 2,144 statewide, top 44%, 759 students, 58% FRL); Southwest Middle School (math 40% / reading 39%, grade F, #373 of 571 statewide, top 66%, 920 students, 58% FRL); Bayside High School (math 27% / reading 40%, grade F, #400 of 667 statewide, top 61%, 1,854 students, 51% FRL).
- Zoned-school proficiency averages 42% at this address vs 55% district-wide (-12 pts) — the specific schools serving this property underperform the Brevard average; the district grade overstates school quality for this exact location.
- Market conditions: 185 active listings in the ZIP; 16 comparable units currently listed for rent nearby; rentals at typical pace (median 24d on market — plan ~3-4 weeks tenant-placement turnaround); 4,602 units permitted in Brevard County in 2024 (702 in 5+ unit buildings).
Forward outlook
- Local home prices are declining (-3.0%/yr); year-one equity from $1k of loan paydown is wiped out by about $5k of value loss. Plan a longer hold.
- Brevard County population projected at +15% by 2050 — modest demand growth; plan on rents tracking national, not racing it.
Negotiation context
- It's been on market 18 days — a 2% lower offer ($170k) is reasonable based on typical stale-listing flexibility.
- Current owner paid $76k; list at $172k implies a 127% gain — meaningful room to come down on a strong offer.
Risks & watch-outs
- Watch-outs: flood insurance adds $125/mo.
- Climate carrying-cost: in FEMA flood zone A (mandatory federal flood insurance); severe wind risk, 99% chance of damaging wind over 30y; moderate wildfire risk; extreme-heat days projected 7→24/yr by 2055 (HVAC capex compounding) — expect insurance premiums to compound above CPI over the hold.
Questions for the listing agent
- What's the actual annual flood-insurance premium (NFIP or private), and is the property in a SFHA with mandatory coverage?
- What does the HOA fee cover, when was the last increase, and are there any pending special assessments or reserve-fund shortfalls?
- Is there a deadline driving the sale (1031 exchange, divorce, estate, relocation)? That informs how much negotiation room exists.
- Schools are F-rated, which usually means shorter tenancies and higher turnover. Who's the typical renter profile here, and what's been the actual vacancy rate?
- This sits on a lake — are riparian / water-frontage rights deeded with the parcel? Any dock permits, shoreline easements, or HOA water-use restrictions?
- What's the documented flood / surge / shoreline-erosion history here (FEMA AND non-FEMA — e.g., storm surge, creek backup, septic-field saturation)?
- Any water-quality or seasonal algae-bloom issues that affect tenant satisfaction or short-term-rental demand?
- What's the average days-on-market for RENTAL listings here right now (not sales)? A rising rental-DOM trend means longer vacancies and softer asking-rent achievability than the comps imply.
- What's the recent tenant-quality profile in this submarket — average credit score on applications, eviction rate, late-payment / NSF rate, and stable-employment percentage? A property-management company in the area should have these aggregated.
- How much new for-sale + rental construction is in the pipeline within 1–3 miles? Heavy new supply typically softens prices + rents 12–24 months out; constrained supply supports both.
Investment metrics
- 1% rule
- 1.03% ✓
- Cap rate
- 8.15%
- Cash-on-cash
- 6.62%
- DSCR
- 1.29
- GRM
- 8.1
CMA / ARV
No comps found within radius.
Projected returns pro-forma
-3.0% appreciation · 3.0% rent growth · sell at horizon
- IRR
- -10.7%
- Equity multiple
- 0.61×
- Total profit
- $-18,884
- Equity at exit
- $25,720
- IRR
- -1.4%
- Equity multiple
- 0.91×
- Total profit
- $-4,575
- Equity at exit
- $14,915
Cash invested: $48,300 (down + closing). Projections, not guarantees.
Landlord ↔ Tenant lean methodology
- Overall (STATE)
- 87 Strongly Landlord-Friendly
- State Florida
- 87 Strongly Landlord-Friendly · R+3
- County
- — inherits STATE
- City
- — inherits STATE
ZIP-level market 32976
- Home prices YoY
- -18.6%
- Active inventory
- 185
- Price-to-rent
- 8.1×
Monthly cashflow live
- Estimated rent
- $1,776 high interval (Pro) →
- Mortgage (P&I)
- −$905
- Tax from tax record
- −$85 /mo · $1,018/yr
- Insurance
- −$72
- Flood insurance flood zone
- −$125 /mo · $1,502/yr
- HOA
- −$75
- Vacancy / Maint / Mgmt
- −$373
- Net cashflow
- $141
Break-even live
UW: 25.0% down · 7.5% · 30yr · 1.5% tax · 5.0% vac · 8.0% maint · 8.0% mgmt
Financing live
Cash to close
- Down payment
- $43,125
- Closing costs
- $5,175
- Reserves months
- —
- Total cash needed
- —
Loan-product check · same deal, 3 products live
Conventional
25% down · 7.5% · 30yr
- Down + closing
- —
- Monthly P&I
- —
- Monthly cashflow
- —
- DSCR
- —
- Eligible?
- —
Personal DTI + credit; lowest rate.
DSCR
20% down · 8.5% · 30yr
- Down + closing
- —
- Monthly P&I
- —
- Monthly cashflow
- —
- DSCR
- —
- Eligible?
- —
No personal income docs; deal must DSCR.
Hard money
10% down · 12.0% · 12mo
- Down + closing
- —
- Monthly P&I
- —
- Monthly cashflow
- —
- DSCR
- —
- Eligible?
- —
Short-term bridge; refi at stabilization.
Rent comps 16 comps
| Address | Beds | Baths | Sqft | Rent | $/sqft | DOM | Units | Dist |
|---|---|---|---|---|---|---|---|---|
| 7629 Chasta Rd Sebastian, FL | 2.0 | 2.0 | 958 | $1,600 | $1.67 | 23d | 1 | 0.24mi |
| 7606 Cedar Bark Rd Sebastian, FL | 2.0 | 2.0 | 1273 | $1,800 | $1.41 | 23d | 1 | 0.26mi |
| 7597 Cedar Bark Rd Sebastian, FL | 2.0 | 2.0 | 902 | $1,700 | $1.88 | 23d | 1 | 0.27mi |
| 621 Hyacinth Cir Sebastian, FL | 2.0 | 2.0 | 1324 | $1,850 | $1.40 | 23d | 1 | 0.35mi |
| 415 Plover Dr Sebastian, FL | 3.0 | 2.0 | 1200 | $2,400 | $2.00 | 23d | 1 | 0.42mi |
| 706 Hyacinth Cir Sebastian, FL | 2.0 | 2.0 | 1062 | $1,750 | $1.65 | 23d | 1 | 0.43mi |
| 909 Sequoia St Sebastian, FL | 2.0 | 2.0 | 1156 | $1,845 | $1.60 | 23d | 1 | 0.44mi |
| 904 Red Bud Rd Sebastian, FL | 3.0 | 2.0 | 1278 | $1,500 | $1.17 | 23d | 1 | 0.51mi |
| 1207 Marigold Dr Sebastian, FL | 2.0 | 2.0 | 1104 | $1,500 | $1.36 | 23d | 1 | 0.75mi |
| 914 Pecan Cir Sebastian, FL | 2.0 | 1.0 | 1000 | $1,600 | $1.60 | 23d | 1 | 0.76mi |
| 629 W Marlin Cir Unit NA Sebastian, FL | 2.0 | 2.0 | 1104 | $1,400 | $1.27 | 14d | 1 | 0.77mi |
| 702 Lark Dr Sebastian, FL | 3.0 | 2.0 | 1296 | $1,775 | $1.37 | 23d | 1 | 0.96mi |
| 830 Lychee Dr Sebastian, FL | 2.0 | 2.0 | 1269 | $2,000 | $1.58 | 23d | 1 | 1.13mi |
| 1112 Pocatella Dr Sebastian, FL | 2.0 | 2.0 | 1370 | $1,900 | $1.39 | 23d | 1 | 1.15mi |
| 1315 Barefoot Cir Sebastian, FL | 2.0 | 2.0 | 1167 | $2,300 | $1.97 | 23d | 1 | 1.22mi |
| 8520 US Highway 1 #10 Sebastian, FL | 2.0 | 2.0 | 1091 | $1,800 | $1.65 | 23d | 1 | 1.47mi |
HOA detail
- Monthly dues
- $75 · $900/yr
- Likely covers
- water
Listing history 13 events
-
2026-06-18days on market $172,500 Active 18 DOM
-
2026-06-17days on market $172,500 Active 17 DOM
-
2026-06-16days on market $172,500 Active 16 DOM
-
2026-06-15days on market $172,500 Active 15 DOM
-
2026-06-14days on market $172,500 Active 13 DOM
-
2026-06-10days on market $172,500 Active 10 DOM
-
2026-06-08days on market $172,500 Active 8 DOM
-
2026-06-07days on market $172,500 Active 7 DOM
-
2026-06-05days on market $172,500 Active 4 DOM
-
2026-06-03days on market $172,500 Active 3 DOM
-
2026-06-02days on market $172,500 Active 2 DOM
-
2026-06-01remarks 695-char remark
-
2026-06-01$172,500 Active 1 DOM
ⓘ Source: listings_history table (triggers on properties + properties_extension) + one-shot
backfill from property_details.listing_events for pre-trigger history.
Tax reassessment forecast FL · Resets to sale price
- Current annual tax
- $1,018 · $85/mo
- Projected year-2 tax
- $1,432 · $119/mo
- Expected delta
- +$414/yr (+$34/mo · 40.7%)
ⓘ Screening estimate from a state-policy table — verify with the county assessor before closing.
Climate risk First Street
- Flood 1/10 Low FEMA zone A · 0% chance over 30 yrs
- Wildfire 5/10 Major
- Heat 10/10 Extreme 7 d/yr ≥105°F today · 24 d/yr by 30 yrs out
- Wind 10/10 Extreme 99% chance of damaging wind over 30 yrs
- Air quality 1/10 Low 0 unhealthy d/yr today · 0 by 30 yrs out
Nearby sold comps map
Loading sold comps map…
Walkable amenities ~0.75 mi
Loading nearby amenities…
Taxation est. · year 1
- Rental income
- $21,308
- − Mortgage interest
- −$9,663
- − Property taxes
- −$1,018
- − Insurance
- −$2,365
- − Repairs & maintenance
- −$1,705
- − Management
- −$1,705
- − HOA
- −$900
- − Depreciation
- −$5,018
- Taxable loss
- −$1,065
- Est. tax savings @ 24.0%
- +$256
- After-tax cash flow
- $1,951/yr
For passive investors: Depreciation is non-cash, so a rental often shows a tax loss while cash-flowing — sheltering income. Rental losses are passive: they offset passive income freely, and up to $25,000/yr can offset ordinary (W-2) income if you actively participate and your MAGI is under $100k (phasing out to $0 by $150k); unused losses carry forward. On sale, claimed depreciation is recaptured at up to 25%, and gains may owe capital-gains tax (a 1031 exchange can defer both). Figures are a year-1 estimate at your 24.0% rate — not tax advice; consult a CPA.
Schools (NCES district)
- District
- Brevard
- NCES district ID
- 1200150
- Math proficiency
- 53% ▼ -9.00%
- Reading proficiency
- 57% ▼ -4.00%
- Median HH income
- $49,426
- Composite
- 46.86/100
- National rank
- #2370
- State rank
- #19 of 73 in FL
Livability — Micco
- Score
- 65/100
- State rank
- #633
- US rank
- #12408
Category grades
Schools grade is shown separately in the Schools card above.
Census & demographics
- Census place
- Micco, FL
- Population (ZIP)
- 9,237
Population outlook (Brevard County) Hauer SSP2
- Today (2025)
- 623,254 people
- By 2030
- 648,420 · +4.0%
- By 2040
- 690,009 · +10.7%
- By 2050
- 715,669 · +14.8%
- By 2075
- 775,744 · +24.5%
- By 2100
- 776,687 · +24.6%
Race, ethnicity, and origin ACS 2023
- Neighborhood character
- Predominantly White (93%)
- Race & ethnicity
- White 93% Hispanic / Latino 4% Two or more races 1% Asian 1%
- Common ancestry
- Lithuanian 5% Romanian 4% Iranian 2%
- Foreign-born
- 4% · Canada, Jamaica
- Languages at home
- 95% English-only · Spanish 3%
Political lean MEDSL · Brevard
- 2024 margin
- Strong R (+20.8) · D 39.1% · R 59.9% · Other 1.0%
- 2008→2024 swing
- -10.4pp toward R · 2008: -10.4pp · 2024: -20.8pp
- All cycles
- 2024: R+20.8 2020: R+16.4 2016: R+19.8 2012: R+12.7 2008: R+10.4
Not yet ingested
- Civics
- —
Market trends
- HPI YoY
- ▼ -73.57%
- Current HPI
- 321.5196
- Rent YoY
- —
- Metro
- —
- State GDP YoY
- ▲ 3.28%
- F500 in state
- 36
Industry mix (Fortune 500 HQ in FL)
| Industry | F500 HQs | Revenue |
|---|---|---|
| Industrial Technology | 2 | $29B |
|
||
| Insurance | 2 | $17B |
|
||
| Retail | 1 | $60B |
|
||
| Technology Distribution | 1 | $58B |
|
||
| Homebuilding | 1 | $35B |
|
||
| Technology Manufacturing | 1 | $35B |
|
||
Price history
-87.3% since first listed4 events — show timeline
- 2026-06-01 Listed $172,500 SCMLS
- 2016-05-25 Sold (Public Records) $76,000 Public Records
- 2016-05-24 Sold (MLS) $76,000 RAIRCMLS
- 1988-02-01 Sold (Public Records) $1,356,000 Public Records
Property tax history
+4.3%/yrLatest (2025): $1,018 · +7.8% YoY. Source: county tax records.
Cash-flow waterfall
monthlySold comps — $/sqft
last 12 mo · ≤1 miLoading sold comps…