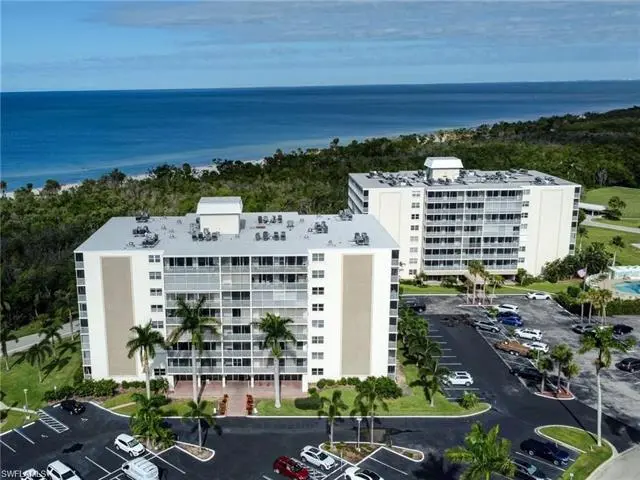
3 Bluebill Ave #410 · Naples Park, FL
Flood risk 9/10 · Severe
- FEMA flood zone
- AE
- Chance of flooding over 30 yrs
- 0.99%
- Est. flood insurance / yr
- $1,737 – $8,500
Fire risk 1/10 · Minimal
- Est. fire insurance / yr
- $947 – $1,759
Heat risk 10/10 · Severe
- Hot days now (above 107°F)
- 7 days/yr
- Hot days in 30 yrs
- 30 days/yr
Wind risk 10/10 · Severe
- Chance of severe wind over 30 yrs
- 99.0%
Air-quality risk 2/10 · Minimal
- Unhealthy air days now
- 1 days/yr
- Unhealthy air days in 30 yrs
- 1 days/yr
Risk factors via First Street. Map © Google.
Why this score? — see what drove the C- grade
The composite is a weighted blend of 9 inputs, each scored 0–100. Each bar is that input's sub-score; the figure is the points it added to the 100-point composite (weight × sub-score).
- Cash flow +16.9/30.0
- ARV discount +7.5/15.0
- 1% rule +7.0/10.0
- DSCR +5.3/10.0
- Schools +5.0/10.0
- Rent growth +4.7/5.0
- Livability +3.2/5.0
- Condition / age +2.5/5.0
- Appreciation +0.0/10.0
$350,000
🖨 Deal sheet (PDF) 📄 Offer letter ✓ Due diligence
Listing remarks MLS
The BEST VIEWS in the BEST BUIDLING on the beach !!! AWESOME INVESTMENT - it brings $21,000! in rental income per year !!! WELL KEPT!! Beach, Boating, Sun & Fun! Much desired EASTERN exposure - the BEST light ! THE LOWEST HOA fees at the Beach !!!!! Nice, bright, turnkey furnished. .. .PREFFERED 4th floor condo that's literally steps to Vanderbilt and Wiggins Pass Beaches. Oh, did I forget to mention UNOBSTRUCTED Marina VIEWS !!! Watch the boats pass buy all day on their way to the Gulf ! TOP RATED Wiggins Pass and Vanderbilt beaches in your backyard !!! Just minutes away from shopping, dining & entertainment - MERCATO, Waterside Shops, Capital Grille, Flemings etc over 700 restaurants!. .. ARTIS - Philharmonic, etc etc - EVERYTHING you came for to Naples !! BOAT DOCKS for lease ! WELL maintained building! FANTASTIC management. .. .it is a well know fact in the area that this is THE building you want to be in at the BEACH ! GREAT building - VERY HAPPY residents ! THE LOWEST HOA fees at the Beach !!!!! GLORIOUS SUNSETS. .. .. this SHOELESS venture awaits YOU !!!
Key facts
- Private balcony
- Natural light
- Open living space
Tags
Property features AI
Finance
- HOA & community: Mandatory HOA; Quarterly master HOA fee of $2,791 (total annual recurring fees $11,164); Condo management; HOA maintenance covers cable, insurance, internet/Wi-Fi, laundry facilities, lawn/land maintenance, legal/accounting, manager, exterior pest control, repairs, reserve, security, sewer, street lights, street maintenance, trash removal and water; Community amenities include common laundry, community boat dock, internet access and a library
Exterior
- Parking: Community boat dock (per HOA amenities)
- Security: Gated community; Security included in HOA maintenance
- Utilities: Water assessment paid; Sewer assessment paid; Cable available
- Home design: High-rise building (8+ stories); Residential condominium in Vanderbilt Towers; Rear exposure facing southwest; Unit 410
- Construction: Concrete block construction; Built in 1972; Built-up or flat roof
- Exterior features: Stucco exterior; Double-hung and sliding windows; Bay and water views; Has waterfront (bay); Dock lease for boat access; Gulf access with no bridges
Interior
- Kitchen: Electric cooktop; Dishwasher; Microwave; Refrigerator/Freezer
- Bedrooms: 1 bedroom
- Flooring: Tile
- Bathrooms: 1 full bathroom; No master bath
- Heating & cooling: Central electric heat; Central electric cooling
- Interior features: Furnished; See remarks for additional interior details; Common elevator
- Laundry & utility: Community laundry facilities (per HOA maintenance list)
Neighborhood map
What this means for you Summary
Snapshot
- This is a 1-bed/1.0-bath condo listed at $350k.
Deal economics
- At list price, monthly cash flow is $-196 ($-2k/yr) — negative.
- To cash-flow at today's rent, offer at most $315k (9.9% below list).
- Meets the 1% rule at list price ($4k rent vs $350k).
- Recommended offer: $315k (9.9% below list) — sets the bar for cash-flow.
Location & tenants
- Location reads 64/100 on livability (#696 in FL) — a middle-class / working-renter tenant base. Strengths: crime A+, housing A-, employment B+; Watch: health & safety D, amenities F, commute F.
- Collier (suburban): math 60% / reading 56% proficiency, ranked #16 of 73 in FL (top 22%) — acceptable for families but not a draw, mixed tenant base, ~2y average lease.
- Zoned schools: Naples Park Elementary School (math 67% / reading 57%, grade B, #608 of 2,144 statewide, top 29%, 395 students, 48% FRL); North Naples Middle School (math 79% / reading 73%, grade A, #34 of 571 statewide, top 6%, 903 students, 25% FRL); Gulf Coast High School (math 57% / reading 68%, grade B-, #93 of 667 statewide, top 14%, 2,447 students, 20% FRL) — zoned schools average 31% FRL vs 55% district-wide (24 pts lower); this property's tenant base skews higher-income than the district average.
- Market conditions: Rents rising fast (+8.7%/yr); 684 active listings in the ZIP; 40 comparable units currently listed for rent nearby; rentals at typical pace (median 25d on market — plan ~3-4 weeks tenant-placement turnaround); high-income renter base; 3,520 units permitted in Collier County in 2024 (959 in 5+ unit buildings).
- This rent runs 42% of the median local income ($119k/yr) — at the standard rent-burdened threshold; future hikes will face affordability resistance.
Forward outlook
- Local home prices are declining (-3.0%/yr); year-one equity from $2k of loan paydown is wiped out by about $10k of value loss. Plan a longer hold.
- Collier County population projected at +30% by 2050 — long-run rental-demand tailwind backs the buy-and-hold thesis.
Negotiation context
- It's been on market 19 days — a 2% lower offer ($345k) is reasonable based on typical stale-listing flexibility.
- 5 sale attempts since 13y ago with the ask held roughly flat each time — persistent listings suggest the price (not the market) is what's stuck; bring a comps-based counter.
Risks & watch-outs
- Watch-outs: flood insurance adds $427/mo; HOA is 22% of rent.
- Climate carrying-cost: in FEMA flood zone AE (mandatory federal flood insurance); severe wind risk, 99% chance of damaging wind over 30y; extreme-heat days projected 7→30/yr by 2055 (HVAC capex compounding) — expect insurance premiums to compound above CPI over the hold.
Questions for the listing agent
- What do current leases actually rent for vs. the listed asking? Can we see a recent rent roll and the last 12 months of T-12 income?
- Built in 1972 — when were the roof, HVAC, electrical panel, plumbing, and water heater last replaced?
- What's the actual annual flood-insurance premium (NFIP or private), and is the property in a SFHA with mandatory coverage?
- What does the HOA fee cover, when was the last increase, and are there any pending special assessments or reserve-fund shortfalls?
- Any open or pending special assessments — roof, HVAC, plumbing, elevator, façade? What's the per-unit balance and payoff schedule, and is the seller paying it off at close or rolling it to the buyer?
- Is there a deadline driving the sale (1031 exchange, divorce, estate, relocation)? That informs how much negotiation room exists.
- Schools are F-rated, which usually means shorter tenancies and higher turnover. Who's the typical renter profile here, and what's been the actual vacancy rate?
- What's the average days-on-market for RENTAL listings here right now (not sales)? A rising rental-DOM trend means longer vacancies and softer asking-rent achievability than the comps imply.
- What's the recent tenant-quality profile in this submarket — average credit score on applications, eviction rate, late-payment / NSF rate, and stable-employment percentage? A property-management company in the area should have these aggregated.
- How much new apartment / multifamily construction is in the pipeline within 1–3 miles? Heavy new supply (>2% of stock underway) typically softens rents 12–24 months out; light construction supports rent growth.
Investment metrics
- 1% rule
- 1.20% ✓
- Cap rate
- 7.08%
- Cash-on-cash
- 2.82%
- DSCR
- 1.13
- GRM
- 7.0
CMA / ARV
No comps found within radius.
Projected returns pro-forma
-3.0% appreciation · 8.0% rent growth · sell at horizon
- IRR
- -12.2%
- Equity multiple
- 0.53×
- Total profit
- $-46,329
- Equity at exit
- $52,186
- IRR
- 5.0%
- Equity multiple
- 1.48×
- Total profit
- $47,364
- Equity at exit
- $30,262
Cash invested: $98,000 (down + closing). Projections, not guarantees.
Landlord ↔ Tenant lean methodology
- Overall (STATE)
- 87 Strongly Landlord-Friendly
- State Florida
- 87 Strongly Landlord-Friendly · R+3
- County
- — inherits STATE
- City
- — inherits STATE
ZIP-level market 34108
- Rents YoY
- 8.7%
- Active inventory
- 684
- Price-to-rent
- 7.0×
Monthly cashflow live
- Estimated rent
- $4,192 medium interval (Pro) →
- Mortgage (P&I)
- −$1,835
- Tax from tax record
- −$170 /mo · $2,039/yr
- Insurance
- −$146
- Flood insurance flood zone
- −$427 /mo · $5,118/yr
- HOA
- −$930
- Vacancy / Maint / Mgmt
- −$880
- Net cashflow
- $-196
Break-even live
Sensitivity live
| Price | -10% $2 | -5% $-97 | +0% $-196 | +5% $-295 | +10% $-394 |
|---|---|---|---|---|---|
| Rent | -10% $-527 | -5% $-362 | +0% $-196 | +5% $-31 | +10% $135 |
| Rate | -1.0pp $-20 | -0.5pp $-107 | base $-196 | +0.5pp $-287 | +1.0pp $-379 |
UW: 25.0% down · 7.5% · 30yr · 1.5% tax · 5.0% vac · 8.0% maint · 8.0% mgmt
Financing live
Cash to close
- Down payment
- $87,500
- Closing costs
- $10,500
- Reserves months
- —
- Total cash needed
- —
Loan-product check · same deal, 3 products live
Conventional
25% down · 7.5% · 30yr
- Down + closing
- —
- Monthly P&I
- —
- Monthly cashflow
- —
- DSCR
- —
- Eligible?
- —
Personal DTI + credit; lowest rate.
DSCR
20% down · 8.5% · 30yr
- Down + closing
- —
- Monthly P&I
- —
- Monthly cashflow
- —
- DSCR
- —
- Eligible?
- —
No personal income docs; deal must DSCR.
Hard money
10% down · 12.0% · 12mo
- Down + closing
- —
- Monthly P&I
- —
- Monthly cashflow
- —
- DSCR
- —
- Eligible?
- —
Short-term bridge; refi at stabilization.
Rent comps 40 comps
| Address | Beds | Baths | Sqft | Rent | $/sqft | DOM | Units | Dist |
|---|---|---|---|---|---|---|---|---|
| 3 Bluebill Ave #610 Naples, FL | 1.0 | 1.0 | 810 | $5,000 | $6.17 | 25d | 1 | 0.01mi |
| 3 Bluebill Ave #303 Naples, FL | 2.0 | 2.0 | 1071 | $8,000 | $7.47 | 23d | 1 | 0.01mi |
| 5 Bluebill Ave Unit 303-1 Naples, FL | 2.0 | 2.0 | 1068 | $6,500 | $6.09 | 25d | 1 | 0.04mi |
| 5 Bluebill Ave Unit 505/605 Naples, FL | 2.0 | 2.5 | 1035 | $6,500 | $6.28 | 25d | 1 | 0.04mi |
| 5 Bluebill Ave #504 Naples, FL | 1.0 | 1.0 | 896 | $7,000 | $7.81 | 25d | 1 | 0.04mi |
| 5 Bluebill Ave Unit 108s Naples, FL | 1.0 | 1.0 | 859 | $4,995 | $5.81 | 25d | 1 | 0.04mi |
| 5 Bluebill Ave #403 Naples, FL | 2.0 | 2.0 | 1086 | $8,500 | $7.83 | 23d | 1 | 0.04mi |
| 5 Bluebill Ave #103 Naples, FL | 1.0 | 1.0 | 809 | $2,750 | $3.40 | 25d | 1 | 0.04mi |
| 5 Bluebill Ave Unit 108A Naples, FL | 1.0 | 1.0 | 859 | $1,995 | $2.32 | 25d | 1 | 0.04mi |
| 5 Bluebill Ave #104 Naples, FL | 1.0 | 1.0 | 817 | $5,000 | $6.12 | 25d | 1 | 0.04mi |
| 5 Bluebill Ave #209 Naples, FL | 2.0 | 2.0 | 1076 | $8,500 | $7.90 | 25d | 1 | 0.04mi |
| 5 Bluebill Ave #210 Naples, FL | 1.0 | 1.0 | 812 | $6,000 | $7.39 | 25d | 1 | 0.04mi |
| 1 Bluebill Ave #709 Naples, FL | 1.0 | 1.0 | 800 | $6,000 | $7.50 | 25d | 1 | 0.08mi |
| 1 Bluebill Ave #707 Naples, FL | 1.0 | 1.0 | 1040 | $6,500 | $6.25 | 25d | 1 | 0.08mi |
| 1 Bluebill Ave #501 Naples, FL | 1.0 | 1.0 | 768 | $2,095 | $2.73 | 25d | 1 | 0.08mi |
| 1 Bluebill Ave #412 Naples, FL | 2.0 | 2.0 | 1050 | $8,000 | $7.62 | 25d | 1 | 0.08mi |
| 1 Bluebill Ave #703 Naples, FL | 1.0 | 1.0 | 800 | $7,000 | $8.75 | 25d | 1 | 0.08mi |
| 1 Bluebill Ave #210 Naples, FL | 2.0 | 2.0 | 1040 | $5,900 | $5.67 | 25d | 1 | 0.08mi |
| 1 Bluebill Ave Naples, FL | 2.0 | 2.0 | 1051 | $7,500 | $7.14 | 25d | 1 | 0.08mi |
| 10686 Gulf Shore Dr Unit A-104 Naples, FL | 2.0 | 2.0 | 1107 | $8,000 | $7.23 | 15d | 1 | 0.32mi |
| 10420 Gulf Shore Dr #162 Naples, FL | 1.0 | 1.0 | 1045 | $8,500 | $8.13 | 25d | 1 | 0.56mi |
| 527 109th Ave N Naples, FL | 2.0 | 2.0 | 990 | $2,750 | $2.78 | 25d | 1 | 0.64mi |
| 564 109th Ave N Naples, FL | 2.0 | 2.0 | 1080 | $16,000 | $14.81 | 25d | 1 | 0.73mi |
| 602 111th Ave N Naples, FL | 2.0 | 2.0 | 1104 | $4,000 | $3.62 | 25d | 1 | 0.79mi |
| 10580 6th St Naples, FL | 2.0 | 1.0 | 1000 | $2,300 | $2.30 | 25d | 1 | 0.90mi |
| 547 101st Ave N Naples, FL | 2.0 | 1.0 | 768 | $2,750 | $3.58 | 25d | 1 | 0.97mi |
| 699 110th Ave N Unit B Naples, FL | 2.0 | 2.0 | 910 | $2,250 | $2.47 | 25d | 1 | 1.02mi |
| 699 110th Ave N Unit A Naples, FL | 2.0 | 1.0 | 1000 | $2,150 | $2.15 | 25d | 1 | 1.02mi |
| 531 99th Ave N Naples, FL | 2.0 | 1.0 | 794 | $2,000 | $2.52 | 25d | 1 | 1.04mi |
| 706 111th Ave N Naples, FL | 2.0 | 2.0 | 1080 | $1,850 | $1.71 | 25d | 1 | 1.05mi |
| 12945 Vanderbilt Dr Naples, FL | 2.0 | 2.0 | 1301 | $5,250 | $4.04 | 25d | 2 | 1.08mi |
| 746 109th Ave N Naples, FL | 2.0 | 1.0 | 850 | $1,895 | $2.23 | 25d | 1 | 1.17mi |
| 521 96th Ave N Unit B Naples, FL | 1.0 | 1.0 | 808 | $1,745 | $2.16 | 25d | 1 | 1.19mi |
| 663 100th Ave N Naples, FL | 2.0 | 1.0 | 1000 | $2,650 | $2.65 | 25d | 1 | 1.22mi |
| 778 107th Ave N Unit B Naples, FL | 2.0 | 1.0 | 588 | $1,750 | $2.98 | 25d | 1 | 1.28mi |
| 800 108th Ave N Unit 1534808P Naples, FL | 2.0 | 2.0 | 914 | $5,897 | $6.45 | 15d | 1 | 1.33mi |
| 271 Southbay Dr Naples, FL | 2.0 | 2.0 | 1050 | $2,700 | $2.57 | 25d | 1 | 1.36mi |
| 271 Southbay Dr #235 Naples, FL | 2.0 | 2.0 | 1075 | $8,000 | $7.44 | 25d | 1 | 1.37mi |
| 271 Southbay Dr #235 Naples, FL | 2.0 | 2.0 | 1075 | $8,000 | $7.44 | 15d | 1 | 1.37mi |
| 271 Southbay Dr #155 Naples, FL | 2.0 | 2.0 | 1056 | $10,000 | $9.47 | 25d | 1 | 1.37mi |
HOA detail condo
- Monthly dues
- $930 · $11,160/yr
- Likely covers
- water
- Assessments
- None detected in remarks — confirm with the listing agent.
Listing history 12 events
-
2026-06-21days on market $350,000 Active 19 DOM
-
2026-06-18days on market $350,000 Active 16 DOM
-
2026-06-17days on market $350,000 Active 15 DOM
-
2026-06-16days on market $350,000 Active 14 DOM
-
2026-06-15days on market $350,000 Active 13 DOM
-
2026-06-14days on market $350,000 Active 11 DOM
-
2026-06-10days on market $350,000 Active 8 DOM
-
2026-06-09days on market $350,000 Active 7 DOM
-
2026-06-08days on market $350,000 Active 6 DOM
-
2026-06-07days on market $350,000 Active 5 DOM
-
2026-06-03remarks 693-char remark
-
2026-06-03$350,000 Active 1 DOM
ⓘ Source: listings_history table (triggers on properties + properties_extension) + one-shot
backfill from property_details.listing_events for pre-trigger history.
Tax reassessment forecast FL · Resets to sale price
- Current annual tax
- $2,039 · $170/mo
- Projected year-2 tax
- $2,905 · $242/mo
- Expected delta
- +$866/yr (+$72/mo · 42.5%)
ⓘ Screening estimate from a state-policy table — verify with the county assessor before closing.
Climate risk First Street
- Flood 9/10 Extreme FEMA zone AE · 99% chance over 30 yrs
- Wildfire 1/10 Low
- Heat 10/10 Extreme 7 d/yr ≥107°F today · 30 d/yr by 30 yrs out
- Wind 10/10 Extreme 99% chance of damaging wind over 30 yrs
- Air quality 2/10 Low 1 unhealthy d/yr today · 1 by 30 yrs out
Nearby sold comps map
Loading sold comps map…
Walkable amenities ~0.75 mi
Loading nearby amenities…
Taxation est. · year 1
- Rental income
- $50,301
- − Mortgage interest
- −$19,605
- − Property taxes
- −$2,039
- − Insurance
- −$6,868
- − Repairs & maintenance
- −$4,024
- − Management
- −$4,024
- − HOA
- −$11,160
- − Depreciation
- −$10,182
- Taxable loss
- −$7,602
- Est. tax savings @ 24.0%
- +$1,824
- After-tax cash flow
- $-530/yr
For passive investors: Depreciation is non-cash, so a rental often shows a tax loss while cash-flowing — sheltering income. Rental losses are passive: they offset passive income freely, and up to $25,000/yr can offset ordinary (W-2) income if you actively participate and your MAGI is under $100k (phasing out to $0 by $150k); unused losses carry forward. On sale, claimed depreciation is recaptured at up to 25%, and gains may owe capital-gains tax (a 1031 exchange can defer both). Figures are a year-1 estimate at your 24.0% rate — not tax advice; consult a CPA.
Schools (NCES district)
- District
- Collier
- NCES district ID
- 1200330
- Math proficiency
- 60% ▼ -4.00%
- Reading proficiency
- 56% ▼ -2.00%
- Median HH income
- $58,275
- Composite
- 50.23/100
- National rank
- #1892
- State rank
- #16 of 73 in FL
Livability — Naples Park
- Score
- 64/100
- State rank
- #696
- US rank
- #14564
Category grades
Schools grade is shown separately in the Schools card above.
Census & demographics
- County
- Collier County · 396,295 people
- Metro
- Naples-Marco Island, FL
- Population (ZIP)
- 16,237
- Household income
- $119,212
- Rent vs Own
- Severe rent burden
- 237.0
Population outlook (Collier County) Hauer SSP2
- Today (2025)
- 420,858 people
- By 2030
- 450,054 · +6.9%
- By 2040
- 502,232 · +19.3%
- By 2050
- 544,932 · +29.5%
- By 2075
- 627,203 · +49.0%
- By 2100
- 659,015 · +56.6%
Race, ethnicity, and origin ACS 2023
- Neighborhood character
- Predominantly White (87%)
- Race & ethnicity
- White 87% Hispanic / Latino 8% Two or more races 7% Asian 1% Black 1%
- Hispanic origin (detail)
- Mexican 2% Cuban 3%
- Common ancestry
- Romanian 5% Lithuanian 3% Slovak 3%
- Foreign-born
- 16% · Canada, Dominican Republic, South Korea
- Languages at home
- 86% English-only · Spanish 6% Russian/Polish/Slavic 2% Other Indo-European 2%
Political lean MEDSL · Collier
- 2024 margin
- Solid R (+33.1) · D 33.1% · R 66.2%
- 2008→2024 swing
- -10.6pp toward R · 2008: -22.5pp · 2024: -33.1pp
- All cycles
- 2024: R+33.1 2020: R+24.7 2016: R+26.0 2012: R+30.1 2008: R+22.5
Not yet ingested
- Civics
- —
Market trends
- HPI YoY
- ▼ -587.97%
- Current HPI
- 275.1872
- Rent YoY
- ▲ 8.74%
- Metro
- Naples-Marco Island, FL
- State GDP YoY
- ▲ 3.28%
- F500 in state
- 36
Industry mix (Fortune 500 HQ in FL)
| Industry | F500 HQs | Revenue |
|---|---|---|
| Industrial Technology | 2 | $29B |
|
||
| Insurance | 2 | $17B |
|
||
| Retail | 1 | $60B |
|
||
| Technology Distribution | 1 | $58B |
|
||
| Homebuilding | 1 | $35B |
|
||
| Technology Manufacturing | 1 | $35B |
|
||
Price history
+300.0% since first listed23 events — show timeline
- 2026-06-02 Listed $350,000 NAPLESMLS
- 2024-07-12 Listing Removed — NAPLESMLS
- 2024-04-12 Price Changed $480,000 NAPLESMLS
- 2024-01-31 Relisted — NAPLESMLS
- 2024-01-30 Price Changed $529,000 NAPLESMLS
- 2023-10-02 Listing Removed — NAPLESMLS
- 2023-06-21 Listed $540,000 NAPLESMLS
- 2016-11-09 Sold (Public Records) $315,000 Public Records
- 2016-11-09 Price Changed $315,000 NAPLESMLS
- 2016-11-08 Sold (MLS) $315,000 NAPLESMLS
- 2016-11-08 Price Changed $331,000 NAPLESMLS
- 2016-09-09 Pending — NAPLESMLS
- 2016-08-18 Price Changed $331,000 NAPLESMLS
- 2016-08-16 Price Changed $330,000 NAPLESMLS
- 2016-07-26 Price Changed $331,000 NAPLESMLS
- 2016-07-09 Price Changed $333,000 NAPLESMLS
- 2016-06-06 Price Changed $333,555 NAPLESMLS
- 2016-05-08 Relisted — NAPLESMLS
- 2013-12-30 Sold (Public Records) $185,000 Public Records
- 2013-12-27 Sold (MLS) $185,000 NAPLESMLS
- 2013-02-12 Listed $214,000 NAPLESMLS
- 1987-06-01 Sold (Public Records) $90,000 Public Records
- 1982-07-01 Sold (Public Records) $87,500 Public Records
Property tax history
+0.1%/yrLatest (2025): $2,039 · +4.3% YoY. Source: county tax records.
Cash-flow waterfall
monthlySold comps — $/sqft
last 12 mo · ≤1 miLoading sold comps…