13418 Fenwick Stream Dr · Balm, FL
Flood risk No data
- FEMA flood zone
- —
- Chance of flooding over 30 yrs
- —
- Est. flood insurance / yr
- —
Fire risk No data
- Est. fire insurance / yr
- —
Heat risk No data
- Hot days now (above threshold)
- —
- Hot days in 30 yrs
- —
Wind risk No data
- Chance of severe wind over 30 yrs
- —
Air-quality risk No data
- Unhealthy air days now
- —
- Unhealthy air days in 30 yrs
- —
Risk factors via First Street. Map © Google.
Why this score? — see what drove the D grade
The composite is a weighted blend of 9 inputs, each scored 0–100. Each bar is that input's sub-score; the figure is the points it added to the 100-point composite (weight × sub-score).
- Cash flow +11.4/30.0
- ARV discount +7.5/15.0
- Schools +4.2/10.0
- Condition / age +4.0/5.0
- Appreciation +3.8/10.0
- DSCR +3.4/10.0
- 1% rule +3.3/10.0
- Livability +3.2/5.0
- Rent growth +1.9/5.0
$317,400
🖨 Deal sheet (PDF) 📄 Offer letter ✓ Due diligence
Listing remarks
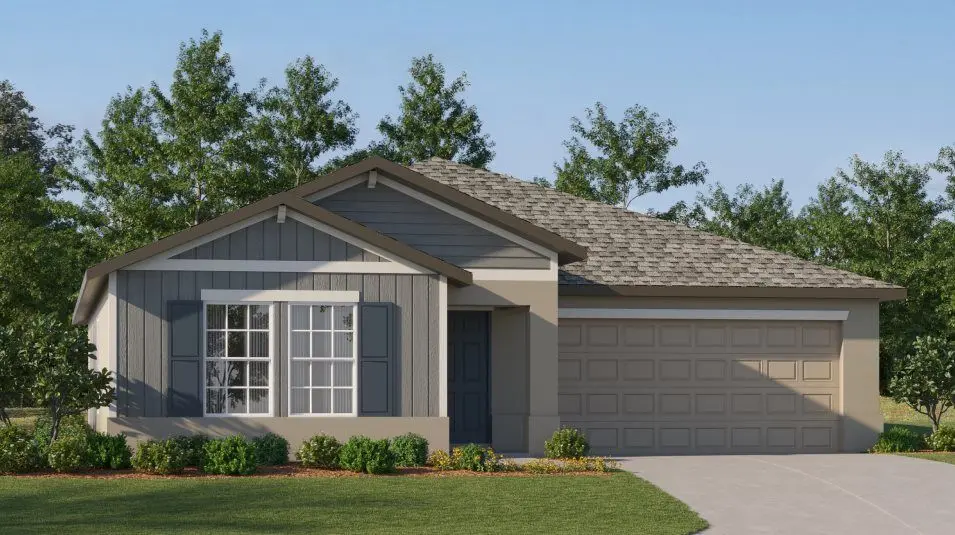
This single-story home optimizes space and prioritizes ease of living. An open concept design includes the family room and dining room as well as the kitchen with a center island to promote seamless transitions between activities. An attached patio provides outdoor space. Nearby is the cozy owner's suite with a private bathroom and spacious walk-in closet, while two bedrooms are located down the hall.
Key facts
- Walk-in closet
- Open concept design
- Private bathroom
Tags
Property features AI
Exterior
- Parking: 2 garage spaces; 2 total parking spaces
- Home design: Single-family home (Dover plan)
- Exterior features: Living area approximately 1555
Interior
- Bedrooms: 3 bedrooms
- Bathrooms: 2 bathrooms
- Interior features: Spec new construction (Dover plan)
Neighborhood map
What this means for you Summary
Snapshot
- This is a 3-bed/2.0-bath single-family listed at $317k. Condition is rated good.
Deal economics
- At list price, monthly cash flow is $-108 ($-1k/yr) — negative.
- To cash-flow at today's rent, offer at most $302k (4.9% below list).
- To meet the 1% rule (rent ≥ 1% of price), the offer needs to be $264k (16.8% below list).
- Recommended offer: $264k (16.8% below list) — sets the bar for 1% rule.
Location & tenants
- Location reads 63/100 on livability (#742 in FL) — a middle-class / working-renter tenant base. Strengths: crime A+, employment A+, housing A+; Watch: amenities F, commute F, health & safety F.
- Hillsborough (suburban): math 47% / reading 50% proficiency, ranked #41 of 73 in FL (top 56%) — families likely to look elsewhere, expect single-tenant / working-renter base with shorter leases.
- Zoned schools: Wimauma Elementary School (math 31% / reading 29%, grade F, #1,882 of 2,144 statewide, top 88%, 543 students, 81% FRL); Shields Middle School (math 29% / reading 27%, grade F, #486 of 571 statewide, top 86%, 1,867 students, 68% FRL); Lennard High School (math 30% / reading 46%, grade F, #328 of 667 statewide, top 50%, 2,404 students, 47% FRL).
- Zoned-school proficiency averages 32% at this address vs 48% district-wide (-16 pts) — the specific schools serving this property underperform the Hillsborough average; the district grade overstates school quality for this exact location.
- Market conditions: Rents soft (-2.5%/yr); 689 active listings in the ZIP; 3 comparable units currently listed for rent nearby; rentals at typical pace (median 26d on market — plan ~3-4 weeks tenant-placement turnaround); solid renter incomes; 9,053 units permitted in Hillsborough County in 2024 (4,555 in 5+ unit buildings).
- This rent runs 32% of the median local income ($98k/yr) — at the standard rent-burdened threshold; future hikes will face affordability resistance.
Forward outlook
- Local home prices are declining (-2.4%/yr); year-one equity from $2k of loan paydown is wiped out by about $7k of value loss. Plan a longer hold.
- Hillsborough County population projected at +37% by 2050 — long-run rental-demand tailwind backs the buy-and-hold thesis.
Negotiation context
- Only 10 days on market — expect competitive offers; lowballing is unlikely to land.
Questions for the listing agent
- What do current leases actually rent for vs. the listed asking? Can we see a recent rent roll and the last 12 months of T-12 income?
- Is there a deadline driving the sale (1031 exchange, divorce, estate, relocation)? That informs how much negotiation room exists.
- Schools are F-rated, which usually means shorter tenancies and higher turnover. Who's the typical renter profile here, and what's been the actual vacancy rate?
- The area grade is low — what's the realistic commute time and amenity access for the typical tenant pool here? Any planned neighborhood developments (good or bad) we should know about?
- What's the average days-on-market for RENTAL listings here right now (not sales)? A rising rental-DOM trend means longer vacancies and softer asking-rent achievability than the comps imply.
- What's the recent tenant-quality profile in this submarket — average credit score on applications, eviction rate, late-payment / NSF rate, and stable-employment percentage? A property-management company in the area should have these aggregated.
- How much new for-sale + rental construction is in the pipeline within 1–3 miles? Heavy new supply typically softens prices + rents 12–24 months out; constrained supply supports both.
Investment metrics
- 1% rule
- 0.83% ✗
- Cap rate
- 5.89%
- Cash-on-cash
- -1.45%
- DSCR
- 0.94
- GRM
- 10.0
CMA / ARV
No comps found within radius.
Projected returns pro-forma
-2.35% appreciation · 0.0% rent growth · sell at horizon
- IRR
- -17.6%
- Equity multiple
- 0.36×
- Total profit
- $-57,226
- Equity at exit
- $56,647
- IRR
- -15.4%
- Equity multiple
- 0.09×
- Total profit
- $-80,727
- Equity at exit
- $43,727
Cash invested: $88,872 (down + closing). Projections, not guarantees.
Landlord ↔ Tenant lean methodology
- Overall (STATE)
- 87 Strongly Landlord-Friendly
- State Florida
- 87 Strongly Landlord-Friendly · R+3
- County
- — inherits STATE
- City
- — inherits STATE
ZIP-level market 33598
- Home prices YoY
- -0.9%
- Rents YoY
- -2.5%
- Active inventory
- 689
- Price-to-rent
- 10.0×
Monthly cashflow live
- Estimated rent
- $2,640 medium interval (Pro) →
- Mortgage (P&I)
- −$1,664
- Tax est. 1.5%
- −$397 /mo · $4,761/yr
- Insurance
- −$132
- HOA
- −$0
- Vacancy / Maint / Mgmt
- −$554
- Net cashflow
- $-108
Break-even live
Sensitivity live
| Price | -10% $112 | -5% $2 | +0% $-108 | +5% $-217 | +10% $-327 |
|---|---|---|---|---|---|
| Rent | -10% $-316 | -5% $-212 | +0% $-108 | +5% $-3 | +10% $101 |
| Rate | -1.0pp $52 | -0.5pp $-27 | base $-108 | +0.5pp $-190 | +1.0pp $-274 |
UW: 25.0% down · 7.5% · 30yr · 1.5% tax · 5.0% vac · 8.0% maint · 8.0% mgmt
Financing live
Cash to close
- Down payment
- $79,350
- Closing costs
- $9,522
- Reserves months
- —
- Total cash needed
- —
Loan-product check · same deal, 3 products live
Conventional
25% down · 7.5% · 30yr
- Down + closing
- —
- Monthly P&I
- —
- Monthly cashflow
- —
- DSCR
- —
- Eligible?
- —
Personal DTI + credit; lowest rate.
DSCR
20% down · 8.5% · 30yr
- Down + closing
- —
- Monthly P&I
- —
- Monthly cashflow
- —
- DSCR
- —
- Eligible?
- —
No personal income docs; deal must DSCR.
Hard money
10% down · 12.0% · 12mo
- Down + closing
- —
- Monthly P&I
- —
- Monthly cashflow
- —
- DSCR
- —
- Eligible?
- —
Short-term bridge; refi at stabilization.
Rent comps 3 comps
| Address | Beds | Baths | Sqft | Rent | $/sqft | DOM | Units | Dist |
|---|---|---|---|---|---|---|---|---|
| 15007 Coltman Hill Pl Wimauma, FL | 4.0 | 2.5 | 1924 | $2,550 | $1.33 | 26d | 1 | 0.13mi |
| 13181 Garnet Raspberry Ave Wimauma, FL | 4.0 | 2.0 | 1935 | $2,500 | $1.29 | 26d | 1 | 0.72mi |
| 13095 Calcite Blue Ave Wimauma, FL | 4.0 | 2.0 | 1936 | $2,300 | $1.19 | 19d | 1 | 0.83mi |
Listing history 7 events
-
2026-06-13days on market $317,400 Active 10 DOM
-
2026-06-09days on market $317,400 Active 7 DOM
-
2026-06-08pricedays on market $317,400 Active 6 DOM
-
2026-06-07pricedays on market $315,200 Active 5 DOM
-
2026-06-04days on market $315,100 Active 2 DOM
-
2026-06-02remarks 404-char remark
-
2026-06-02$315,100 Active 1 DOM
ⓘ Source: listings_history table (triggers on properties + properties_extension) + one-shot
backfill from property_details.listing_events for pre-trigger history.
Nearby sold comps map
Loading sold comps map…
Walkable amenities ~0.75 mi
Loading nearby amenities…
Taxation est. · year 1
- Rental income
- $31,683
- − Mortgage interest
- −$17,779
- − Property taxes
- −$4,761
- − Insurance
- −$1,587
- − Repairs & maintenance
- −$2,535
- − Management
- −$2,535
- − Depreciation
- −$9,233
- Taxable loss
- −$6,747
- Est. tax savings @ 24.0%
- +$1,619
- After-tax cash flow
- $327/yr
For passive investors: Depreciation is non-cash, so a rental often shows a tax loss while cash-flowing — sheltering income. Rental losses are passive: they offset passive income freely, and up to $25,000/yr can offset ordinary (W-2) income if you actively participate and your MAGI is under $100k (phasing out to $0 by $150k); unused losses carry forward. On sale, claimed depreciation is recaptured at up to 25%, and gains may owe capital-gains tax (a 1031 exchange can defer both). Figures are a year-1 estimate at your 24.0% rate — not tax advice; consult a CPA.
Condition & rehab AI · 12 photos
This single-story home is in good condition with a modern design and well-maintained exterior. It requires minor cosmetic updates to enhance its curb appeal and value.
Value-add opportunities
- Resale Paint exterior trim — Enhances curb appeal and reflects well on the home.
- Resale Replace carpet in living areas — Fresh carpet improves aesthetics and comfort.
- Rental Service HVAC system — Ensures the system is running efficiently and quietly, attracting renters.
Renovation cost estimate screening
Value-add ROI direction
- Resale Paint exterior trim — Enhances curb appeal and reflects well on the home. ↑
- Resale Replace carpet in living areas — Fresh carpet improves aesthetics and comfort. ↑
- Rental Service HVAC system — Ensures the system is running efficiently and quietly, attracting renters. ↑
ⓘ Cost ranges are severity-bucket heuristics (US national rule-of-thumb). Get contractor quotes + a written scope before underwriting a rehab budget.
Schools (NCES district)
- District
- Hillsborough
- NCES district ID
- 1200870
- Math proficiency
- 47% ▼ -8.00%
- Reading proficiency
- 50% ▼ -4.00%
- Median HH income
- $50,622
- Composite
- 41.6/100
- National rank
- #3435
- State rank
- #41 of 73 in FL
Livability — Balm
- Score
- 63/100
- State rank
- #742
- US rank
- #16016
Category grades
Schools grade is shown separately in the Schools card above.
Census & demographics
- Census place
- Balm, FL
- County
- Hillsborough County · 1,540,968 people
- City population
- 196
- Metro
- Tampa-St. Petersburg-Clearwater, FL
- Population (ZIP)
- 32,820
- Household income
- $97,520
- Rent vs Own
- Severe rent burden
- 149.0
Population outlook (Hillsborough County) Hauer SSP2
- Today (2025)
- 1,607,022 people
- By 2030
- 1,733,968 · +7.9%
- By 2040
- 1,979,565 · +23.2%
- By 2050
- 2,203,427 · +37.1%
- By 2075
- 2,667,893 · +66.0%
- By 2100
- 2,891,558 · +79.9%
Race, ethnicity, and origin ACS 2023
- Neighborhood character
- Diverse neighborhood (Simpson 0.67)
- Race & ethnicity
- White 40% Hispanic / Latino 39% Black 14% Two or more races 11% Asian 2%
- Hispanic origin (detail)
- Mexican 26% Puerto Rican 3% Cuban 1%
- Common ancestry
- Romanian 2% Scotch-Irish 2% Lithuanian 1%
- Foreign-born
- 23% · Canada, Jamaica, Guatemala
- Languages at home
- 62% English-only · Spanish 35% Other Indo-European 1% Arabic 1%
Political lean MEDSL · Hillsborough
- 2024 margin
- Toss-up / Even · D 47.8% · R 50.9% · Other 1.3%
- 2008→2024 swing
- -10.2pp toward R · 2008: 7.1pp · 2024: -3.1pp
- All cycles
- 2024: R+3.1 2020: D+6.9 2016: D+6.8 2012: D+6.7 2008: D+7.1
Not yet ingested
- Civics
- —
Market trends
- HPI YoY
- ▼ -2.35%
- Current HPI
- 271.8552
- Rent YoY
- ▼ -2.50%
- Metro
- Tampa-St. Petersburg-Clearwater, FL
- State GDP YoY
- ▲ 3.28%
- F500 in state
- 36
Industry mix (Fortune 500 HQ in FL)
| Industry | F500 HQs | Revenue |
|---|---|---|
| Industrial Technology | 2 | $29B |
|
||
| Insurance | 2 | $17B |
|
||
| Retail | 1 | $60B |
|
||
| Technology Distribution | 1 | $58B |
|
||
| Homebuilding | 1 | $35B |
|
||
| Technology Manufacturing | 1 | $35B |
|
||
Cash-flow waterfall
monthlySold comps — $/sqft
last 12 mo · ≤1 miLoading sold comps…