 Multi-family
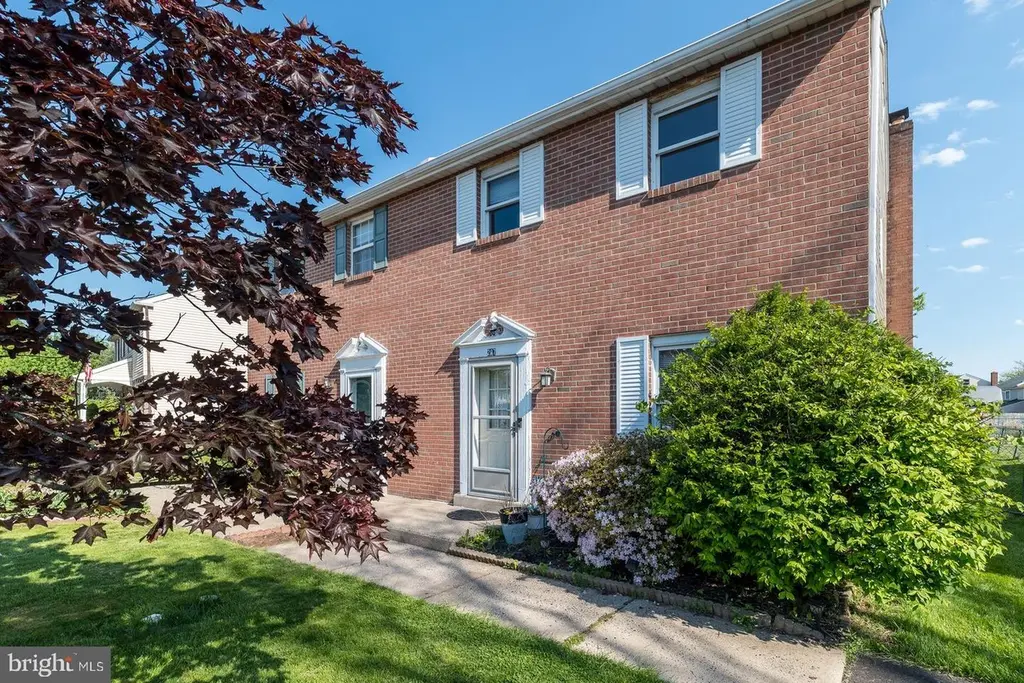
207 Hickory Dr · Quakertown, PA
Flood risk 1/10 · Minimal
- FEMA flood zone
- X (unshaded)
- Chance of flooding over 30 yrs
- 0.0%
- Est. flood insurance / yr
- $507 – $1,088
Fire risk 1/10 · Minimal
- Est. fire insurance / yr
- $511 – $949
Heat risk 5/10 · Moderate
- Hot days now (above 101°F)
- 7 days/yr
- Hot days in 30 yrs
- 16 days/yr
Wind risk 5/10 · Moderate
- Chance of severe wind over 30 yrs
- 23.0%
Air-quality risk 2/10 · Minimal
- Unhealthy air days now
- 1 days/yr
- Unhealthy air days in 30 yrs
- 2 days/yr
Risk factors via First Street. Map © Google.
Why this score? — see what drove the D grade
The composite is a weighted blend of 9 inputs, each scored 0–100. Each bar is that input's sub-score; the figure is the points it added to the 100-point composite (weight × sub-score).
- ARV discount +14.4/15.0
- Cash flow +10.6/30.0
- Schools +4.4/10.0
- Livability +4.0/5.0
- DSCR +3.1/10.0
- 1% rule +2.9/10.0
- Rent growth +2.5/5.0
- Condition / age +2.5/5.0
- Appreciation +0.0/10.0
$289,900
🖨 Deal sheet 📄 Offer letter ✓ Due diligence
Multi-family units
County records classify this as Multi-Family (2-4 Unit). Listing-text estimate: 1 unit. estimate disagrees with records
Listing remarks
* Highest and best due Monday 5/18 * * Open House 5/17, 2-4 * Need room? This home has it- with 4 bedrooms and 1800 sf of living space! Rooms are spacious, and bright, the living room has a cozy fireplace with beautiful brick hearth. The third floor has a huge 4th bedroom that can be used for many possibilities from play area, to music room, to crafting area, gaming room, and more. Recent updates include- a new roof in 2020, and new central air in 2021. Conveniently located just steps to all that Quakertown has to offer- proximity of major commuter routes, an abundance of shopping, and many parks and recreational opportunities. Sold As-Is.
Key facts
- Built 1975
- Listed 4 days
Property features AI
Finance
- Other: Ownership: Fee simple
Exterior
- Parking: Driveway
- Utilities: Public water; Public sewer
- Home design: Semi-detached structure; Frame construction
- Construction: Slab foundation; Above-grade finished living area reported
- Exterior features: Lot dimensions approximately 30 x 113
Interior
- Bedrooms: Four bedrooms on the upper level
- Bathrooms: One full bathroom; One half bathroom on the main level
- Heating & cooling: Forced air heating (electric); Central air conditioning (electric); Electric hot water
- Interior features: Fireplace (1); No basement
Neighborhood map
What this means for you Summary
Snapshot
- This is a 3-bed/1.5-bath multifamily listed at $290k.
Deal economics
- At list price, monthly cash flow is $-142 ($-2k/yr) — negative.
- To cash-flow at today's rent, offer at most $265k (8.7% below list).
- To meet the 1% rule (rent ≥ 1% of price), the offer needs to be $229k (21.0% below list).
- Recommended offer: $229k (21.0% below list) — sets the bar for 1% rule.
- Cap rate 5.7% vs local median 4.2% in Quakertown — top-decile yield for the area; either an underpriced asset or a hidden risk that comps aren't pricing in. Stress-test before assuming the spread holds.
Location & tenants
- Location reads 80/100 on livability (#222 in PA, #1,945 nationally) — a professional / high-income tenant draw. Strengths: housing A+, health & safety A+, cost of living A; Watch: commute F.
- Quakertown Community SD (suburban): math 45% / reading 55% proficiency, ranked #154 of 539 in PA (top 29%) — acceptable for families but not a draw, mixed tenant base, ~2y average lease.
- Market conditions: 144 active listings in the ZIP; 7 comparable units currently listed for rent nearby; rentals lingering (median 44d on market — plan ~5-8 weeks vacancy on turnover, expect pricing pressure); 71% of comp listings sitting > 30 days — soft ceiling on asking rent; solid renter incomes; 663 units permitted in Bucks County in 2024 (106 in 5+ unit buildings).
Forward outlook
- Local home prices are declining (-3.0%/yr); year-one equity from $2k of loan paydown is wiped out by about $9k of value loss. Plan a longer hold.
- Bucks County population projected to shrink 7% by 2050 — rents likely to lag national; underwrite the cash flow, not the appreciation.
Negotiation context
- Only 4 days on market — expect competitive offers; lowballing is unlikely to land.
- 2 sale attempts since 31y ago with the ask held roughly flat each time — persistent listings suggest the price (not the market) is what's stuck; bring a comps-based counter.
Risks & watch-outs
- Climate carrying-cost: moderate wind risk, 23% chance of damaging wind over 30y; extreme-heat days projected 7→16/yr by 2055 (HVAC capex compounding) — expect insurance premiums to compound above CPI over the hold.
Questions for the listing agent
- What do current leases actually rent for vs. the listed asking? Can we see a recent rent roll and the last 12 months of T-12 income?
- Built in 1975 — when were the roof, HVAC, electrical panel, plumbing, and water heater last replaced?
- Is there a deadline driving the sale (1031 exchange, divorce, estate, relocation)? That informs how much negotiation room exists.
- Schools are A-rated — typically a magnet for longer-tenancy family renters. What's the average tenant stay here, and is there a school-zone premium baked into asking?
- The area grade is low — what's the realistic commute time and amenity access for the typical tenant pool here? Any planned neighborhood developments (good or bad) we should know about?
- What's the average days-on-market for RENTAL listings here right now (not sales)? A rising rental-DOM trend means longer vacancies and softer asking-rent achievability than the comps imply.
- What's the recent tenant-quality profile in this submarket — average credit score on applications, eviction rate, late-payment / NSF rate, and stable-employment percentage? A property-management company in the area should have these aggregated.
- How much new apartment / multifamily construction is in the pipeline within 1–3 miles? Heavy new supply (>2% of stock underway) typically softens rents 12–24 months out; light construction supports rent growth.
Investment metrics
- 1% rule
- 0.79% ✗
- Cap rate
- 5.70%
- Cash-on-cash
- -2.10%
- DSCR
- 0.91
- GRM
- 10.6
CMA / ARV
- ARV (median comp)
- $342,165
- List price
- $289,900
- Delta
- -15.27%
- Verdict
- UNDERPRICED
- Comps
- 5 within 1.0 mi
Projected returns pro-forma
-3.0% appreciation · 3.0% rent growth · sell at horizon
- IRR
- -19.8%
- Equity multiple
- 0.31×
- Total profit
- $-56,030
- Equity at exit
- $43,225
- IRR
- -12.6%
- Equity multiple
- 0.26×
- Total profit
- $-60,441
- Equity at exit
- $25,065
Cash invested: $81,172 (down + closing). Projections, not guarantees.
Landlord ↔ Tenant lean methodology
- Overall (STATE)
- 62 Landlord-Friendly
- State Pennsylvania
- 62 Landlord-Friendly · EVEN
- County
- — inherits STATE
- City
- — inherits STATE
ZIP-level market 18951
- Active inventory
- 144
- Price-to-rent
- 10.6×
Monthly cashflow live
- Estimated rent
- $2,290 high interval (Pro) →
- Mortgage (P&I)
- −$1,520
- Tax from tax record
- −$310 /mo · $3,720/yr
- Insurance
- −$121
- HOA
- −$0
- Vacancy / Maint / Mgmt
- −$481
- Net cashflow
- $-142
Break-even live
UW: 25.0% down · 7.5% · 30yr · 1.5% tax · 5.0% vac · 8.0% maint · 8.0% mgmt
Financing live
Cash to close
- Down payment
- $72,475
- Closing costs
- $8,697
- Reserves months
- —
- Total cash needed
- —
Loan-product check · same deal, 3 products live
Conventional
25% down · 7.5% · 30yr
- Down + closing
- —
- Monthly P&I
- —
- Monthly cashflow
- —
- DSCR
- —
- Eligible?
- —
Personal DTI + credit; lowest rate.
DSCR
20% down · 8.5% · 30yr
- Down + closing
- —
- Monthly P&I
- —
- Monthly cashflow
- —
- DSCR
- —
- Eligible?
- —
No personal income docs; deal must DSCR.
Hard money
10% down · 12.0% · 12mo
- Down + closing
- —
- Monthly P&I
- —
- Monthly cashflow
- —
- DSCR
- —
- Eligible?
- —
Short-term bridge; refi at stabilization.
Rent comps 7 comps
| Address | Beds | Baths | Sqft | Rent | $/sqft | DOM | Units | Dist |
|---|---|---|---|---|---|---|---|---|
| 27 Braithwaite Ln Quakertown, PA | 3.0 | 2.5 | 1475 | $2,300 | $1.56 | 43d | 1 | 0.05mi |
| 214 Trumbauersville Rd Quakertown, PA | 4.0 | 2.0 | 1400 | $2,500 | $1.79 | 43d | 1 | 0.63mi |
| 167 Sunshine Dr Quakertown, PA | 3.0 | 1.5 | 1616 | $2,150 | $1.33 | 24d | 1 | 0.96mi |
| 342 W Broad St Unit 2 Quakertown, PA | 2.0 | 2.0 | 1500 | $1,745 | $1.16 | 43d | 1 | 1.12mi |
| 159 Forsythia Ct Quakertown, PA | 3.0 | 1.5 | 1402 | $2,250 | $1.60 | 43d | 1 | 1.27mi |
| 211 Prairie Ct Quakertown, PA | 3.0 | 3.0 | 1300 | $2,195 | $1.69 | 43d | 1 | 1.30mi |
| 1108 Red Barn Ln Quakertown, PA | 3.0 | 1.5 | 1400 | $1,975 | $1.41 | 4d | 1 | 1.49mi |
Listing history 6 events
-
2026-05-18status Pending 651-char remark
-
2026-05-15$289,900 Active 651-char remark
-
2026-05-12historical $289,900 651-char remark
-
1995-12-22historical
-
1995-06-22$96,440
-
1977-02-24soldstatus $35,900
ⓘ Source: listings_history table (triggers on properties + properties_extension) + one-shot
backfill from property_details.listing_events for pre-trigger history.
Tax reassessment forecast PA · Partial reset (capped growth)
- Current annual tax
- $3,720 · $310/mo
- Projected year-2 tax
- $4,150 · $346/mo
- Expected delta
- +$430/yr (+$36/mo · 11.6%)
ⓘ Screening estimate from a state-policy table — verify with the county assessor before closing.
Climate risk First Street
- Flood 1/10 Low FEMA zone X (unshaded) · 0% chance over 30 yrs
- Wildfire 1/10 Low
- Heat 5/10 Major 7 d/yr ≥101°F today · 16 d/yr by 30 yrs out
- Wind 5/10 Major 23% chance of damaging wind over 30 yrs
- Air quality 2/10 Low 1 unhealthy d/yr today · 2 by 30 yrs out
Nearby sold comps map
Loading sold comps map…
Walkable amenities ~0.75 mi
Loading nearby amenities…
Taxation est. · year 1
- Rental income
- $27,476
- − Mortgage interest
- −$16,239
- − Property taxes
- −$3,720
- − Insurance
- −$1,450
- − Repairs & maintenance
- −$2,198
- − Management
- −$2,198
- − Depreciation
- −$8,433
- Taxable loss
- −$6,762
- Est. tax savings @ 24.0%
- +$1,623
- After-tax cash flow
- $-83/yr
For passive investors: Depreciation is non-cash, so a rental often shows a tax loss while cash-flowing — sheltering income. Rental losses are passive: they offset passive income freely, and up to $25,000/yr can offset ordinary (W-2) income if you actively participate and your MAGI is under $100k (phasing out to $0 by $150k); unused losses carry forward. On sale, claimed depreciation is recaptured at up to 25%, and gains may owe capital-gains tax (a 1031 exchange can defer both). Figures are a year-1 estimate at your 24.0% rate — not tax advice; consult a CPA.
Schools (NCES district)
- District
- Quakertown Community SD
- NCES district ID
- 4219890
- Math proficiency
- 45% ▼ -11.00%
- Reading proficiency
- 55% ▼ -15.00%
- Median HH income
- $66,186
- Composite
- 44.3/100
- National rank
- #2833
- State rank
- #154 of 539 in PA
Livability — Quakertown
- Score
- 80/100
- State rank
- #222
- US rank
- #1945
Category grades
Schools grade is shown separately in the Schools card above.
Census & demographics
- Census place
- Quakertown, PA
- County
- Bucks County · 506,477 people
- City population
- 36,568
- Metro
- Philadelphia-Camden-Wilmington, PA-NJ-DE-MD
- Population (ZIP)
- 36,568
- Household income
- $98,268
- Rent vs Own
- Severe rent burden
- 488.0
Population outlook (Bucks County) Hauer SSP2
- Today (2025)
- 630,973 people
- By 2030
- 627,093 · -0.6%
- By 2040
- 609,680 · -3.4%
- By 2050
- 584,225 · -7.4%
- By 2075
- 539,840 · -14.4%
- By 2100
- 483,970 · -23.3%
Race, ethnicity, and origin ACS 2023
- Neighborhood character
- Predominantly White (85%)
- Race & ethnicity
- White 85% Two or more races 7% Hispanic / Latino 6% Asian 3% Black 2%
- Hispanic origin (detail)
- Mexican 4% Puerto Rican 1%
- Common ancestry
- Romanian 5% Polish 3% Slovak 2%
- Foreign-born
- 7% · Canada, China, Jamaica
- Languages at home
- 90% English-only · Spanish 5% Other Indo-European 1% German/W. Germanic 1%
Political lean MEDSL · Bucks
- 2024 margin
- Toss-up / Even · D 49.5% · R 49.5%
- 2008→2024 swing
- -8.7pp toward R · 2008: 8.7pp · 2024: -0.1pp
- All cycles
- 2024: R+0.1 2020: D+4.4 2016: D+0.6 2012: D+1.2 2008: D+8.7
Not yet ingested
- Civics
- —
Market trends
- HPI YoY
- ▼ -247.25%
- Current HPI
- 283.2262
- Rent YoY
- —
- Metro
- Philadelphia-Camden-Wilmington, PA-NJ-DE-MD
- State GDP YoY
- ▲ 1.68%
- F500 in state
- 34
Industry mix (Fortune 500 HQ in PA)
| Industry | F500 HQs | Revenue |
|---|---|---|
| Healthcare | 2 | $309B |
|
||
| Insurance | 2 | $27B |
|
||
| Telecommunications / Media | 1 | $124B |
|
||
| Industrial Distribution | 1 | $22B |
|
||
| Financial Services | 1 | $20B |
|
||
| Chemicals / Materials | 1 | $18B |
|
||
Price history
+749.6% since first listed7 events — show timeline
- 2026-06-01 Sold (MLS) $305,000 BRIGHT MLS
- 2026-05-18 Pending — BRIGHT MLS
- 2026-05-15 Listed $289,900 BRIGHT MLS
- 2026-05-12 Coming Soon $289,900 BRIGHT MLS
- 1995-12-22 Listing Removed — BRIGHT MLS
- 1995-06-22 Listed $96,440 BRIGHT MLS
- 1977-02-24 Sold (Public Records) $35,900 Public Records
Property tax history
+1.6%/yrLatest (2026): $3,720 · +4.3% YoY. Source: county tax records.
Cash-flow waterfall
monthlySold comps — $/sqft
last 12 mo · ≤1 miLoading sold comps…