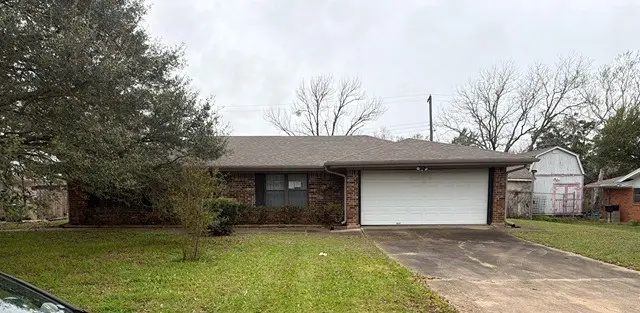
2302 Kent St · Bryan, TX
Flood risk 1/10 · Minimal
- FEMA flood zone
- X (unshaded)
- Chance of flooding over 30 yrs
- 0.0%
- Est. flood insurance / yr
- $507 – $1,088
Fire risk 1/10 · Minimal
- Est. fire insurance / yr
- $1,222 – $2,270
Heat risk 8/10 · Major
- Hot days now (above 110°F)
- 7 days/yr
- Hot days in 30 yrs
- 24 days/yr
Wind risk 8/10 · Major
- Chance of severe wind over 30 yrs
- 80.0%
Air-quality risk 1/10 · Minimal
- Unhealthy air days now
- 0 days/yr
- Unhealthy air days in 30 yrs
- 0 days/yr
Risk factors via First Street. Map © Google.
Why this score? — see what drove the C- grade
The composite is a weighted blend of 9 inputs, each scored 0–100. Each bar is that input's sub-score; the figure is the points it added to the 100-point composite (weight × sub-score).
- ARV discount +15.0/15.0
- Cash flow +14.7/30.0
- 1% rule +5.2/10.0
- DSCR +4.5/10.0
- Livability +3.8/5.0
- Rent growth +3.0/5.0
- Schools +2.6/10.0
- Condition / age +2.5/5.0
- Appreciation +0.0/10.0
$200,000
🖨 Deal sheet (PDF) 📄 Offer letter ✓ Due diligence
Listing remarks MLS
Great opportunity for the first time home buyer or investor. This property is located in the Lester's Windover Place subdivision. This property features 3 bedrooms, 2 full bathrooms, Formal Dining room, Family room, Closed in patio, and a storage shed. Located in an established neighborhood with mature trees. It is conveniently located close to major throughfares, Retail centers, Employment centers, Entertainment venues and Schools. Don't miss out on this one..
Key facts
- 0.26 acre lot
- 2 garage spots
- Built 1963
Neighborhood map
What this means for you Summary
Snapshot
- This is a 3-bed/2.0-bath single-family listed at $200k.
Deal economics
- At list price, monthly cash flow is $52 ($622/yr) — positive.
- The deal already cash-flows at list — no discount required.
- Meets the 1% rule at list price ($2k rent vs $200k).
- Recommended offer: $188k (6.0% below list) — sets the bar for market timing.
- Cap rate 6.6% vs local median 4.0% in Bryan — top-decile yield for the area; either an underpriced asset or a hidden risk that comps aren't pricing in. Stress-test before assuming the spread holds.
Location & tenants
- Location reads 76/100 on livability (#99 in TX, #3,341 nationally) — a middle-class / working-renter tenant base. Strengths: cost of living A+, housing A+, health & safety A+; Watch: schools C-, crime C-, amenities C-.
- Bryan ISD (urban): math 30% / reading 32% proficiency, ranked #608 of 826 in TX (top 74%) — families likely to look elsewhere, expect single-tenant / working-renter base with shorter leases; 68% free/reduced lunch — lower-income household profile, screen leases tightly.
- Market conditions: Rents rising (+1.8%/yr); 278 active listings in the ZIP; 15 comparable units currently listed for rent nearby; rentals at typical pace (median 22d on market — plan ~3-4 weeks tenant-placement turnaround); 47% of comp listings sitting > 30 days — soft ceiling on asking rent; 2,211 units permitted in Brazos County in 2024 (768 in 5+ unit buildings).
- This rent runs 35% of the median local income ($71k/yr) — at the standard rent-burdened threshold; future hikes will face affordability resistance.
Forward outlook
- Local home prices are declining (-3.0%/yr); year-one equity from $1k of loan paydown is wiped out by about $6k of value loss. Plan a longer hold.
- Brazos County population projected at +55% by 2050 — long-run rental-demand tailwind backs the buy-and-hold thesis.
Negotiation context
- It's been on market 76 days — a 6% lower offer ($188k) is reasonable based on typical stale-listing flexibility.
Risks & watch-outs
- Watch-outs: property tax is 2.6% of price.
- Climate carrying-cost: severe wind risk, 80% chance of damaging wind over 30y; extreme-heat days projected 7→24/yr by 2055 (HVAC capex compounding) — expect insurance premiums to compound above CPI over the hold.
Questions for the listing agent
- It's been on market 76 days. Have you received any prior offers? Is the seller open to a 6% concession, seller financing, or rate buy-down credit?
- Built in 1963 — when were the roof, HVAC, electrical panel, plumbing, and water heater last replaced?
- Property tax is high relative to price — has the assessment been appealed recently, and will the sale trigger a re-assessment?
- Why hasn't it sold? Are there any deal-killer items the seller is aware of (foundation, flood, title, zoning, code violations)?
- Is there a deadline driving the sale (1031 exchange, divorce, estate, relocation)? That informs how much negotiation room exists.
- What's the average days-on-market for RENTAL listings here right now (not sales)? A rising rental-DOM trend means longer vacancies and softer asking-rent achievability than the comps imply.
- What's the recent tenant-quality profile in this submarket — average credit score on applications, eviction rate, late-payment / NSF rate, and stable-employment percentage? A property-management company in the area should have these aggregated.
- How much new for-sale + rental construction is in the pipeline within 1–3 miles? Heavy new supply typically softens prices + rents 12–24 months out; constrained supply supports both.
Investment metrics
- 1% rule
- 1.02% ✓
- Cap rate
- 6.60%
- Cash-on-cash
- 1.11%
- DSCR
- 1.05
- GRM
- 8.1
CMA / ARV
- ARV (median comp)
- $289,462
- List price
- $200,000
- Delta
- -30.91%
- Verdict
- UNDERPRICED
- Comps
- 20 within 1.0 mi
Show comp detail 8 sales within ~0.75 mi
| Address | Dist | Beds/Ba | Sqft | Sold | Price | $/sf | Match |
|---|---|---|---|---|---|---|---|
| 2310 Morningside Dr | 0.32mi | 3/3.0 | 1,969 (-1%) | 6mo | $305,000 | $155 | 74 |
| 902 Mitchell St | 0.40mi | 3/2.0 | 1,928 (-3%) | 10mo | $295,000 | $153 | 68 |
| 1908 Carter Creek Pkwy | 0.28mi | 4/3.0 (+1) | 1,978 (-0%) | 13mo | $425,000 | $215 | 67 |
| 2210 Sharon Dr | 0.13mi | 3/2.0 | 1,809 (-9%) | 16mo | $239,900 | $133 | 66 |
| 1317 Garden Ln | 0.31mi | 3/2.0 | 1,716 (-14%) | 2mo | $299,900 | $175 | 62 |
| 2524 Willow Bend Dr | 0.49mi | 4/2.5 (+1) | 2,113 (+6%) | 2mo | $400,000 | $189 | 58 |
| 2415 Morris Ln | 0.42mi | 3/2.0 | 2,101 (+6%) | 16mo | $320,000 | $152 | 57 |
| 1114 Sul Ross Dr | 0.60mi | 3/2.5 | 2,025 (+2%) | 19mo | $320,000 | $158 | 51 |
Match score weights: distance 35% · size 25% · config 20% · recency 20%. Top-matched comps best support the ARV.
Projected returns pro-forma
-3.0% appreciation · 1.82% rent growth · sell at horizon
- IRR
- -15.9%
- Equity multiple
- 0.44×
- Total profit
- $-31,369
- Equity at exit
- $29,821
- IRR
- -9.9%
- Equity multiple
- 0.43×
- Total profit
- $-32,114
- Equity at exit
- $17,292
Cash invested: $56,000 (down + closing). Projections, not guarantees.
Landlord ↔ Tenant lean methodology
- Overall (STATE)
- 87 Strongly Landlord-Friendly
- State Texas
- 87 Strongly Landlord-Friendly · R+5
- County
- — inherits STATE
- City
- — inherits STATE
ZIP-level market 77802
- Rents YoY
- 1.8%
- Active inventory
- 278
- Price-to-rent
- 8.1×
Monthly cashflow live
- Estimated rent
- $2,048 high interval (Pro) →
- Mortgage (P&I)
- −$1,049
- Tax from tax record
- −$434 /mo · $5,211/yr
- Insurance
- −$83
- HOA
- −$0
- Vacancy / Maint / Mgmt
- −$430
- Net cashflow
- $52
Break-even live
Sensitivity live
| Price | -10% $165 | -5% $108 | +0% $52 | +5% $-5 | +10% $-61 |
|---|---|---|---|---|---|
| Rent | -10% $-110 | -5% $-29 | +0% $52 | +5% $133 | +10% $214 |
| Rate | -1.0pp $153 | -0.5pp $103 | base $52 | +0.5pp $0 | +1.0pp $-53 |
UW: 25.0% down · 7.5% · 30yr · 1.5% tax · 5.0% vac · 8.0% maint · 8.0% mgmt
Financing live
Cash to close
- Down payment
- $50,000
- Closing costs
- $6,000
- Reserves months
- —
- Total cash needed
- —
Loan-product check · same deal, 3 products live
Conventional
25% down · 7.5% · 30yr
- Down + closing
- —
- Monthly P&I
- —
- Monthly cashflow
- —
- DSCR
- —
- Eligible?
- —
Personal DTI + credit; lowest rate.
DSCR
20% down · 8.5% · 30yr
- Down + closing
- —
- Monthly P&I
- —
- Monthly cashflow
- —
- DSCR
- —
- Eligible?
- —
No personal income docs; deal must DSCR.
Hard money
10% down · 12.0% · 12mo
- Down + closing
- —
- Monthly P&I
- —
- Monthly cashflow
- —
- DSCR
- —
- Eligible?
- —
Short-term bridge; refi at stabilization.
Rent comps 15 comps
| Address | Beds | Baths | Sqft | Rent | $/sqft | DOM | Units | Dist |
|---|---|---|---|---|---|---|---|---|
| 2812 Village Dr Bryan, TX | 2.0 | 2.0 | 1244 | $1,400 | $1.13 | 44d | 1 | 0.54mi |
| 1503 Hollow Hill Dr Unit A Bryan, TX | 3.0 | 3.0 | 1364 | $1,550 | $1.14 | 44d | 1 | 0.56mi |
| 1503 Hollow Hill Dr Unit A Bryan, TX | 3.0 | 3.0 | 1364 | $1,550 | $1.14 | 14d | 1 | 0.56mi |
| 1815 Gettysburg Ln Unit 1328085P Bryan, TX | 3.0 | 2.0 | 1603 | $3,721 | $2.32 | 22d | 1 | 0.75mi |
| 728 Meadow Ln Unit 1093291P Bryan, TX | 3.0 | 2.0 | 1517 | $4,919 | $3.24 | 44d | 1 | 0.82mi |
| 1803 S College Ave Bryan, TX | 3.0 | 3.0 | 1760 | $1,800 | $1.02 | 14d | 1 | 0.88mi |
| 807 S Coulter Dr Bryan, TX | 4.0 | 3.0 | 2154 | $2,250 | $1.04 | 44d | 1 | 0.91mi |
| 501 Helena St Bryan, TX | 3.0 | 2.0 | 1424 | $2,200 | $1.54 | 22d | 1 | 1.20mi |
| 214 Helena St Unit 1071607P Bryan, TX | 4.0 | 3.0 | 2034 | $6,503 | $3.20 | 14d | 1 | 1.24mi |
| 2902 Chaparral Cir Bryan, TX | 4.0 | 3.0 | 2181 | $3,000 | $1.38 | 22d | 1 | 1.27mi |
| 814 E 28th St Bryan, TX | 2.0 | 2.0 | 1777 | $1,550 | $0.87 | 44d | 1 | 1.32mi |
| 2106 Barak Ln Bryan, TX | 4.0 | 2.5 | 1943 | $2,400 | $1.24 | 44d | 1 | 1.35mi |
| 2702 Apple Creek Cir Bryan, TX | 4.0 | 3.0 | 2198 | $2,800 | $1.27 | 14d | 1 | 1.37mi |
| 3213 Link St Unit 112 Bryan, TX | 3.0 | 3.5 | 1854 | $2,400 | $1.29 | 44d | 1 | 1.38mi |
| 407 Fairway Dr Bryan, TX | 4.0 | 2.0 | 1720 | $2,375 | $1.38 | 14d | 1 | 1.46mi |
Listing history 20 events
-
2026-06-18days on market $200,000 Active 76 DOM
-
2026-06-17days on market $200,000 Active 75 DOM
-
2026-06-16days on market $200,000 Active 74 DOM
-
2026-06-15days on market $200,000 Active 73 DOM
-
2026-06-14days on market $200,000 Active 71 DOM
-
2026-06-13days on market $200,000 Active 70 DOM
-
2026-06-10days on market $200,000 Active 68 DOM
-
2026-06-09days on market $200,000 Active 67 DOM
-
2026-06-08days on market $200,000 Active 66 DOM
-
2026-06-07days on market $200,000 Active 65 DOM
-
2026-06-03pricedays on market $200,000 Active 61 DOM
-
2026-06-02days on market $227,000 Active 60 DOM
-
2026-06-01days on market $227,000 Active 59 DOM
-
2026-05-31days on market $227,000 Active 58 DOM
-
2026-05-30days on market $227,000 Active 57 DOM
-
2026-05-08price $227,000 465-char remark
Show marketing remark (465 chars)
Great opportunity for the first time home buyer or investor. This property is located in the Lester's Windover Place subdivision. This property features 3 bedrooms, 2 full bathrooms, Formal Dining room, Family room, Closed in patio, and a storage shed. Located in an established neighborhood with mature trees. It is conveniently located close to major throughfares, Retail centers, Employment centers, Entertainment venues and Schools. Don't miss out on this one..
-
2026-04-28price $237,000 465-char remark
Show marketing remark (465 chars)
Great opportunity for the first time home buyer or investor. This property is located in the Lester's Windover Place subdivision. This property features 3 bedrooms, 2 full bathrooms, Formal Dining room, Family room, Closed in patio, and a storage shed. Located in an established neighborhood with mature trees. It is conveniently located close to major throughfares, Retail centers, Employment centers, Entertainment venues and Schools. Don't miss out on this one..
-
2026-04-03$252,000 Active 465-char remark
Show marketing remark (465 chars)
Great opportunity for the first time home buyer or investor. This property is located in the Lester's Windover Place subdivision. This property features 3 bedrooms, 2 full bathrooms, Formal Dining room, Family room, Closed in patio, and a storage shed. Located in an established neighborhood with mature trees. It is conveniently located close to major throughfares, Retail centers, Employment centers, Entertainment venues and Schools. Don't miss out on this one..
-
2023-03-02soldstatus
-
1994-07-01soldstatus
ⓘ Source: listings_history table (triggers on properties + properties_extension) + one-shot
backfill from property_details.listing_events for pre-trigger history.
Tax reassessment forecast TX · Resets to sale price
- Current annual tax
- $5,211 · $434/mo
- Projected year-2 tax
- $5,211 · $434/mo
- Expected delta
- $0/yr ($0/mo · 0.0%)
ⓘ Screening estimate from a state-policy table — verify with the county assessor before closing.
Climate risk First Street
- Flood 1/10 Low FEMA zone X (unshaded) · 0% chance over 30 yrs
- Wildfire 1/10 Low
- Heat 8/10 Severe 7 d/yr ≥110°F today · 24 d/yr by 30 yrs out
- Wind 8/10 Severe 80% chance of damaging wind over 30 yrs
- Air quality 1/10 Low 0 unhealthy d/yr today · 0 by 30 yrs out
Nearby sold comps map
Loading sold comps map…
Walkable amenities ~0.75 mi
Loading nearby amenities…
Taxation est. · year 1
- Rental income
- $24,580
- − Mortgage interest
- −$11,203
- − Property taxes
- −$5,211
- − Insurance
- −$1,000
- − Repairs & maintenance
- −$1,966
- − Management
- −$1,966
- − Depreciation
- −$5,818
- Taxable loss
- −$2,585
- Est. tax savings @ 24.0%
- +$620
- After-tax cash flow
- $1,242/yr
For passive investors: Depreciation is non-cash, so a rental often shows a tax loss while cash-flowing — sheltering income. Rental losses are passive: they offset passive income freely, and up to $25,000/yr can offset ordinary (W-2) income if you actively participate and your MAGI is under $100k (phasing out to $0 by $150k); unused losses carry forward. On sale, claimed depreciation is recaptured at up to 25%, and gains may owe capital-gains tax (a 1031 exchange can defer both). Figures are a year-1 estimate at your 24.0% rate — not tax advice; consult a CPA.
Schools (NCES district)
- District
- Bryan ISD
- NCES district ID
- 4811790
- Math proficiency
- 30% ▼ -8.00%
- Reading proficiency
- 32% ▼ -3.00%
- Median HH income
- $41,895
- Composite
- 26.26/100
- National rank
- #7253
- State rank
- #608 of 826 in TX
Livability — Bryan
- Score
- 76/100
- State rank
- #99
- US rank
- #3341
Category grades
Schools grade is shown separately in the Schools card above.
Census & demographics
- Census place
- Bryan, TX
- County
- Brazos County · 233,400 people
- City population
- 101,772
- Metro
- College Station-Bryan, TX
- Population (ZIP)
- 25,762
- Household income
- $70,666
- Rent vs Own
- Severe rent burden
- 1559.0
Population outlook (Brazos County) Hauer SSP2
- Today (2025)
- 267,942 people
- By 2030
- 296,630 · +10.7%
- By 2040
- 354,560 · +32.3%
- By 2050
- 414,616 · +54.7%
- By 2075
- 562,158 · +109.8%
- By 2100
- 678,828 · +153.3%
Race, ethnicity, and origin ACS 2023
- Neighborhood character
- Diverse neighborhood (Simpson 0.58)
- Race & ethnicity
- White 59% Hispanic / Latino 26% Two or more races 12% Black 11% Asian 2%
- Hispanic origin (detail)
- Mexican 23%
- Common ancestry
- Lithuanian 3% Slovak 2% Italian 2%
- Foreign-born
- 7% · Canada, South Korea
- Languages at home
- 82% English-only · Spanish 15% Korean 1% Russian/Polish/Slavic 1%
Political lean MEDSL · Brazos
- 2024 margin
- Strong R (+24.9) · D 36.9% · R 61.7% · Other 1.4%
- 2008→2024 swing
- +4.1pp toward D · 2008: -28.9pp · 2024: -24.9pp
- All cycles
- 2024: R+24.9 2020: R+14.3 2016: R+23.7 2012: R+35.3 2008: R+28.9
Not yet ingested
- Civics
- —
Market trends
- HPI YoY
- ▼ -148.67%
- Current HPI
- 202.0858
- Rent YoY
- ▲ 1.82%
- Metro
- College Station-Bryan, TX
- State GDP YoY
- ▲ 3.95%
- F500 in state
- 110
Industry mix (Fortune 500 HQ in TX)
| Industry | F500 HQs | Revenue |
|---|---|---|
| Energy | 16 | $1,198B |
|
||
| Technology | 5 | $198B |
|
||
| Engineering / Construction | 4 | $72B |
|
||
| Energy Services | 3 | $60B |
|
||
| Utilities | 3 | $41B |
|
||
| Healthcare | 2 | $330B |
|
||
Price history
-9.9% since first listed5 events — show timeline
- 2026-05-08 Price Changed $227,000 HARMLS
- 2026-04-28 Price Changed $237,000 HARMLS
- 2026-04-03 Listed $252,000 HARMLS
- 2023-03-02 Sold (Public Records) — Public Records
- 1994-07-01 Sold (Public Records) — Public Records
Property tax history
+5.5%/yrLatest (2025): $5,211 · +10.0% YoY. Source: county tax records.
Cash-flow waterfall
monthlySold comps — $/sqft
last 12 mo · ≤1 miLoading sold comps…