387 Martin Ave · Asbury, MO
Flood risk 1/10 · Minimal
- FEMA flood zone
- X (unshaded)
- Chance of flooding over 30 yrs
- 0.0%
- Est. flood insurance / yr
- $507 – $1,088
Fire risk 1/10 · Minimal
- Est. fire insurance / yr
- $1,054 – $1,958
Heat risk 5/10 · Moderate
- Hot days now (above 108°F)
- 7 days/yr
- Hot days in 30 yrs
- 19 days/yr
Wind risk 2/10 · Minimal
- Chance of severe wind over 30 yrs
- 3.0%
Air-quality risk 2/10 · Minimal
- Unhealthy air days now
- 0 days/yr
- Unhealthy air days in 30 yrs
- 1 days/yr
Risk factors via First Street. Map © Google.
Why this score? — see what drove the C+ grade
The composite is a weighted blend of 9 inputs, each scored 0–100. Each bar is that input's sub-score; the figure is the points it added to the 100-point composite (weight × sub-score).
- Cash flow +23.5/30.0
- DSCR +7.6/10.0
- ARV discount +7.5/15.0
- 1% rule +6.1/10.0
- Appreciation +5.8/10.0
- Schools +4.1/10.0
- Livability +2.9/5.0
- Rent growth +2.5/5.0
- Condition / age +2.5/5.0
$125,000
🖨 Deal sheet 📄 Offer letter ✓ Due diligence
Listing remarks
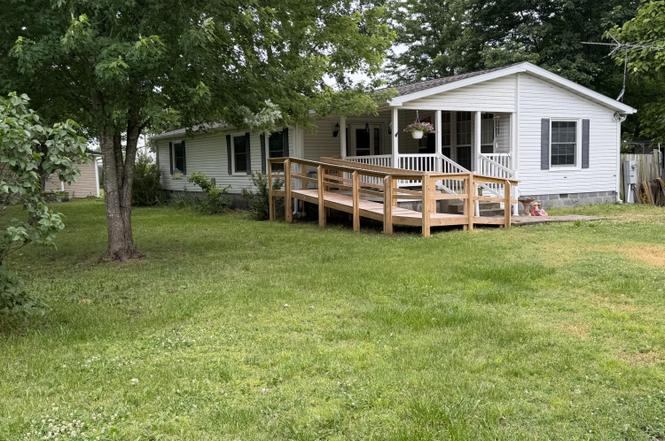
Welcome home to this well-maintained 3- bedroom, 2 bath manufactured home situated on a spacious 0.32 acre corner lot in Asbury, Missouri. Enjoy relaxing mornings on the covered front porch or entertaining on the large wood deck overlooking the backyard. Inside you'll find a comfortable floor plan with an abundance of built-in cabinetry throughout the kitchen and living room, providing both character and exceptional storage. Recent updates include a newer roof, replacement windows, and an updated air conditioning unit. The property also features a workshop/ storage building, perfect for equipment storage or extra workspace. Conveniently located with easy access to Joplin, Pittsburg, and sur
Key facts
- Covered front porch
- Built-in cabinetry
- Large wood deck
Tags
Property features AI
Finance
- Other: Accessible entrance with ramp
Exterior
- Parking: Has garage; Driveway with additional storage
- Utilities: Public water; Public sewer
- Home design: Manufactured single-family home; One level
- Construction: Vinyl siding; Composition roof; Block foundation; Built on a 100 x 140 (0.32 acre) level lot with few trees; Public-maintained asphalt city street frontage
- Exterior features: Rain gutters; Covered front porch; Deck; Shed(s) and outbuilding; Privacy, chain link and wood fencing; Has a view
Interior
- Kitchen: Electric oven; Free-standing electric range; Dishwasher; Refrigerator
- Bedrooms: Bedrooms located on main level
- Flooring: Carpet; Linoleum; Vinyl
- Bathrooms: 2 full bathrooms
- Heating & cooling: Central heating (forced air, electric); Central air conditioning; Ceiling fans
- Interior features: Vaulted ceilings; Garbage disposal
- Laundry & utility: Laundry on main level; Electric water heater
Neighborhood map
What this means for you Summary
Snapshot
- This is a 3-bed/2.0-bath other listed at $125k.
Deal economics
- At list price, monthly cash flow is $233 ($3k/yr) — positive.
- The deal already cash-flows at list — no discount required.
- Meets the 1% rule at list price ($1k rent vs $125k).
Location & tenants
- Location reads 57/100 on livability (#645 in MO) — a working-class tenant base; expect higher turnover. Strengths: cost of living A+, housing A+, employment B+; Watch: crime F, amenities F, commute F.
- Carl Junction R-I (suburban): math 42% / reading 53% proficiency, ranked #57 of 324 in MO (top 18%) — families likely to look elsewhere, expect single-tenant / working-renter base with shorter leases.
- Zoned schools: Carl Junction Primary K-1 (670 students, 37% FRL); Carl Junction Jr. High (math 43% / reading 50%, grade D+, #99 of 391 statewide, top 26%, 501 students, 42% FRL); Carl Junction High School (math 50% / reading 69%, grade C+, #35 of 521 statewide, top 8%, 960 students, 32% FRL).
- Market conditions: 6 active listings in the ZIP; 602 units permitted in Jasper County in 2024 (0 in 5+ unit buildings).
Forward outlook
- In year one you build about $3k of equity ($864 loan paydown + $2k appreciation (1.6% local appreciation)).
- At projected returns (1.6% appreciation + 3.0% rent growth), your $35k cash investment doubles in ~6 years — after that, you're playing with house money.
Negotiation context
- Only 3 days on market — expect competitive offers; lowballing is unlikely to land.
Risks & watch-outs
- Climate carrying-cost: extreme-heat days projected 7→19/yr by 2055 (HVAC capex compounding) — expect insurance premiums to compound above CPI over the hold.
Questions for the listing agent
- Is there a deadline driving the sale (1031 exchange, divorce, estate, relocation)? That informs how much negotiation room exists.
- Schools are F-rated, which usually means shorter tenancies and higher turnover. Who's the typical renter profile here, and what's been the actual vacancy rate?
- Crime grade is F in this area — have there been break-ins, vandalism, or insurance claims at this property in the last 3 years? What carrier currently insures it and at what premium?
- What's the average days-on-market for RENTAL listings here right now (not sales)? A rising rental-DOM trend means longer vacancies and softer asking-rent achievability than the comps imply.
- What's the recent tenant-quality profile in this submarket — average credit score on applications, eviction rate, late-payment / NSF rate, and stable-employment percentage? A property-management company in the area should have these aggregated.
- How much new for-sale + rental construction is in the pipeline within 1–3 miles? Heavy new supply typically softens prices + rents 12–24 months out; constrained supply supports both.
Investment metrics
- 1% rule
- 1.11% ✓
- Cap rate
- 8.53%
- Cash-on-cash
- 7.98%
- DSCR
- 1.36
- GRM
- 7.5
CMA / ARV
No comps found within radius.
Projected returns pro-forma
1.55% appreciation · 3.0% rent growth · sell at horizon
- IRR
- 11.2%
- Equity multiple
- 1.59×
- Total profit
- $20,571
- Equity at exit
- $46,279
- IRR
- 14.5%
- Equity multiple
- 2.85×
- Total profit
- $64,828
- Equity at exit
- $64,392
Cash invested: $35,000 (down + closing). Projections, not guarantees.
Landlord ↔ Tenant lean methodology
- Overall (STATE)
- 81 Strongly Landlord-Friendly
- State Missouri
- 81 Strongly Landlord-Friendly · R+10
- County
- — inherits STATE
- City
- — inherits STATE
ZIP-level market 64832
- Home prices YoY
- 1.3%
- Active inventory
- 6
- Price-to-rent
- 7.5×
Monthly cashflow live
- Estimated rent
- $1,388 medium interval (Pro) →
- Mortgage (P&I)
- −$656
- Tax est. 1.5%
- −$156 /mo · $1,875/yr
- Insurance
- −$52
- HOA
- −$0
- Vacancy / Maint / Mgmt
- −$291
- Net cashflow
- $233
Break-even live
UW: 25.0% down · 7.5% · 30yr · 1.5% tax · 5.0% vac · 8.0% maint · 8.0% mgmt
Financing live
Cash to close
- Down payment
- $31,250
- Closing costs
- $3,750
- Reserves months
- —
- Total cash needed
- —
Loan-product check · same deal, 3 products live
Conventional
25% down · 7.5% · 30yr
- Down + closing
- —
- Monthly P&I
- —
- Monthly cashflow
- —
- DSCR
- —
- Eligible?
- —
Personal DTI + credit; lowest rate.
DSCR
20% down · 8.5% · 30yr
- Down + closing
- —
- Monthly P&I
- —
- Monthly cashflow
- —
- DSCR
- —
- Eligible?
- —
No personal income docs; deal must DSCR.
Hard money
10% down · 12.0% · 12mo
- Down + closing
- —
- Monthly P&I
- —
- Monthly cashflow
- —
- DSCR
- —
- Eligible?
- —
Short-term bridge; refi at stabilization.
Listing history 5 events
-
2026-06-19days on market $125,000 Active 3 DOM
-
2026-06-18days on market $125,000 Active 2 DOM
-
2026-06-17$125,000 Active 1 DOM
-
2026-06-15remarks 699-char remark
-
2026-06-15$125,000 Active 1 DOM
ⓘ Source: listings_history table (triggers on properties + properties_extension) + one-shot
backfill from property_details.listing_events for pre-trigger history.
Climate risk First Street
- Flood 1/10 Low FEMA zone X (unshaded) · 0% chance over 30 yrs
- Wildfire 1/10 Low
- Heat 5/10 Major 7 d/yr ≥108°F today · 19 d/yr by 30 yrs out
- Wind 2/10 Low 3% chance of damaging wind over 30 yrs
- Air quality 2/10 Low 0 unhealthy d/yr today · 1 by 30 yrs out
Nearby sold comps map
Loading sold comps map…
Walkable amenities ~0.75 mi
Loading nearby amenities…
Taxation est. · year 1
- Rental income
- $16,657
- − Mortgage interest
- −$7,002
- − Property taxes
- −$1,875
- − Insurance
- −$625
- − Repairs & maintenance
- −$1,333
- − Management
- −$1,333
- − Depreciation
- −$3,636
- Taxable income
- $853
- Est. tax owed @ 24.0%
- −$205
- After-tax cash flow
- $2,588/yr
For passive investors: Depreciation is non-cash, so a rental often shows a tax loss while cash-flowing — sheltering income. Rental losses are passive: they offset passive income freely, and up to $25,000/yr can offset ordinary (W-2) income if you actively participate and your MAGI is under $100k (phasing out to $0 by $150k); unused losses carry forward. On sale, claimed depreciation is recaptured at up to 25%, and gains may owe capital-gains tax (a 1031 exchange can defer both). Figures are a year-1 estimate at your 24.0% rate — not tax advice; consult a CPA.
Schools (NCES district)
- District
- Carl Junction R-I
- NCES district ID
- 2907350
- Math proficiency
- 42% ▲ 1.00%
- Reading proficiency
- 53% ▬ 0.00%
- Median HH income
- $53,866
- Composite
- 41.04/100
- National rank
- #3580
- State rank
- #57 of 324 in MO
Livability — Asbury
- Score
- 57/100
- State rank
- #645
- US rank
- #21783
Category grades
Schools grade is shown separately in the Schools card above.
Census & demographics
- Census place
- Asbury, MO
- Population (ZIP)
- 1,376
Population outlook (Jasper County) Hauer SSP2
- Today (2025)
- 120,033 people
- By 2030
- 120,091 · +0.0%
- By 2040
- 119,297 · -0.6%
- By 2050
- 117,705 · -1.9%
- By 2075
- 110,402 · -8.0%
- By 2100
- 99,719 · -16.9%
Race, ethnicity, and origin ACS 2023
- Neighborhood character
- Predominantly White (91%)
- Race & ethnicity
- White 91% Native American 7% Two or more races 2%
- Common ancestry
- Serbian 2% Scottish 2% Lithuanian 1%
- Foreign-born
- 0%
Political lean MEDSL · Jasper
- 2024 margin
- Solid R (+46.8) · D 25.9% · R 72.7% · Other 1.4%
- 2008→2024 swing
- -13.6pp toward R · 2008: -33.2pp · 2024: -46.8pp
- All cycles
- 2024: R+46.8 2020: R+46.2 2016: R+50.8 2012: R+41.0 2008: R+33.2
Not yet ingested
- Civics
- —
Market trends
- HPI YoY
- ▲ 1.55%
- Current HPI
- 117.3355
- Rent YoY
- —
- Metro
- —
- State GDP YoY
- ▲ 1.84%
- F500 in state
- 20
Industry mix (Fortune 500 HQ in MO)
| Industry | F500 HQs | Revenue |
|---|---|---|
| Healthcare | 1 | $163B |
|
||
| Insurance | 1 | $21B |
|
||
| Industrial Technology | 1 | $17B |
|
||
| Retail | 1 | $16B |
|
||
| Industrial Distribution | 1 | $10B |
|
||
| Utilities | 1 | $9B |
|
||
Price history
2 events — show timeline
- 2026-06-15 Listed $125,000 SOMO
- 1998-07-22 Sold (Public Records) — Public Records
Property tax history
-1.9%/yrLatest (2025): $195 · -14.1% YoY. Source: county tax records.
Cash-flow waterfall
monthlySold comps — $/sqft
last 12 mo · ≤1 miLoading sold comps…