 Triplex
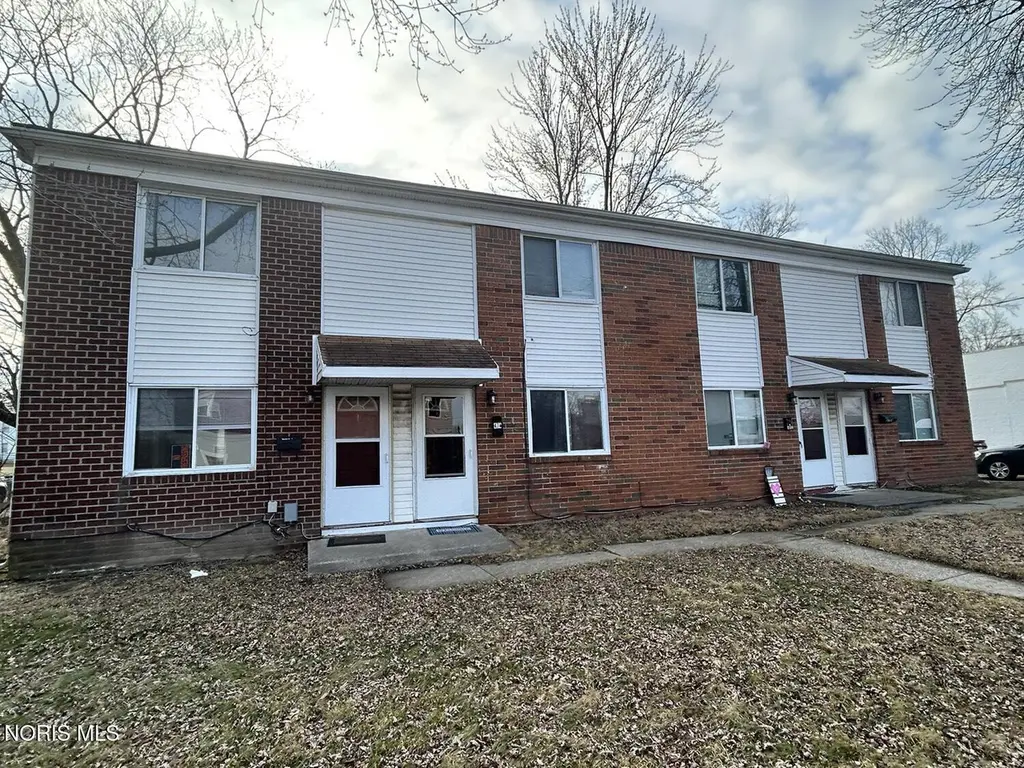
470 2nd St · Toledo, OH
Flood risk 7/10 · Major
- FEMA flood zone
- X (unshaded)
- Chance of flooding over 30 yrs
- 0.78%
- Est. flood insurance / yr
- $507 – $1,088
Fire risk 1/10 · Minimal
- Est. fire insurance / yr
- $713 – $1,323
Heat risk 3/10 · Minor
- Hot days now (above 100°F)
- 7 days/yr
- Hot days in 30 yrs
- 16 days/yr
Wind risk 2/10 · Minimal
- Chance of severe wind over 30 yrs
- —
Air-quality risk 2/10 · Minimal
- Unhealthy air days now
- 1 days/yr
- Unhealthy air days in 30 yrs
- 2 days/yr
Risk factors via First Street. Map © Google.
Why this score? — see what drove the B- grade
The composite is a weighted blend of 9 inputs, each scored 0–100. Each bar is that input's sub-score; the figure is the points it added to the 100-point composite (weight × sub-score).
- Cash flow +28.7/30.0
- DSCR +10.0/10.0
- 1% rule +8.9/10.0
- ARV discount +7.5/15.0
- Rent growth +3.8/5.0
- Livability +3.3/5.0
- Condition / age +2.5/5.0
- Schools +1.6/10.0
- Appreciation +0.0/10.0
$200,000
🖨 Deal sheet (PDF) 📄 Offer letter ✓ Due diligence
Multi-family units
County records classify this as Multi-Family (5+ Unit). Listing-text estimate: 3 units. estimate disagrees with records
5+ unit building — per-unit beds/baths from public records are typically unavailable; the breakdown below (if shown) is an estimate from the listing text.
Listing remarks
HOT Off the PRESS! Set your eyes on this well established 4 unit apartment building. Each unit has 675 square feet of townhouse style units with great layouts. The units have front and back doors with a nice yard area for tenant use. All units have separate utilities. Moat units have been updated. Rents are 799.00 per month for three units. The fourth unit has not been updated and rents at 620.00 per month. One year leases.
Key facts
- Updated units
- Separate utilities
- Front and back doors
Tags
Property features AI
Finance
- Other: Living area approximately 2,714 (public records)
- Financial info: Multi-family building with 4 total units (3 leased, 1 vacant); Tenant pays cable, electricity, gas, security, trash collection, water, satellite TV, and insurance; Owner pays common area maintenance, exterior maintenance, grounds care, repairs, roof maintenance, management, snow removal, taxes, and lawn care
- HOA & community: Curbs; Street lights; Picnic area
Exterior
- Parking: 4 parking spaces; Accessible parking
- Security: Smoke detectors; Security lights; Other security features
- Utilities: Public water; Public sewer; Electricity available and connected; Natural gas available and connected; Cable available
- Home design: Residential income property (apartment/quadruplex/townhouse); Two stories; Two levels; Public records for year built
- Construction: Brick and vinyl siding construction; Shingle roof; Crawl space foundation
- Exterior features: Corner lot; City street frontage; Asphalt road surface; Chain link fencing
Interior
- Kitchen: Water heater (appliance); Other appliances
- Flooring: Carpet; Vinyl
- Heating & cooling: Forced air heating; Natural gas heating; Heating available
- Interior features: Eat-in kitchen; Private entrance; Lighting; Other interior features
- Laundry & utility: In-unit laundry
Neighborhood map
What this means for you Summary
Snapshot
- This is a 3 × 1-bed/?-bath units multifamily listed at $200k.
Deal economics
- At list price, monthly cash flow is $600 ($7k/yr) — positive. Per door: $200/mo.
- The deal already cash-flows at list — no discount required.
- Meets the 1% rule at list price ($3k rent vs $200k).
- Recommended offer: $197k (1.5% below list) — sets the bar for market timing.
- Cap rate 10.3% vs local median 7.7% in Toledo — top-decile yield for the area; either an underpriced asset or a hidden risk that comps aren't pricing in. Stress-test before assuming the spread holds.
Location & tenants
- Location reads 66/100 on livability (#645 in OH) — a middle-class / working-renter tenant base. Strengths: cost of living A+, housing A+, health & safety A+; Watch: amenities C-, crime F, commute F.
- Toledo City (urban): math 15% / reading 24% proficiency, ranked #634 of 656 in OH (top 97%) — low school quality limits family demand, transient renter base, plan for 1-2y turnover; 72% free/reduced lunch — lower-income household profile, screen leases tightly.
- Zoned schools: Navarre Elementary School (math 12% / reading 14%, grade F, #1,429 of 1,584 statewide, top 90%, 428 students, 0% FRL); Waite High School (math 12% / reading 24%, grade F, #687 of 781 statewide, top 88%, 997 students, 0% FRL) — zoned schools average 0% FRL vs 72% district-wide (72 pts lower); this property's tenant base skews higher-income than the district average.
- Market conditions: Rents rising fast (+5.4%/yr); 118 active listings in the ZIP; 1 comparable units currently listed for rent nearby; lower-income renter base — watch delinquency; 415 units permitted in Lucas County in 2024 (122 in 5+ unit buildings).
- At $2,771/mo this rent would consume 85% of the median local household income ($39k/yr) (locally 1257% of renters already pay >50% of income on rent) — very limited rent-growth headroom before tenants either downsize or default.
Forward outlook
- Local home prices are declining (-3.0%/yr); year-one equity from $1k of loan paydown is wiped out by about $6k of value loss. Plan a longer hold.
- Lucas County population projected at -16% by 2050 — secular population decline; favor cash flow + early exit over multi-decade hold.
- At projected returns (-3.0% appreciation + 5.4% rent growth), your $56k cash investment doubles in ~8 years — after that, you're playing with house money.
Negotiation context
- It's been on market 19 days — a 2% lower offer ($197k) is reasonable based on typical stale-listing flexibility.
- 4 sale attempts since 5y ago with the ask held roughly flat each time — persistent listings suggest the price (not the market) is what's stuck; bring a comps-based counter.
Risks & watch-outs
- Watch-outs: flood insurance adds $66/mo.
- Climate carrying-cost: major flood risk — expect insurance premiums to compound above CPI over the hold.
Questions for the listing agent
- Can we see the unit-by-unit rent roll, current vacancy, and any below-market leases? What's the average tenancy length?
- What capital expenditures (roof, boiler, parking lot, exteriors) have been made in the last 5 years, and what's planned in the next 2?
- Built in 1966 — when were the roof, HVAC, electrical panel, plumbing, and water heater last replaced?
- What's the actual annual flood-insurance premium (NFIP or private), and is the property in a SFHA with mandatory coverage?
- Is there a deadline driving the sale (1031 exchange, divorce, estate, relocation)? That informs how much negotiation room exists.
- Schools are D-rated, which usually means shorter tenancies and higher turnover. Who's the typical renter profile here, and what's been the actual vacancy rate?
- Crime grade is F in this area — have there been break-ins, vandalism, or insurance claims at this property in the last 3 years? What carrier currently insures it and at what premium?
- What's the average days-on-market for RENTAL listings here right now (not sales)? A rising rental-DOM trend means longer vacancies and softer asking-rent achievability than the comps imply.
- What's the recent tenant-quality profile in this submarket — average credit score on applications, eviction rate, late-payment / NSF rate, and stable-employment percentage? A property-management company in the area should have these aggregated.
- How much new apartment / multifamily construction is in the pipeline within 1–3 miles? Heavy new supply (>2% of stock underway) typically softens rents 12–24 months out; light construction supports rent growth.
Investment metrics
- 1% rule
- 1.39% ✓
- Cap rate
- 10.29%
- Cash-on-cash
- 14.28%
- DSCR
- 1.64
- GRM
- 6.0
CMA / ARV
- ARV (on-the-fly)
- $70,564
- Comps found
- 3
Show comp detail 3 sales within ~0.75 mi
| Address | Dist | Beds/Ba | Sqft | Sold | Price | $/sf | Match |
|---|---|---|---|---|---|---|---|
| 638 Oswald St | 0.35mi | 4/2.0 (+1) | 2,553 (-6%) | 9mo | $46,000 | $18 | 57 |
| 349 Parker Ave | 0.47mi | 4/2.0 (+1) | 2,468 (-9%) | 2mo | $79,900 | $32 | 52 |
| 810 Euclid Ave | 0.40mi | 4/2.0 (+1) | 2,396 (-12%) | 11mo | $62,500 | $26 | 43 |
Match score weights: distance 35% · size 25% · config 20% · recency 20%. Top-matched comps best support the ARV.
Projected returns pro-forma
-3.0% appreciation · 5.37% rent growth · sell at horizon
- IRR
- 5.7%
- Equity multiple
- 1.23×
- Total profit
- $12,742
- Equity at exit
- $29,821
- IRR
- 17.4%
- Equity multiple
- 2.61×
- Total profit
- $90,130
- Equity at exit
- $17,292
Cash invested: $56,000 (down + closing). Projections, not guarantees.
Landlord ↔ Tenant lean methodology
- Overall (STATE)
- 73 Landlord-Friendly
- State Ohio
- 73 Landlord-Friendly · R+6
- County
- — inherits STATE
- City
- — inherits STATE
ZIP-level market 43605
- Home prices YoY
- -25.6%
- Rents YoY
- 5.4%
- Active inventory
- 118
- Price-to-rent
- 18.0×
Monthly cashflow live
- Estimated rent
- $2,771 high interval (Pro) →
- Mortgage (P&I)
- −$1,049
- Tax from tax record
- −$390 /mo · $4,685/yr
- Insurance
- −$83
- Flood insurance flood zone
- −$66 /mo · $798/yr
- HOA
- −$0
- Vacancy / Maint / Mgmt
- −$582
- Net cashflow
- $600
Break-even live
Sensitivity live
| Price | -10% $713 | -5% $657 | +0% $600 | +5% $543 | +10% $487 |
|---|---|---|---|---|---|
| Rent | -10% $381 | -5% $491 | +0% $600 | +5% $710 | +10% $819 |
| Rate | -1.0pp $701 | -0.5pp $651 | base $600 | +0.5pp $548 | +1.0pp $496 |
3-unit breakdown (identical units grouped — click to expand)
| Units | Beds | Baths | Est. rent |
|---|---|---|---|
| 3× units | 1 | — | $2,772 |
| #1 | 1 | — | $924 |
| #2 | 1 | — | $924 |
| #3 | 1 | — | $924 |
| Total (3 units) | $2,771 | ||
UW: 25.0% down · 7.5% · 30yr · 1.5% tax · 5.0% vac · 8.0% maint · 8.0% mgmt
Financing live
Cash to close
- Down payment
- $50,000
- Closing costs
- $6,000
- Reserves months
- —
- Total cash needed
- —
Loan-product check · same deal, 3 products live
Conventional
25% down · 7.5% · 30yr
- Down + closing
- —
- Monthly P&I
- —
- Monthly cashflow
- —
- DSCR
- —
- Eligible?
- —
Personal DTI + credit; lowest rate.
DSCR
20% down · 8.5% · 30yr
- Down + closing
- —
- Monthly P&I
- —
- Monthly cashflow
- —
- DSCR
- —
- Eligible?
- —
No personal income docs; deal must DSCR.
Hard money
10% down · 12.0% · 12mo
- Down + closing
- —
- Monthly P&I
- —
- Monthly cashflow
- —
- DSCR
- —
- Eligible?
- —
Short-term bridge; refi at stabilization.
Rent comps 1 comps
| Address | Beds | Baths | Sqft | Rent | $/sqft | DOM | Units | Dist |
|---|---|---|---|---|---|---|---|---|
| 335 N Superior St Toledo, OH | 3.0 | 2.0 | 3600 | $4,500 | $1.25 | 45d | 1 | 0.80mi |
Listing history 13 events
-
2026-06-21days on market $200,000 Active 19 DOM
-
2026-06-18days on market $200,000 Active 16 DOM
-
2026-06-17days on market $200,000 Active 15 DOM
-
2026-06-16days on market $200,000 Active 14 DOM
-
2026-06-15days on market $200,000 Active 13 DOM
-
2026-06-14days on market $200,000 Active 11 DOM
-
2026-06-10days on market $200,000 Active 8 DOM
-
2026-06-09days on market $200,000 Active 7 DOM
-
2026-06-08days on market $200,000 Active 6 DOM
-
2026-06-07days on market $200,000 Active 5 DOM
-
2026-06-05days on market $200,000 Active 2 DOM
-
2026-06-03remarks 429-char remark
-
2026-06-03$200,000 Active 1 DOM
ⓘ Source: listings_history table (triggers on properties + properties_extension) + one-shot
backfill from property_details.listing_events for pre-trigger history.
Tax reassessment forecast OH · Partial reset (capped growth)
- Current annual tax
- $4,685 · $390/mo
- Projected year-2 tax
- $4,685 · $390/mo
- Expected delta
- $0/yr ($0/mo · 0.0%)
ⓘ Screening estimate from a state-policy table — verify with the county assessor before closing.
Climate risk First Street
- Flood 7/10 Severe FEMA zone X (unshaded) · 78% chance over 30 yrs
- Wildfire 1/10 Low
- Heat 3/10 Moderate 7 d/yr ≥100°F today · 16 d/yr by 30 yrs out
- Wind 2/10 Low
- Air quality 2/10 Low 1 unhealthy d/yr today · 2 by 30 yrs out
Nearby sold comps map
Loading sold comps map…
Walkable amenities ~0.75 mi
Loading nearby amenities…
Taxation est. · year 1
- Rental income
- $33,252
- − Mortgage interest
- −$11,203
- − Property taxes
- −$4,685
- − Insurance
- −$1,798
- − Repairs & maintenance
- −$2,660
- − Management
- −$2,660
- − Depreciation
- −$5,818
- Taxable income
- $4,428
- Est. tax owed @ 24.0%
- −$1,063
- After-tax cash flow
- $6,138/yr
For passive investors: Depreciation is non-cash, so a rental often shows a tax loss while cash-flowing — sheltering income. Rental losses are passive: they offset passive income freely, and up to $25,000/yr can offset ordinary (W-2) income if you actively participate and your MAGI is under $100k (phasing out to $0 by $150k); unused losses carry forward. On sale, claimed depreciation is recaptured at up to 25%, and gains may owe capital-gains tax (a 1031 exchange can defer both). Figures are a year-1 estimate at your 24.0% rate — not tax advice; consult a CPA.
Schools (NCES district)
- District
- Toledo City
- NCES district ID
- 3904490
- Math proficiency
- 15% ▼ -16.00%
- Reading proficiency
- 24% ▼ -13.00%
- Median HH income
- $32,137
- Composite
- 15.76/100
- National rank
- #9276
- State rank
- #634 of 656 in OH
Livability — Toledo
- Score
- 66/100
- State rank
- #645
- US rank
- #11442
Category grades
Schools grade is shown separately in the Schools card above.
Census & demographics
- Census place
- Toledo, OH
- County
- Lucas County · 380,724 people
- City population
- 280,811
- Metro
- Toledo, OH
- Population (ZIP)
- 24,441
- Household income
- $39,118
- Rent vs Own
- Severe rent burden
- 1257.0
Population outlook (Lucas County) Hauer SSP2
- Today (2025)
- 420,751 people
- By 2030
- 410,187 · -2.5%
- By 2040
- 384,019 · -8.7%
- By 2050
- 355,125 · -15.6%
- By 2075
- 291,683 · -30.7%
- By 2100
- 233,670 · -44.5%
Race, ethnicity, and origin ACS 2023
- Neighborhood character
- Diverse neighborhood (Simpson 0.61)
- Race & ethnicity
- White 57% Hispanic / Latino 21% Black 14% Two or more races 14%
- Hispanic origin (detail)
- Mexican 17% Puerto Rican 2%
- Common ancestry
- Romanian 3% Lithuanian 2% Portuguese 1%
- Foreign-born
- 3% · Canada
- Languages at home
- 91% English-only · Spanish 7% Arabic 1%
Political lean MEDSL · Lucas
- 2024 margin
- D (+12.6) · D 55.8% · R 43.2%
- 2008→2024 swing
- -18.9pp toward R · 2008: 31.4pp · 2024: 12.6pp
- All cycles
- 2024: D+12.6 2020: D+16.8 2016: D+17.4 2012: D+30.4 2008: D+31.4
Not yet ingested
- Civics
- —
Market trends
- HPI YoY
- ▼ -47.85%
- Current HPI
- 138.6894
- Rent YoY
- ▲ 5.37%
- Metro
- Toledo, OH
- State GDP YoY
- ▲ 1.98%
- F500 in state
- 48
Industry mix (Fortune 500 HQ in OH)
| Industry | F500 HQs | Revenue |
|---|---|---|
| Insurance | 3 | $145B |
|
||
| Industrial Machinery | 3 | $49B |
|
||
| Financial Services | 3 | $24B |
|
||
| Consumer Goods | 2 | $93B |
|
||
| Aerospace / Defense | 2 | $47B |
|
||
| Utilities | 2 | $33B |
|
||
Price history
+29.0% since first listed7 events — show timeline
- 2026-06-02 Listed $200,000 NORIS
- 2024-08-26 Listing Removed — NORIS
- 2024-05-03 Price Changed $199,900 NORIS
- 2024-05-02 Relisted — NORIS
- 2024-02-23 Contingent — NORIS
- 2024-02-16 Listed $159,900 NORIS
- 2021-06-16 Listed $155,000 NORIS
Property tax history
+4.0%/yrLatest (2025): $4,685 · +1.5% YoY. Source: county tax records.
Cash-flow waterfall
monthlySold comps — $/sqft
last 12 mo · ≤1 miLoading sold comps…