 Multi-family
2170 N Main St · Londonderry, VT
Flood risk No data
- FEMA flood zone
- —
- Chance of flooding over 30 yrs
- —
- Est. flood insurance / yr
- —
Fire risk No data
- Est. fire insurance / yr
- —
Heat risk No data
- Hot days now (above threshold)
- —
- Hot days in 30 yrs
- —
Wind risk No data
- Chance of severe wind over 30 yrs
- —
Air-quality risk 2/10 · Minimal
- Unhealthy air days now
- 0 days/yr
- Unhealthy air days in 30 yrs
- 1 days/yr
Risk factors via First Street. Map © Google.
Why this score? — see what drove the C- grade
The composite is a weighted blend of 9 inputs, each scored 0–100. Each bar is that input's sub-score; the figure is the points it added to the 100-point composite (weight × sub-score).
- Cash flow +15.8/30.0
- Appreciation +10.0/10.0
- ARV discount +7.5/15.0
- Schools +5.0/10.0
- DSCR +4.9/10.0
- 1% rule +4.3/10.0
- Rent growth +2.5/5.0
- Livability +2.5/5.0
- Condition / age +2.2/5.0
$675,000
🖨 Deal sheet 📄 Offer letter ✓ Due diligence
Multi-family units
County records classify this as Multi-Family (2-4 Unit). Listing-text estimate: 1 unit. estimate disagrees with records
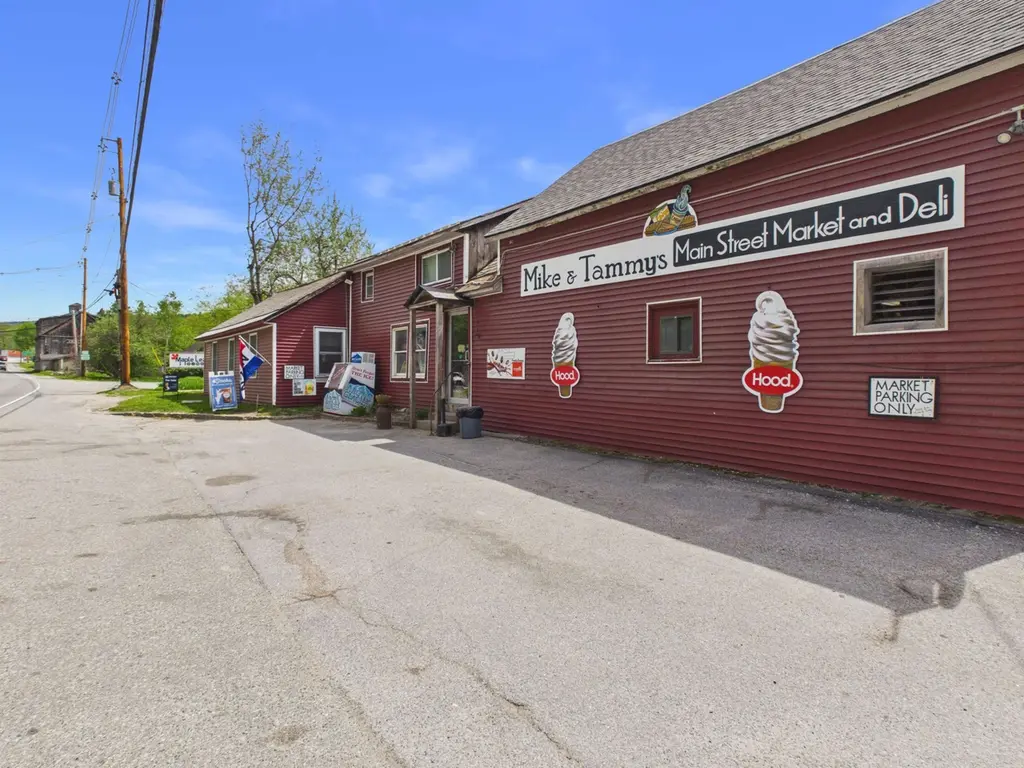
Listing remarks
For more than 20 years, this mixed-use property has been consistently operated and maintained by the same owner—an indicator of stability, reliability, and proven performance. The building features three distinct income channels: a fully equipped small-town diner with loyal local traffic, a well-established general market serving the community’s daily needs, and two rental apartments above that provide steady residential income. Positioned directly on a main road with excellent traffic exposure, the property benefits from continuous visibility and easy access, supporting both the commercial tenants and future growth potential. Whether you’re an investor seeking diversified
Key facts
- Easy access
- Immediate cash flow
- Mixed-use property
Tags
Property features AI
Finance
- Other: Total finished area approximately 6144; Total of 4 units; Easement status unknown; Listed by Elevations Real Estate
Exterior
- Parking: Gravel and paved driveway
- Utilities: Public sewer; Public water; Circuit breaker electrical service; Cable and telephone available; Cable and satellite internet options
- Home design: Apartment / multi-family, multi-level building; Built in 1970
- Construction: Post-and-beam and wood frame construction with wood siding; Corrugated and asphalt shingle roof
- Exterior features: Near shopping, schools, and skiing; Adjacent to a ski area and a stream; Neighboring commercial business; Public-maintained road frontage
Interior
- Bedrooms: Four-unit building with one 2-bedroom unit and one 3+-bedroom unit
- Heating & cooling: Wood boiler heating; No central cooling
- Interior features: Walkout basement; Basement has a dirt floor
Neighborhood map
What this means for you Summary
Snapshot
- This is a multifamily listed at $675k. Condition is rated fair.
Deal economics
- At list price, monthly cash flow is $304 ($4k/yr) — positive.
- The deal already cash-flows at list — no discount required.
- To meet the 1% rule (rent ≥ 1% of price), the offer needs to be $629k (6.8% below list).
- Recommended offer: $629k (6.8% below list) — sets the bar for 1% rule.
Location & tenants
- Location reads: area grade C — affects rentability + tenant quality, not the cash-flow math above.
- Market conditions: 22 active listings in the ZIP; 188 units permitted in Windham County in 2024 (0 in 5+ unit buildings).
Forward outlook
- In year one you build about $72k of equity ($5k loan paydown + $68k appreciation (10.0% local appreciation)).
- Windham County population projected at -26% by 2050 — secular population decline; favor cash flow + early exit over multi-decade hold.
- At projected returns (10.0% appreciation + 3.0% rent growth), your $189k cash investment doubles in ~3 years — after that, you're playing with house money.
- By year 2, paydown + projected appreciation supports a ~$116k cash-out refi (75% LTV) — recoverable capital for the next deal without selling this one.
Negotiation context
- It's been on market 22 days — a 2% lower offer ($665k) is reasonable based on typical stale-listing flexibility.
Questions for the listing agent
- Have any recent inspections been done? Can we get a copy of the seller's disclosures and any deferred-maintenance estimates?
- Built in 1970 — when were the roof, HVAC, electrical panel, plumbing, and water heater last replaced?
- Is there a deadline driving the sale (1031 exchange, divorce, estate, relocation)? That informs how much negotiation room exists.
- What's the average days-on-market for RENTAL listings here right now (not sales)? A rising rental-DOM trend means longer vacancies and softer asking-rent achievability than the comps imply.
- What's the recent tenant-quality profile in this submarket — average credit score on applications, eviction rate, late-payment / NSF rate, and stable-employment percentage? A property-management company in the area should have these aggregated.
- How much new apartment / multifamily construction is in the pipeline within 1–3 miles? Heavy new supply (>2% of stock underway) typically softens rents 12–24 months out; light construction supports rent growth.
Investment metrics
- 1% rule
- 0.93% ✗
- Cap rate
- 6.83%
- Cash-on-cash
- 1.93%
- DSCR
- 1.09
- GRM
- 8.9
CMA / ARV
No comps found within radius.
Projected returns pro-forma
10.0% appreciation · 3.0% rent growth · sell at horizon
- IRR
- 25.7%
- Equity multiple
- 3.05×
- Total profit
- $387,101
- Equity at exit
- $608,093
- IRR
- 22.6%
- Equity multiple
- 6.95×
- Total profit
- $1,124,893
- Equity at exit
- $1,311,377
Cash invested: $189,000 (down + closing). Projections, not guarantees.
Landlord ↔ Tenant lean methodology
- Overall (STATE)
- 41 Moderately Tenant-Leaning
- State Vermont
- 41 Moderately Tenant-Leaning · D+15
- County
- — inherits STATE
- City
- — inherits STATE
ZIP-level market 05148
- Home prices YoY
- 21.5%
- Active inventory
- 22
- Price-to-rent
- 26.8×
Monthly cashflow live
- Estimated rent
- $6,290 medium interval (Pro) →
- Mortgage (P&I)
- −$3,540
- Tax est. 1.5%
- −$844 /mo · $10,125/yr
- Insurance
- −$281
- HOA
- −$0
- Vacancy / Maint / Mgmt
- −$1,321
- Net cashflow
- $304
Break-even live
3-unit breakdown (identical units grouped — click to expand)
| Units | Beds | Baths | Est. rent |
|---|---|---|---|
| 3× units | 2 | 1 | $6,291 |
| #1 | 2 | 1 | $2,097 |
| #2 | 2 | 1 | $2,097 |
| #3 | 2 | 1 | $2,097 |
| Total (3 units) | $6,290 | ||
UW: 25.0% down · 7.5% · 30yr · 1.5% tax · 5.0% vac · 8.0% maint · 8.0% mgmt
Financing live
Cash to close
- Down payment
- $168,750
- Closing costs
- $20,250
- Reserves months
- —
- Total cash needed
- —
Loan-product check · same deal, 3 products live
Conventional
25% down · 7.5% · 30yr
- Down + closing
- —
- Monthly P&I
- —
- Monthly cashflow
- —
- DSCR
- —
- Eligible?
- —
Personal DTI + credit; lowest rate.
DSCR
20% down · 8.5% · 30yr
- Down + closing
- —
- Monthly P&I
- —
- Monthly cashflow
- —
- DSCR
- —
- Eligible?
- —
No personal income docs; deal must DSCR.
Hard money
10% down · 12.0% · 12mo
- Down + closing
- —
- Monthly P&I
- —
- Monthly cashflow
- —
- DSCR
- —
- Eligible?
- —
Short-term bridge; refi at stabilization.
Listing history 16 events
-
2026-06-18days on market $675,000 Active 22 DOM
-
2026-06-17days on market $675,000 Active 21 DOM
-
2026-06-16days on market $675,000 Active 20 DOM
-
2026-06-15days on market $675,000 Active 19 DOM
-
2026-06-15days on market $675,000 Active 18 DOM
-
2026-06-13days on market $675,000 Active 17 DOM
-
2026-06-12pricedays on market $675,000 Active 16 DOM
-
2026-06-09days on market $700,000 Active 13 DOM
-
2026-06-08days on market $700,000 Active 12 DOM
-
2026-06-08days on market $700,000 Active 11 DOM
-
2026-06-07days on market $700,000 Active 10 DOM
-
2026-06-03days on market $700,000 Active 7 DOM
-
2026-06-02days on market $700,000 Active 6 DOM
-
2026-06-01days on market $700,000 Active 5 DOM
-
2026-05-31days on market $700,000 Active 4 DOM
-
2026-05-27$700,000 Active
ⓘ Source: listings_history table (triggers on properties + properties_extension) + one-shot
backfill from property_details.listing_events for pre-trigger history.
Climate risk First Street
- Air quality 2/10 Low 0 unhealthy d/yr today · 1 by 30 yrs out
Nearby sold comps map
Loading sold comps map…
Walkable amenities ~0.75 mi
Loading nearby amenities…
Taxation est. · year 1
- Rental income
- $75,480
- − Mortgage interest
- −$37,810
- − Property taxes
- −$10,125
- − Insurance
- −$3,375
- − Repairs & maintenance
- −$6,038
- − Management
- −$6,038
- − Depreciation
- −$19,636
- Taxable loss
- −$7,544
- Est. tax savings @ 24.0%
- +$1,810
- After-tax cash flow
- $5,462/yr
For passive investors: Depreciation is non-cash, so a rental often shows a tax loss while cash-flowing — sheltering income. Rental losses are passive: they offset passive income freely, and up to $25,000/yr can offset ordinary (W-2) income if you actively participate and your MAGI is under $100k (phasing out to $0 by $150k); unused losses carry forward. On sale, claimed depreciation is recaptured at up to 25%, and gains may owe capital-gains tax (a 1031 exchange can defer both). Figures are a year-1 estimate at your 24.0% rate — not tax advice; consult a CPA.
Condition & rehab AI · 6 photos
This multi-family property requires significant repairs and maintenance, including roof, exterior, and HVAC work. Improvements will significantly enhance its value for both resale and rental purposes.
Repairs flagged
- Major roof — Significant snow and ice accumulation
- Major exterior siding — Signs of wear and tear
- Major HVAC/mechanicals — No visible units
Value-add opportunities
- Both roof repair — Fixing the roof will improve both the resale and rental value
- Both exterior painting — Painting the exterior will improve curb appeal and value
- Both HVAC installation — Upgrading HVAC will improve comfort and energy efficiency
Renovation cost estimate screening
| Repair item | Severity | Est. cost |
|---|---|---|
| roof · Significant snow and ice accumulation | Major | $15,000–50,000 |
| exterior siding · Signs of wear and tear | Major | $15,000–50,000 |
| HVAC/mechanicals · No visible units | Major | $15,000–50,000 |
| Total estimated repair cost · 3 items | $45,000–150,000 |
Value-add ROI direction
- Both roof repair — Fixing the roof will improve both the resale and rental value ↑
- Both exterior painting — Painting the exterior will improve curb appeal and value ↑
- Both HVAC installation — Upgrading HVAC will improve comfort and energy efficiency ↑
ⓘ Cost ranges are severity-bucket heuristics (US national rule-of-thumb). Get contractor quotes + a written scope before underwriting a rehab budget.
Schools (NCES district)
No district data.
Livability — Londonderry
No livability data for this city. (Only ~50 U.S. cities are tracked.)
Census & demographics
- Census place
- Londonderry, VT
- Population (ZIP)
- 1,550
Population outlook (Windham County) Hauer SSP2
- Today (2025)
- 40,432 people
- By 2030
- 38,472 · -4.8%
- By 2040
- 33,954 · -16.0%
- By 2050
- 29,774 · -26.4%
- By 2075
- 22,351 · -44.7%
- By 2100
- 15,961 · -60.5%
Race, ethnicity, and origin ACS 2023
- Neighborhood character
- Predominantly White (91%)
- Race & ethnicity
- White 91% Two or more races 5% Hispanic / Latino 4% Native American 2%
- Common ancestry
- Scotch-Irish 4% Lithuanian 2% Romanian 2%
- Foreign-born
- 4% · Canada
- Languages at home
- 98% English-only · French/Haitian/Cajun 1% Russian/Polish/Slavic 1% Spanish 1%
Political lean MEDSL · Windham
- 2024 margin
- Solid D (+42.7) · D 69.6% · R 26.9% · Other 3.5%
- 2008→2024 swing
- -5.4pp toward R · 2008: 48.1pp · 2024: 42.7pp
- All cycles
- 2024: D+42.7 2020: D+47.3 2016: D+42.0 2012: D+49.2 2008: D+48.1
Not yet ingested
- Civics
- —
Market trends
- HPI YoY
- ▲ 61.52%
- Current HPI
- 347.7405
- Rent YoY
- —
- Metro
- —
- State GDP YoY
- —
- F500 in state
- 0
Price history
1 event — show timeline
- 2026-05-27 Listed $700,000 PrimeMLS
Cash-flow waterfall
monthlySold comps — $/sqft
last 12 mo · ≤1 miLoading sold comps…