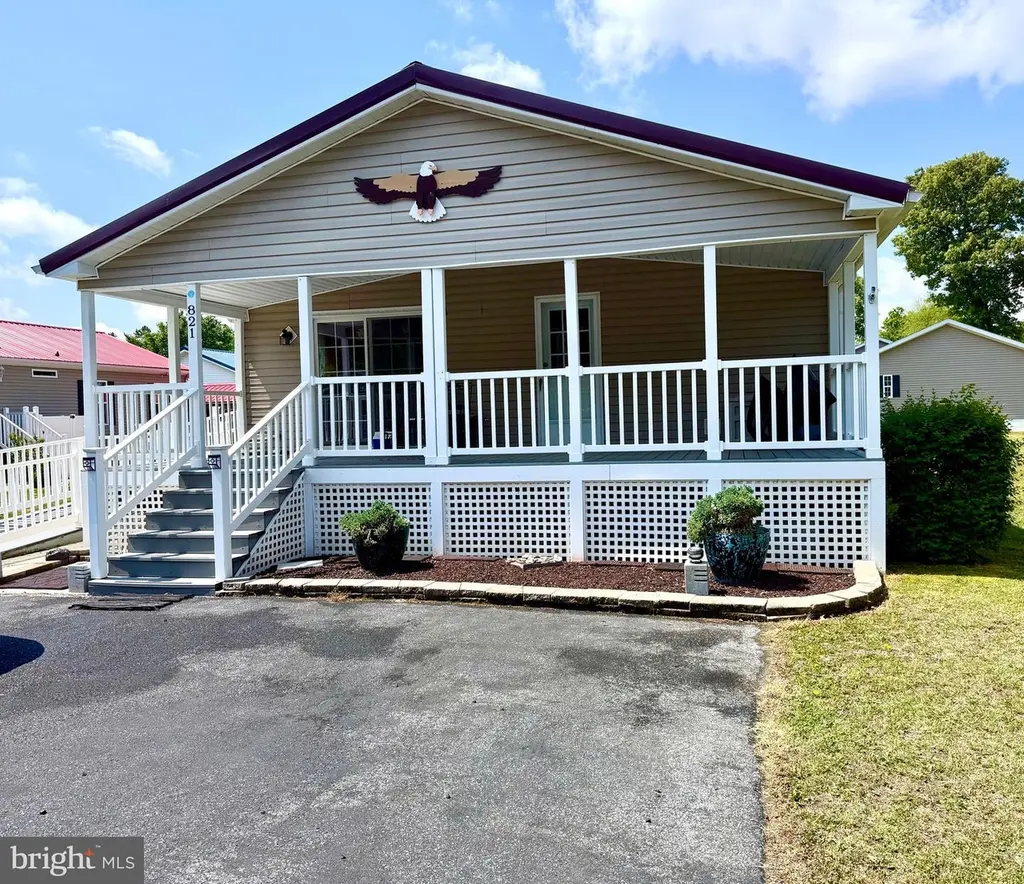
821 Rum Bridge Branch Rd · Seaford, DE
Flood risk 1/10 · Minimal
- FEMA flood zone
- X (unshaded)
- Chance of flooding over 30 yrs
- 0.0%
- Est. flood insurance / yr
- $473 – $860
Fire risk 3/10 · Minor
- Est. fire insurance / yr
- $476 – $884
Heat risk 8/10 · Major
- Hot days now (above 105°F)
- 7 days/yr
- Hot days in 30 yrs
- 16 days/yr
Wind risk 6/10 · Moderate
- Chance of severe wind over 30 yrs
- 71.0%
Air-quality risk 3/10 · Minor
- Unhealthy air days now
- 2 days/yr
- Unhealthy air days in 30 yrs
- 2 days/yr
Risk factors via First Street. Map © Google.
Why this score? — see what drove the C grade
The composite is a weighted blend of 9 inputs, each scored 0–100. Each bar is that input's sub-score; the figure is the points it added to the 100-point composite (weight × sub-score).
- Cash flow +26.6/30.0
- DSCR +9.1/10.0
- 1% rule +7.1/10.0
- ARV discount +3.3/15.0
- Livability +3.2/5.0
- Schools +2.8/10.0
- Rent growth +2.5/5.0
- Condition / age +2.5/5.0
- Appreciation +0.0/10.0
$145,000
🖨 Deal sheet 📄 Offer letter ✓ Due diligence
Listing remarks
$5,000 IN CLOSING COSTS assistance. Welcome to the gated community of Village of Cool Branch! This spacious 3-bedroom, 2-bathroom double wide mobile home offers a modern and comfortable living experience. Key Features: - Stainless Steel Appliances: The kitchen comes equipped with sleek stainless steel appliances, making meal preparation a breeze. - Large Front Porch: Enjoy relaxing evenings on your spacious front porch, perfect for entertaining or unwinding. - Handicap Ramp: The home includes a convenient handicap ramp for easy access. - Storage Shed: There's an outside shed for additional storage, keeping your outdoor space organized. Community Amenities: - In-Ground Pool: Perfect for cool
Key facts
- Community pool
- Built 2006
- Listed 33 days
Property features AI
Finance
- Other: Property manager present; Accessibility with 32"+ wide doors; Pets allowed (cats and dogs OK, breed restrictions apply); Property condition listed as excellent; Finished above-grade area approximately 1,400 (estimated); Annual ground rent listed in income/expense items
- Financial info: Monthly land lease of $492; Ground rent exists; No lease considered
- HOA & community: Outdoor pool; Basketball courts; Gated community; Tot lots/playground; HOA fee $15 annually; Community pool (listed under amenities)
Exterior
- Parking: Driveway
- Utilities: Community water; Community septic tank; Electric hot water; Central A/C powered by electricity; Propane (metered) for heating
- Home design: Manufactured double-wide home; Single-story; East-facing main entrance; Land lease ownership interest
- Construction: Vinyl siding; Metal roof; Building not winterized; Fleetwood make; Model PaFL22AB54144FE13; Approximately 28 ft wide by 50 ft long; Above grade and below grade structures noted; Year built estimated
- Exterior features: Gutter system; Outbuilding(s); Community pool; Ground rent exists
Interior
- Kitchen: Built-in microwave; Dishwasher; Commercial range
- Bedrooms: Three bedrooms on the main level
- Flooring: Partially carpeted; Vinyl flooring
- Bathrooms: Two full bathrooms on the main level; Two full bathrooms total
- Heating & cooling: 90% forced air heating; Propane (metered) heating fuel; Central air conditioning (electric)
- Interior features: Stall shower; Walk-in closets; Paneled walls
Neighborhood map
What this means for you Summary
Snapshot
- This is a 3-bed/2.0-bath manufactured listed at $145k.
Deal economics
- At list price, monthly cash flow is $387 ($5k/yr) — positive.
- The deal already cash-flows at list — no discount required.
- Meets the 1% rule at list price ($2k rent vs $145k).
- Recommended offer: $141k (3.0% below list) — sets the bar for market timing.
- Cap rate 9.5% vs local median 4.4% in Seaford — top-decile yield for the area; either an underpriced asset or a hidden risk that comps aren't pricing in. Stress-test before assuming the spread holds.
Location & tenants
- Location reads 64/100 on livability (#54 in DE) — a middle-class / working-renter tenant base. Strengths: cost of living A+, housing A+, health & safety A+; Watch: schools C-, employment D, crime F.
- Seaford School District (suburban): math 25% / reading 40% proficiency, ranked #15 of 26 in DE (top 58%) — families likely to look elsewhere, expect single-tenant / working-renter base with shorter leases; 65% free/reduced lunch — lower-income household profile, screen leases tightly.
- Market conditions: 215 active listings in the ZIP; 4,354 units permitted in Sussex County in 2024 (344 in 5+ unit buildings).
Forward outlook
- Local home prices are declining (-3.0%/yr); year-one equity from $1k of loan paydown is wiped out by about $4k of value loss. Plan a longer hold.
- Sussex County population projected at +25% by 2050 — long-run rental-demand tailwind backs the buy-and-hold thesis.
- At projected returns (-3.0% appreciation + 3.0% rent growth), your $41k cash investment doubles in ~10 years — after that, you're playing with house money.
Negotiation context
- It's been on market 34 days — a 3% lower offer ($141k) is reasonable based on typical stale-listing flexibility.
Risks & watch-outs
- Climate carrying-cost: major wind risk, 71% chance of damaging wind over 30y; extreme-heat days projected 7→16/yr by 2055 (HVAC capex compounding) — expect insurance premiums to compound above CPI over the hold.
Questions for the listing agent
- It's been on market 34 days. Have you received any prior offers? Is the seller open to a 3% concession, seller financing, or rate buy-down credit?
- What does the HOA fee cover, when was the last increase, and are there any pending special assessments or reserve-fund shortfalls?
- Is there a deadline driving the sale (1031 exchange, divorce, estate, relocation)? That informs how much negotiation room exists.
- Crime grade is F in this area — have there been break-ins, vandalism, or insurance claims at this property in the last 3 years? What carrier currently insures it and at what premium?
- What's the average days-on-market for RENTAL listings here right now (not sales)? A rising rental-DOM trend means longer vacancies and softer asking-rent achievability than the comps imply.
- What's the recent tenant-quality profile in this submarket — average credit score on applications, eviction rate, late-payment / NSF rate, and stable-employment percentage? A property-management company in the area should have these aggregated.
- How much new for-sale + rental construction is in the pipeline within 1–3 miles? Heavy new supply typically softens prices + rents 12–24 months out; constrained supply supports both.
Investment metrics
- 1% rule
- 1.21% ✓
- Cap rate
- 9.49%
- Cash-on-cash
- 11.43%
- DSCR
- 1.51
- GRM
- 6.9
CMA / ARV
- ARV (median comp)
- $132,525
- List price
- $145,000
- Delta
- 9.41%
- Verdict
- FAIR
- Comps
- 20 within 1.0 mi
Projected returns pro-forma
-3.0% appreciation · 3.0% rent growth · sell at horizon
- IRR
- 0.8%
- Equity multiple
- 1.03×
- Total profit
- $1,164
- Equity at exit
- $21,620
- IRR
- 10.4%
- Equity multiple
- 1.81×
- Total profit
- $32,844
- Equity at exit
- $12,537
Cash invested: $40,600 (down + closing). Projections, not guarantees.
Landlord ↔ Tenant lean methodology
- Overall (STATE)
- 70 Landlord-Friendly
- State Delaware
- 70 Landlord-Friendly · D+7
- County
- — inherits STATE
- City
- — inherits STATE
ZIP-level market 19973
- Home prices YoY
- -17.8%
- Active inventory
- 215
- Price-to-rent
- 6.9×
Monthly cashflow live
- Estimated rent
- $1,759 medium interval (Pro) →
- Mortgage (P&I)
- −$760
- Tax est. 1.5%
- −$181 /mo · $2,175/yr
- Insurance
- −$60
- HOA
- −$1
- Vacancy / Maint / Mgmt
- −$369
- Net cashflow
- $387
Break-even live
UW: 25.0% down · 7.5% · 30yr · 1.5% tax · 5.0% vac · 8.0% maint · 8.0% mgmt
Financing live
Cash to close
- Down payment
- $36,250
- Closing costs
- $4,350
- Reserves months
- —
- Total cash needed
- —
Loan-product check · same deal, 3 products live
Conventional
25% down · 7.5% · 30yr
- Down + closing
- —
- Monthly P&I
- —
- Monthly cashflow
- —
- DSCR
- —
- Eligible?
- —
Personal DTI + credit; lowest rate.
DSCR
20% down · 8.5% · 30yr
- Down + closing
- —
- Monthly P&I
- —
- Monthly cashflow
- —
- DSCR
- —
- Eligible?
- —
No personal income docs; deal must DSCR.
Hard money
10% down · 12.0% · 12mo
- Down + closing
- —
- Monthly P&I
- —
- Monthly cashflow
- —
- DSCR
- —
- Eligible?
- —
Short-term bridge; refi at stabilization.
HOA detail
- Monthly dues
- $1 · $12/yr
- Likely covers
- poolsecurity
Listing history 16 events
-
2026-06-18days on market $145,000 Active 34 DOM
-
2026-06-17days on market $145,000 Active 33 DOM
-
2026-06-16pricedays on market $145,000 Active 32 DOM
-
2026-06-15days on market $149,000 Active 31 DOM
-
2026-06-13days on market $149,000 Active 29 DOM
-
2026-06-12days on market $149,000 Active 28 DOM
-
2026-06-09days on market $149,000 Active 25 DOM
-
2026-06-08days on market $149,000 Active 24 DOM
-
2026-06-07days on market $149,000 Active 23 DOM
-
2026-06-04days on market $149,000 Active 19 DOM
-
2026-06-02days on market $149,000 Active 18 DOM
-
2026-06-01days on market $149,000 Active 17 DOM
-
2026-05-31days on market $149,000 Active 16 DOM
-
2026-05-31days on market $149,000 Active 15 DOM
-
2026-05-16$149,000 Active 1129-char remark
-
2026-05-14historical $149,000 1129-char remark
ⓘ Source: listings_history table (triggers on properties + properties_extension) + one-shot
backfill from property_details.listing_events for pre-trigger history.
Climate risk First Street
- Flood 1/10 Low FEMA zone X (unshaded) · 0% chance over 30 yrs
- Wildfire 3/10 Moderate
- Heat 8/10 Severe 7 d/yr ≥105°F today · 16 d/yr by 30 yrs out
- Wind 6/10 Major 71% chance of damaging wind over 30 yrs
- Air quality 3/10 Moderate 2 unhealthy d/yr today · 2 by 30 yrs out
Nearby sold comps map
Loading sold comps map…
Walkable amenities ~0.75 mi
Loading nearby amenities…
Taxation est. · year 1
- Rental income
- $21,111
- − Mortgage interest
- −$8,122
- − Property taxes
- −$2,175
- − Insurance
- −$725
- − Repairs & maintenance
- −$1,689
- − Management
- −$1,689
- − HOA
- −$12
- − Depreciation
- −$4,218
- Taxable income
- $2,481
- Est. tax owed @ 24.0%
- −$595
- After-tax cash flow
- $4,046/yr
For passive investors: Depreciation is non-cash, so a rental often shows a tax loss while cash-flowing — sheltering income. Rental losses are passive: they offset passive income freely, and up to $25,000/yr can offset ordinary (W-2) income if you actively participate and your MAGI is under $100k (phasing out to $0 by $150k); unused losses carry forward. On sale, claimed depreciation is recaptured at up to 25%, and gains may owe capital-gains tax (a 1031 exchange can defer both). Figures are a year-1 estimate at your 24.0% rate — not tax advice; consult a CPA.
Schools (NCES district)
- District
- Seaford School District
- NCES district ID
- 1001530
- Math proficiency
- 25% ▼ -18.00%
- Reading proficiency
- 40% ▼ -12.00%
- Median HH income
- $48,427
- Composite
- 28.07/100
- National rank
- #6835
- State rank
- #15 of 26 in DE
Livability — Seaford
- Score
- 64/100
- State rank
- #54
- US rank
- #14448
Category grades
Schools grade is shown separately in the Schools card above.
Census & demographics
- Population (ZIP)
- 25,786
Population outlook (Sussex County) Hauer SSP2
- Today (2025)
- 248,853 people
- By 2030
- 264,464 · +6.3%
- By 2040
- 290,980 · +16.9%
- By 2050
- 311,259 · +25.1%
- By 2075
- 352,488 · +41.6%
- By 2100
- 367,406 · +47.6%
Race, ethnicity, and origin ACS 2023
- Neighborhood character
- Diverse neighborhood (Simpson 0.61)
- Race & ethnicity
- White 58% Black 20% Two or more races 13% Hispanic / Latino 11%
- Hispanic origin (detail)
- Mexican 5% Puerto Rican 1% Dominican 2%
- Common ancestry
- Hispanic 4% Romanian 3% Italian 2%
- Foreign-born
- 9% · Canada, Vietnam
- Languages at home
- 85% English-only · Spanish 8% French/Haitian/Cajun 5% Vietnamese 1%
Political lean MEDSL · Sussex
- 2024 margin
- R (+11.0) · D 43.9% · R 54.9% · Other 1.2%
- 2008→2024 swing
- -2.4pp toward R · 2008: -8.6pp · 2024: -11.0pp
- All cycles
- 2024: R+11.0 2020: R+11.2 2016: R+22.0 2012: R+13.0 2008: R+8.6
Not yet ingested
- Civics
- —
Market trends
- HPI YoY
- ▼ -62.40%
- Current HPI
- 288.5652
- Rent YoY
- —
- Metro
- —
- State GDP YoY
- —
- F500 in state
- 0
Price history
-2.7% since first listed3 events — show timeline
- 2026-06-16 Price Changed $145,000 BRIGHT MLS
- 2026-05-16 Listed $149,000 BRIGHT MLS
- 2026-05-14 Coming Soon $149,000 BRIGHT MLS
Property tax history
-7.7%/yrLatest (2025): $266 · -23.4% YoY. Source: county tax records.
Cash-flow waterfall
monthlySold comps — $/sqft
last 12 mo · ≤1 miLoading sold comps…