 🏗️ New Construction
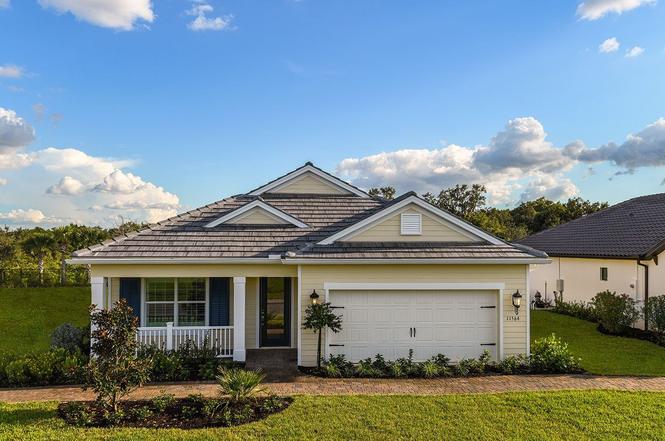
Fresh Spring Plan · Verandah, FL
Flood risk No data
- FEMA flood zone
- —
- Chance of flooding over 30 yrs
- —
- Est. flood insurance / yr
- —
Fire risk No data
- Est. fire insurance / yr
- —
Heat risk No data
- Hot days now (above threshold)
- —
- Hot days in 30 yrs
- —
Wind risk No data
- Chance of severe wind over 30 yrs
- —
Air-quality risk No data
- Unhealthy air days now
- —
- Unhealthy air days in 30 yrs
- —
Risk factors via First Street. Map © Google.
Why this score? — see what drove the F grade
The composite is a weighted blend of 9 inputs, each scored 0–100. Each bar is that input's sub-score; the figure is the points it added to the 100-point composite (weight × sub-score).
- ARV discount +7.5/15.0
- Cash flow +6.2/30.0
- Schools +4.1/10.0
- Livability +2.5/5.0
- Condition / age +2.5/5.0
- Rent growth +1.8/5.0
- 1% rule +1.5/10.0
- DSCR +0.6/10.0
- Appreciation +0.0/10.0
$300,990
🖨 Deal sheet (PDF) 📄 Offer letter ✓ Due diligence
Listing remarks
* Base price does not include the homesite premium or design options. * The three-bedroom Fresh Spring floor plan by Neal Communities features an open main living area with an airy feel. Upon entry, the aroma of a favorite meal greets you in the well-equipped kitchen, featuring an island and walk-in pantry, and opens to the café dining area. After a meal, you can venture into the great room, with views through glass sliding doors to the covered lanai. Revitalize yourself in the master suite featuring a walk-in closet and a master bath with walk-in shower and private water closet. While the leisure room is perfect for an entertainment space, you have the option to make it a den. Othe
Key facts
- Master suite
- Covered lanai
- Great room
Tags
Property features AI
Finance
- Financial info: List price $300,990
Exterior
- Parking: 2-car garage (2 parking spaces total)
- Home design: New construction plan; Single-family plan (Fresh Spring)
- Construction: Living area approximately 1,812; Built as part of 2026 inventory
- Exterior features: Located at 11568 Verandah Palm Ct, Fort Myers FL 33905
Interior
- Kitchen: Kitchen included (plan details)
- Bedrooms: 3 bedrooms
- Bathrooms: 2 full bathrooms
- Interior features: Open living area; Plan model: Fresh Spring
Neighborhood map
What this means for you Summary
Snapshot
- This is a 3-bed/2.0-bath single-family listed at $301k.
Deal economics
- At list price, monthly cash flow is $-927 ($-11k/yr) — negative.
- The deal already cash-flows at list — no discount required.
- Meets the 1% rule at list price ($3k rent vs $301k).
Location & tenants
- Location reads: area grade F — affects rentability + tenant quality, not the cash-flow math above.
- Lee (suburban): math 47% / reading 50% proficiency, ranked #42 of 73 in FL (top 58%) — families likely to look elsewhere, expect single-tenant / working-renter base with shorter leases.
- Market conditions: Rents soft (-3.0%/yr); 763 active listings in the ZIP; 15 comparable units currently listed for rent nearby; rentals at typical pace (median 25d on market — plan ~3-4 weeks tenant-placement turnaround); 15,411 units permitted in Lee County in 2024 (4,686 in 5+ unit buildings).
- At $3,313/mo this rent would consume 55% of the median local household income ($72k/yr) (locally 1358% of renters already pay >50% of income on rent) — very limited rent-growth headroom before tenants either downsize or default.
Forward outlook
- Local home prices are declining (-3.0%/yr); year-one equity from $4k of loan paydown is wiped out by about $15k of value loss. Plan a longer hold.
- Lee County population projected at +44% by 2050 — long-run rental-demand tailwind backs the buy-and-hold thesis.
Negotiation context
- Only 8 days on market — expect competitive offers; lowballing is unlikely to land.
Risks & watch-outs
- Watch-outs: property tax is 2.6% of price.
Questions for the listing agent
- What do current leases actually rent for vs. the listed asking? Can we see a recent rent roll and the last 12 months of T-12 income?
- Property tax is high relative to price — has the assessment been appealed recently, and will the sale trigger a re-assessment?
- Is there a deadline driving the sale (1031 exchange, divorce, estate, relocation)? That informs how much negotiation room exists.
- The area grade is low — what's the realistic commute time and amenity access for the typical tenant pool here? Any planned neighborhood developments (good or bad) we should know about?
- What's the average days-on-market for RENTAL listings here right now (not sales)? A rising rental-DOM trend means longer vacancies and softer asking-rent achievability than the comps imply.
- What's the recent tenant-quality profile in this submarket — average credit score on applications, eviction rate, late-payment / NSF rate, and stable-employment percentage? A property-management company in the area should have these aggregated.
- How much new for-sale + rental construction is in the pipeline within 1–3 miles? Heavy new supply typically softens prices + rents 12–24 months out; constrained supply supports both.
Investment metrics
- 1% rule
- 0.65% ✗
- Cap rate
- 4.12%
- Cash-on-cash
- -7.75%
- DSCR
- 0.66
- GRM
- 12.9
CMA / ARV
- ARV (on-the-fly)
- $512,796
- Comps found
- 1
Show comp detail 1 sale within ~0.75 mi
| Address | Dist | Beds/Ba | Sqft | Sold | Price | $/sf | Match |
|---|---|---|---|---|---|---|---|
| 3300 Shady Bnd | 0.59mi | 3/2.0 | 1,993 (+10%) | 9mo | $565,000 | $283 | 48 |
Match score weights: distance 35% · size 25% · config 20% · recency 20%. Top-matched comps best support the ARV.
Projected returns pro-forma
-3.0% appreciation · 0.0% rent growth · sell at horizon
- IRR
- -33.2%
- Equity multiple
- -0.06×
- Total profit
- $-151,783
- Equity at exit
- $76,460
- IRR
- -62.3%
- Equity multiple
- -0.71×
- Total profit
- $-245,494
- Equity at exit
- $44,337
Cash invested: $143,583 (down + closing). Projections, not guarantees.
Landlord ↔ Tenant lean methodology
- Overall (STATE)
- 87 Strongly Landlord-Friendly
- State Florida
- 87 Strongly Landlord-Friendly · R+3
- County
- — inherits STATE
- City
- — inherits STATE
ZIP-level market 33905
- Home prices YoY
- -31.4%
- Rents YoY
- -3.0%
- Active inventory
- 763
- Price-to-rent
- 7.6×
Monthly cashflow live
- Estimated rent
- $3,313 high interval (Pro) →
- Mortgage (P&I)
- −$2,689
- Tax est. 1.5%
- −$641 /mo · $7,692/yr
- Insurance
- −$214
- HOA
- −$0
- Vacancy / Maint / Mgmt
- −$696
- Net cashflow
- $-927
Break-even live
Sensitivity live
| Price | -10% $-572 | -5% $-750 | +0% $-927 | +5% $-1,104 | +10% $-1,281 |
|---|---|---|---|---|---|
| Rent | -10% $-1,189 | -5% $-1,058 | +0% $-927 | +5% $-796 | +10% $-665 |
| Rate | -1.0pp $-669 | -0.5pp $-796 | base $-927 | +0.5pp $-1,060 | +1.0pp $-1,195 |
UW: 25.0% down · 7.5% · 30yr · 1.5% tax · 5.0% vac · 8.0% maint · 8.0% mgmt
Financing live
Cash to close
- Down payment
- $128,199
- Closing costs
- $15,384
- Reserves months
- —
- Total cash needed
- —
Loan-product check · same deal, 3 products live
Conventional
25% down · 7.5% · 30yr
- Down + closing
- —
- Monthly P&I
- —
- Monthly cashflow
- —
- DSCR
- —
- Eligible?
- —
Personal DTI + credit; lowest rate.
DSCR
20% down · 8.5% · 30yr
- Down + closing
- —
- Monthly P&I
- —
- Monthly cashflow
- —
- DSCR
- —
- Eligible?
- —
No personal income docs; deal must DSCR.
Hard money
10% down · 12.0% · 12mo
- Down + closing
- —
- Monthly P&I
- —
- Monthly cashflow
- —
- DSCR
- —
- Eligible?
- —
Short-term bridge; refi at stabilization.
Rent comps 15 comps
| Address | Beds | Baths | Sqft | Rent | $/sqft | DOM | Units | Dist |
|---|---|---|---|---|---|---|---|---|
| 3100 Cottonwood Bnd #1901 Fort Myers, FL | 3.0 | 2.5 | 1821 | $2,500 | $1.37 | 24d | 1 | 0.06mi |
| 3111 Cottonwood Bnd #1704 Fort Myers, FL | 3.0 | 2.5 | 1833 | $3,000 | $1.64 | 24d | 1 | 0.09mi |
| 3240 Cottonwood Bnd #201 Fort Myers, FL | 3.0 | 2.5 | 1821 | $5,500 | $3.02 | 24d | 1 | 0.14mi |
| 3211 Cottonwood Bnd #701 Fort Myers, FL | 3.0 | 3.0 | 1821 | $2,500 | $1.37 | 24d | 1 | 0.18mi |
| 3211 Cottonwood Bnd #705 Fort Myers, FL | 3.0 | 2.5 | 1867 | $3,000 | $1.61 | 24d | 1 | 0.18mi |
| 3181 Cottonwood Bnd #901 Fort Myers, FL | 3.0 | 2.5 | 1821 | $5,500 | $3.02 | 24d | 1 | 0.19mi |
| 3210 Cottonwood Bnd #803 Fort Myers, FL | 3.0 | 2.5 | 1867 | $5,000 | $2.68 | 4d | 1 | 0.21mi |
| 3111 Meandering Way #101 Fort Myers, FL | 2.0 | 2.0 | 1421 | $2,700 | $1.90 | 24d | 1 | 0.58mi |
| 3120 Meandering Way #202 Fort Myers, FL | 3.0 | 2.0 | 1690 | $3,000 | $1.78 | 24d | 1 | 0.61mi |
| 3071 Meandering Way #101 Fort Myers, FL | 2.0 | 2.0 | 1421 | $3,000 | $2.11 | 24d | 1 | 0.61mi |
| 3131 Orangetree Bnd Fort Myers, FL | 3.0 | 3.0 | 1842 | $7,000 | $3.80 | 24d | 1 | 0.92mi |
| 12639 5th St Fort Myers, FL | 4.0 | 2.0 | 1533 | $1,900 | $1.24 | 24d | 1 | 1.29mi |
| 12937 Fourth St Fort Myers, FL | 2.0 | 1.0 | 1236 | $1,900 | $1.54 | 24d | 1 | 1.43mi |
| 2804 River Ridge Blvd Fort Myers, FL | 2.0 | 2.0 | 1404 | $1,350 | $0.96 | 24d | 1 | 1.44mi |
| 3721 Pebblebrook Ridge Ct #102 Fort Myers, FL | 2.0 | 2.0 | 1532 | $2,950 | $1.93 | 24d | 1 | 1.49mi |
Listing history 5 events
-
2026-06-17days on market $300,990 Active 8 DOM
-
2026-06-16days on market $300,990 Active 7 DOM
-
2026-06-16days on market $300,990 Active 6 DOM
-
2026-06-13remarks 692-char remark
-
2026-06-13$300,990 Active 4 DOM
ⓘ Source: listings_history table (triggers on properties + properties_extension) + one-shot
backfill from property_details.listing_events for pre-trigger history.
Nearby sold comps map
Loading sold comps map…
Walkable amenities ~0.75 mi
Loading nearby amenities…
Taxation est. · year 1
- Rental income
- $39,752
- − Mortgage interest
- −$28,725
- − Property taxes
- −$7,692
- − Insurance
- −$2,564
- − Repairs & maintenance
- −$3,180
- − Management
- −$3,180
- − Depreciation
- −$14,918
- Taxable loss
- −$20,507
- Est. tax savings @ 24.0%
- +$4,922
- After-tax cash flow
- $-6,200/yr
For passive investors: Depreciation is non-cash, so a rental often shows a tax loss while cash-flowing — sheltering income. Rental losses are passive: they offset passive income freely, and up to $25,000/yr can offset ordinary (W-2) income if you actively participate and your MAGI is under $100k (phasing out to $0 by $150k); unused losses carry forward. On sale, claimed depreciation is recaptured at up to 25%, and gains may owe capital-gains tax (a 1031 exchange can defer both). Figures are a year-1 estimate at your 24.0% rate — not tax advice; consult a CPA.
Schools (NCES district)
- District
- Lee
- NCES district ID
- 1201080
- Math proficiency
- 47% ▼ -11.00%
- Reading proficiency
- 50% ▼ -4.00%
- Median HH income
- $49,518
- Composite
- 41.49/100
- National rank
- #3458
- State rank
- #42 of 73 in FL
Livability — Verandah
No livability data for this city. (Only ~50 U.S. cities are tracked.)
Census & demographics
- Census place
- Verandah, FL
- County
- Lee County · 788,662 people
- Metro
- Cape Coral-Fort Myers, FL
- Population (ZIP)
- 41,381
- Household income
- $71,987
- Rent vs Own
- Severe rent burden
- 1358.0
Population outlook (Lee County) Hauer SSP2
- Today (2025)
- 871,946 people
- By 2030
- 955,468 · +9.6%
- By 2040
- 1,113,587 · +27.7%
- By 2050
- 1,256,891 · +44.1%
- By 2075
- 1,560,270 · +78.9%
- By 2100
- 1,726,848 · +98.0%
Race, ethnicity, and origin ACS 2023
- Neighborhood character
- Diverse neighborhood (Simpson 0.59)
- Race & ethnicity
- White 53% Hispanic / Latino 34% Two or more races 17% Black 9% Native American 4% Asian 2%
- Hispanic origin (detail)
- Mexican 11% Puerto Rican 5% Cuban 2%
- Common ancestry
- Romanian 2% Slovak 2% Lithuanian 2%
- Foreign-born
- 20% · Canada, Jamaica
- Languages at home
- 68% English-only · Spanish 29% Other Indo-European 1% German/W. Germanic 1%
Political lean MEDSL · Lee
- 2024 margin
- Strong R (+28.4) · D 35.5% · R 63.9%
- 2008→2024 swing
- -18.0pp toward R · 2008: -10.4pp · 2024: -28.4pp
- All cycles
- 2024: R+28.4 2020: R+19.2 2016: R+20.4 2012: R+16.6 2008: R+10.4
Not yet ingested
- Civics
- —
Market trends
- HPI YoY
- ▼ -122.89%
- Current HPI
- 268.4598
- Rent YoY
- ▼ -2.97%
- Metro
- Cape Coral-Fort Myers, FL
- State GDP YoY
- ▲ 3.28%
- F500 in state
- 36
Industry mix (Fortune 500 HQ in FL)
| Industry | F500 HQs | Revenue |
|---|---|---|
| Industrial Technology | 2 | $29B |
|
||
| Insurance | 2 | $17B |
|
||
| Retail | 1 | $60B |
|
||
| Technology Distribution | 1 | $58B |
|
||
| Homebuilding | 1 | $35B |
|
||
| Technology Manufacturing | 1 | $35B |
|
||
Cash-flow waterfall
monthlySold comps — $/sqft
last 12 mo · ≤1 miLoading sold comps…