4325 Mountain Pass · San Antonio, TX
Flood risk 1/10 · Minimal
- FEMA flood zone
- X (unshaded)
- Chance of flooding over 30 yrs
- 0.0%
- Est. flood insurance / yr
- $507 – $1,088
Fire risk 5/10 · Moderate
- Est. fire insurance / yr
- $1,222 – $2,270
Heat risk 8/10 · Major
- Hot days now (above 108°F)
- 6 days/yr
- Hot days in 30 yrs
- 18 days/yr
Wind risk 8/10 · Major
- Chance of severe wind over 30 yrs
- 80.0%
Air-quality risk 1/10 · Minimal
- Unhealthy air days now
- 0 days/yr
- Unhealthy air days in 30 yrs
- 0 days/yr
Risk factors via First Street. Map © Google.
Why this score? — see what drove the B- grade
The composite is a weighted blend of 9 inputs, each scored 0–100. Each bar is that input's sub-score; the figure is the points it added to the 100-point composite (weight × sub-score).
- Cash flow +27.0/30.0
- DSCR +9.4/10.0
- ARV discount +7.5/15.0
- 1% rule +6.3/10.0
- Appreciation +6.3/10.0
- Livability +4.0/5.0
- Schools +3.4/10.0
- Rent growth +2.5/5.0
- Condition / age +2.5/5.0
$129,500
🖨 Deal sheet 📄 Offer letter ✓ Due diligence
Listing remarks
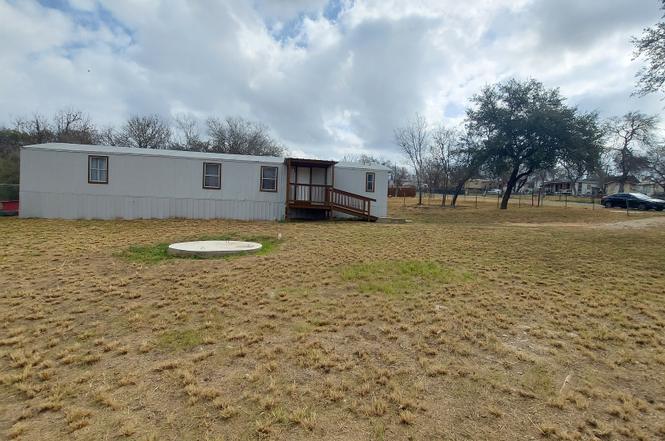
Well maintained 2-bedroom, 2-bath mobile home situated on a spacious 0.26-acre fenced lot in a quiet country setting. This home has been retrofitted to the land, features a metal roof, septic system, and has been well cared for throughout. Enjoy peace and quiet, open space, and a peaceful rural atmosphere while still being within reasonable distance to city conveniences. A great opportunity for comfortable country living at an affordable price.
Key facts
- Metal roof
- Fenced lot
- Septic system
Tags
Property features AI
Finance
- Financial info: Down payment assistance resources available
- HOA & community: Subdivision: Twin Valley Terrace
Exterior
- Utilities: Water: City; Sewer: Septic; Water system present
- Home design: Pre-owned property; Siding exterior; Metal roof
- Construction: Approximately 26 years old; Other type foundation (see remarks)
- Exterior features: Mature trees on the lot; Lot size approximately between 1/4 and 1/2 acre
Interior
- Kitchen: Kitchen approx. 12 x 7; Cooktop included
- Bedrooms: Master bedroom is split from other bedrooms, has a ceiling fan and a full bath; Master bedroom approx. 15 x 12; Second bedroom approx. 10 x 14
- Flooring: Linoleum flooring; Vinyl flooring; Laminate flooring
- Bathrooms: 2 full bathrooms total; Master bath with tub/shower combination and single vanity (approx. 11 x 5)
- Heating & cooling: Central heating (electric); Central air conditioning
- Interior features: Ceiling fans throughout; Washer and dryer connections inside the home; Cooktop; Smoke alarm; Electric water heater; Central distribution plumbing; Carbon monoxide detector; City garbage service; Living and dining room combined; Utility room inside; Ground-level, no steps; Open floor plan; 1 living area
- Laundry & utility: Utility room approx. 6 x 6; Washer and dryer connections inside
Neighborhood map
What this means for you Summary
Snapshot
- This is a 2-bed/2.0-bath manufactured listed at $130k.
Deal economics
- At list price, monthly cash flow is $363 ($4k/yr) — positive.
- The deal already cash-flows at list — no discount required.
- Meets the 1% rule at list price ($1k rent vs $130k).
- Recommended offer: $114k (12.0% below list) — sets the bar for market timing.
- Cap rate 9.7% vs local median 3.8% in San Antonio — top-decile yield for the area; either an underpriced asset or a hidden risk that comps aren't pricing in. Stress-test before assuming the spread holds.
Location & tenants
- Location reads 80/100 on livability (#31 in TX, #1,616 nationally) — a professional / high-income tenant draw. Strengths: amenities A+, commute A+, cost of living A+; Watch: crime F.
- Somerset ISD (rural): math 41% / reading 39% proficiency, ranked #417 of 826 in TX (top 50%) — families likely to look elsewhere, expect single-tenant / working-renter base with shorter leases; 72% free/reduced lunch — lower-income household profile, screen leases tightly.
- Zoned schools: Somerset El (math 60% / reading 48%, grade C, #664 of 4,322 statewide, top 16%, 727 students, 86% FRL); Somerset H S (math 12% / reading 25%, grade F, #1,436 of 1,632 statewide, top 88%, 1,148 students, 86% FRL).
- Market conditions: 324 active listings in the ZIP; 8,308 units permitted in Bexar County in 2024 (2,506 in 5+ unit buildings).
Forward outlook
- In year one you build about $4k of equity ($895 loan paydown + $3k appreciation (2.6% local appreciation)).
- Bexar County population projected at +50% by 2050 — long-run rental-demand tailwind backs the buy-and-hold thesis.
- At projected returns (2.6% appreciation + 3.0% rent growth), your $36k cash investment doubles in ~4 years — after that, you're playing with house money.
- By year 8, paydown + projected appreciation supports a ~$32k cash-out refi (75% LTV) — recoverable capital for the next deal without selling this one.
Negotiation context
- It's been on market 125 days — a 12% lower offer ($114k) is reasonable based on typical stale-listing flexibility.
Risks & watch-outs
- Climate carrying-cost: severe wind risk, 80% chance of damaging wind over 30y; moderate wildfire risk; extreme-heat days projected 6→18/yr by 2055 (HVAC capex compounding) — expect insurance premiums to compound above CPI over the hold.
Questions for the listing agent
- It's been on market 125 days. Have you received any prior offers? Is the seller open to a 12% concession, seller financing, or rate buy-down credit?
- Why hasn't it sold? Are there any deal-killer items the seller is aware of (foundation, flood, title, zoning, code violations)?
- Is there a deadline driving the sale (1031 exchange, divorce, estate, relocation)? That informs how much negotiation room exists.
- Crime grade is F in this area — have there been break-ins, vandalism, or insurance claims at this property in the last 3 years? What carrier currently insures it and at what premium?
- What's the average days-on-market for RENTAL listings here right now (not sales)? A rising rental-DOM trend means longer vacancies and softer asking-rent achievability than the comps imply.
- What's the recent tenant-quality profile in this submarket — average credit score on applications, eviction rate, late-payment / NSF rate, and stable-employment percentage? A property-management company in the area should have these aggregated.
- How much new for-sale + rental construction is in the pipeline within 1–3 miles? Heavy new supply typically softens prices + rents 12–24 months out; constrained supply supports both.
Investment metrics
- 1% rule
- 1.13% ✓
- Cap rate
- 9.66%
- Cash-on-cash
- 12.02%
- DSCR
- 1.54
- GRM
- 7.3
CMA / ARV
No comps found within radius.
Projected returns pro-forma
2.6% appreciation · 3.0% rent growth · sell at horizon
- IRR
- 17.8%
- Equity multiple
- 1.99×
- Total profit
- $35,989
- Equity at exit
- $55,342
- IRR
- 19.5%
- Equity multiple
- 3.73×
- Total profit
- $99,085
- Equity at exit
- $83,109
Cash invested: $36,260 (down + closing). Projections, not guarantees.
Landlord ↔ Tenant lean methodology
- Overall (STATE)
- 87 Strongly Landlord-Friendly
- State Texas
- 87 Strongly Landlord-Friendly · R+5
- County
- — inherits STATE
- City
- — inherits STATE
ZIP-level market 78073
- Home prices YoY
- 0.9%
- Active inventory
- 324
- Price-to-rent
- 7.3×
Monthly cashflow live
- Estimated rent
- $1,469 medium interval (Pro) →
- Mortgage (P&I)
- −$679
- Tax from tax record
- −$64 /mo · $768/yr
- Insurance
- −$54
- HOA
- −$0
- Vacancy / Maint / Mgmt
- −$308
- Net cashflow
- $363
Break-even live
UW: 25.0% down · 7.5% · 30yr · 1.5% tax · 5.0% vac · 8.0% maint · 8.0% mgmt
Financing live
Cash to close
- Down payment
- $32,375
- Closing costs
- $3,885
- Reserves months
- —
- Total cash needed
- —
Loan-product check · same deal, 3 products live
Conventional
25% down · 7.5% · 30yr
- Down + closing
- —
- Monthly P&I
- —
- Monthly cashflow
- —
- DSCR
- —
- Eligible?
- —
Personal DTI + credit; lowest rate.
DSCR
20% down · 8.5% · 30yr
- Down + closing
- —
- Monthly P&I
- —
- Monthly cashflow
- —
- DSCR
- —
- Eligible?
- —
No personal income docs; deal must DSCR.
Hard money
10% down · 12.0% · 12mo
- Down + closing
- —
- Monthly P&I
- —
- Monthly cashflow
- —
- DSCR
- —
- Eligible?
- —
Short-term bridge; refi at stabilization.
Listing history 17 events
-
2026-06-18days on market $129,500 Active 125 DOM
-
2026-06-17days on market $129,500 Active 124 DOM
-
2026-06-16days on market $129,500 Active 123 DOM
-
2026-06-15days on market $129,500 Active 122 DOM
-
2026-06-15days on market $129,500 Active 121 DOM
-
2026-06-13days on market $129,500 Active 120 DOM
-
2026-06-12days on market $129,500 Active 119 DOM
-
2026-06-09days on market $129,500 Active 116 DOM
-
2026-06-08days on market $129,500 Active 115 DOM
-
2026-06-08days on market $129,500 Active 114 DOM
-
2026-06-07days on market $129,500 Active 113 DOM
-
2026-06-03days on market $129,500 Active 110 DOM
-
2026-06-02days on market $129,500 Active 109 DOM
-
2026-06-01statusdays on market $129,500 Active 108 DOM
-
2026-05-31days on market $129,500 Price Change 107 DOM
-
2026-05-22price $129,500
-
2026-02-13$139,500 New
ⓘ Source: listings_history table (triggers on properties + properties_extension) + one-shot
backfill from property_details.listing_events for pre-trigger history.
Tax reassessment forecast TX · Resets to sale price
- Current annual tax
- $768 · $64/mo
- Projected year-2 tax
- $2,370 · $197/mo
- Expected delta
- +$1,601/yr (+$133/mo · 208.4%)
ⓘ Screening estimate from a state-policy table — verify with the county assessor before closing.
Climate risk First Street
- Flood 1/10 Low FEMA zone X (unshaded) · 0% chance over 30 yrs
- Wildfire 5/10 Major
- Heat 8/10 Severe 6 d/yr ≥108°F today · 18 d/yr by 30 yrs out
- Wind 8/10 Severe 80% chance of damaging wind over 30 yrs
- Air quality 1/10 Low 0 unhealthy d/yr today · 0 by 30 yrs out
Nearby sold comps map
Loading sold comps map…
Walkable amenities ~0.75 mi
Loading nearby amenities…
Taxation est. · year 1
- Rental income
- $17,627
- − Mortgage interest
- −$7,254
- − Property taxes
- −$768
- − Insurance
- −$648
- − Repairs & maintenance
- −$1,410
- − Management
- −$1,410
- − Depreciation
- −$3,767
- Taxable income
- $2,369
- Est. tax owed @ 24.0%
- −$569
- After-tax cash flow
- $3,791/yr
For passive investors: Depreciation is non-cash, so a rental often shows a tax loss while cash-flowing — sheltering income. Rental losses are passive: they offset passive income freely, and up to $25,000/yr can offset ordinary (W-2) income if you actively participate and your MAGI is under $100k (phasing out to $0 by $150k); unused losses carry forward. On sale, claimed depreciation is recaptured at up to 25%, and gains may owe capital-gains tax (a 1031 exchange can defer both). Figures are a year-1 estimate at your 24.0% rate — not tax advice; consult a CPA.
Schools (NCES district)
- District
- Somerset ISD
- NCES district ID
- 4840740
- Math proficiency
- 41% ▬ 0.00%
- Reading proficiency
- 39% ▲ 4.00%
- Median HH income
- $44,712
- Composite
- 34.01/100
- National rank
- #5315
- State rank
- #417 of 826 in TX
Livability — San Antonio
- Score
- 80/100
- State rank
- #31
- US rank
- #1616
Category grades
Schools grade is shown separately in the Schools card above.
Census & demographics
- City population
- 1,806,925
- Population (ZIP)
- 9,510
Population outlook (Bexar County) Hauer SSP2
- Today (2025)
- 2,336,851 people
- By 2030
- 2,560,728 · +9.6%
- By 2040
- 3,020,569 · +29.3%
- By 2050
- 3,493,522 · +49.5%
- By 2075
- 4,668,459 · +99.8%
- By 2100
- 5,533,242 · +136.8%
Race, ethnicity, and origin ACS 2023
- Neighborhood character
- Predominantly Hispanic (81%)
- Race & ethnicity
- Hispanic / Latino 81% Two or more races 33% White 16%
- Hispanic origin (detail)
- Mexican 75%
- Foreign-born
- 12% · Canada
- Languages at home
- 51% English-only · Spanish 48% German/W. Germanic 1%
Political lean MEDSL · Bexar
- 2024 margin
- Lean D (+9.8) · D 54.3% · R 44.6% · Other 1.1%
- 2008→2024 swing
- +4.2pp toward D · 2008: 5.6pp · 2024: 9.8pp
- All cycles
- 2024: D+9.8 2020: D+18.2 2016: D+13.5 2012: D+4.6 2008: D+5.6
Not yet ingested
- Civics
- —
Market trends
- HPI YoY
- ▲ 2.60%
- Current HPI
- 289.1266
- Rent YoY
- —
- Metro
- —
- State GDP YoY
- ▲ 3.95%
- F500 in state
- 110
Industry mix (Fortune 500 HQ in TX)
| Industry | F500 HQs | Revenue |
|---|---|---|
| Energy | 16 | $1,198B |
|
||
| Technology | 5 | $198B |
|
||
| Engineering / Construction | 4 | $72B |
|
||
| Energy Services | 3 | $60B |
|
||
| Utilities | 3 | $41B |
|
||
| Healthcare | 2 | $330B |
|
||
Price history
-7.2% since first listed2 events — show timeline
- 2026-05-22 Price Changed $129,500 LERA
- 2026-02-13 Listed $139,500 LERA
Property tax history
-6.4%/yrLatest (2025): $768 · -4.6% YoY. Source: county tax records.
Cash-flow waterfall
monthlySold comps — $/sqft
last 12 mo · ≤1 miLoading sold comps…