3409 Ridgeway Cir · Jonesboro, AR
Flood risk 1/10 · Minimal
- FEMA flood zone
- X
- Chance of flooding over 30 yrs
- 0.0%
- Est. flood insurance / yr
- $507 – $1,088
Fire risk 3/10 · Minor
- Est. fire insurance / yr
- $1,499 – $2,785
Heat risk 6/10 · Moderate
- Hot days now (above 108°F)
- 7 days/yr
- Hot days in 30 yrs
- 21 days/yr
Wind risk 3/10 · Minor
- Chance of severe wind over 30 yrs
- 6.0%
Air-quality risk 2/10 · Minimal
- Unhealthy air days now
- 0 days/yr
- Unhealthy air days in 30 yrs
- 2 days/yr
Risk factors via First Street. Map © Google.
Why this score? — see what drove the D- grade
The composite is a weighted blend of 9 inputs, each scored 0–100. Each bar is that input's sub-score; the figure is the points it added to the 100-point composite (weight × sub-score).
- ARV discount +13.6/15.0
- Cash flow +8.2/30.0
- Schools +5.2/10.0
- Livability +3.2/5.0
- Rent growth +2.7/5.0
- Condition / age +2.5/5.0
- DSCR +2.2/10.0
- 1% rule +1.7/10.0
- Appreciation +0.0/10.0
$289,500
🖨 Deal sheet 📄 Offer letter ✓ Due diligence
Listing remarks MLS
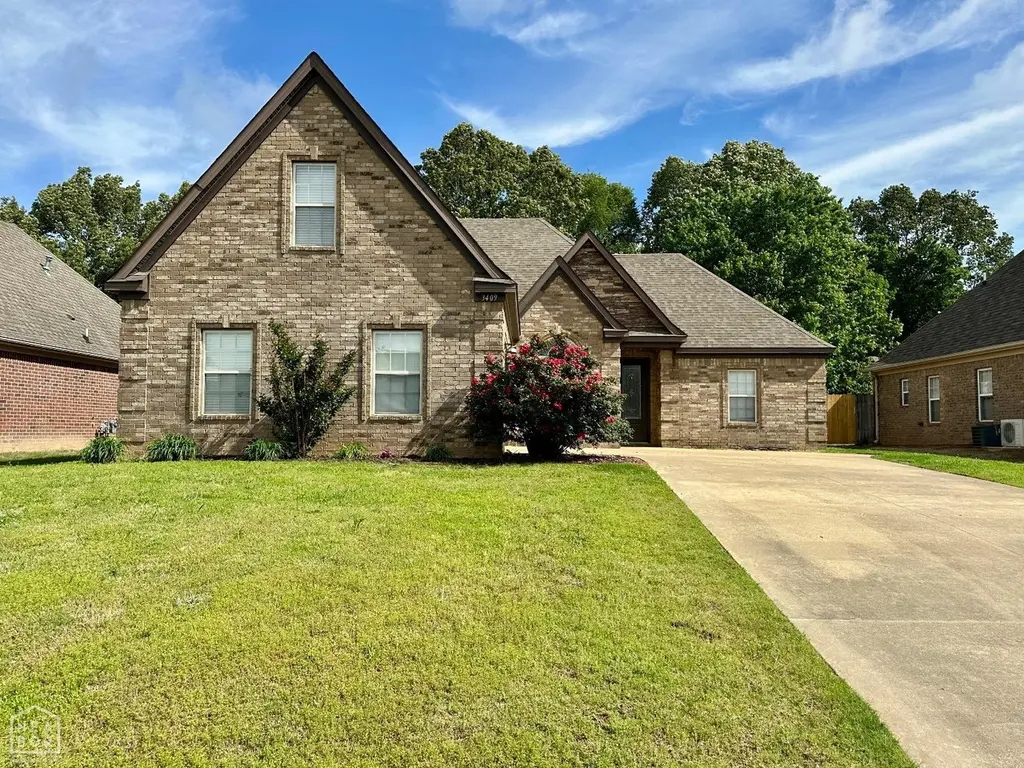
Welcome to this inviting and well-maintained 3 bedroom, 2 bath all-brick and stone home, nestled in a charming and sought-after Valley View neighborhood. The entire main level features fresh, updated paint and many new fixtures, creating a bright and modern feel throughout. Inside, you'll find beautiful hardwood flooring in the main living areas, along with spacious bedrooms and generous closet space. New downstairs carpet just installed March 2026. Upstairs, a versatile flex room offers endless possibilities Use it as a fourth bedroom, home office, playroom, or bonus room to suit your needs. Step outside to enjoy the private patio, perfect for relaxing or entertaining guests with a backyard BBQ. The attached garage provides additional storage and convenient parking. Don't miss your chance to make this move-in ready home yourscall today to schedule your private showing! * Agents see remarks.
Key facts
- Hardwood flooring
- Attached garage
- Private patio
Tags
Neighborhood map
What this means for you Summary
Snapshot
- This is a 4-bed/2.0-bath single-family listed at $290k.
Deal economics
- At list price, monthly cash flow is $-271 ($-3k/yr) — negative.
- To cash-flow at today's rent, offer at most $242k (16.6% below list).
- To meet the 1% rule (rent ≥ 1% of price), the offer needs to be $195k (32.6% below list).
- Recommended offer: $195k (32.6% below list) — sets the bar for 1% rule.
Location & tenants
- Location reads 65/100 on livability (#145 in AR) — a middle-class / working-renter tenant base. Strengths: cost of living A+, housing A+, health & safety A+; Watch: schools D, crime F, amenities F.
- Valley View School District (rural): math 55% / reading 60% proficiency, ranked #4 of 238 in AR (top 2%) — acceptable for families but not a draw, mixed tenant base, ~2y average lease; only 19% free/reduced lunch — higher-income household profile.
- Market conditions: Rents flat; 309 active listings in the ZIP; 4 comparable units currently listed for rent nearby; rentals lingering (median 44d on market — plan ~5-8 weeks vacancy on turnover, expect pricing pressure); 100% of comp listings sitting > 30 days — soft ceiling on asking rent; 926 units permitted in Craighead County in 2024 (69 in 5+ unit buildings).
- This rent runs 33% of the median local income ($70k/yr) — at the standard rent-burdened threshold; future hikes will face affordability resistance.
Forward outlook
- Local home prices are declining (-3.0%/yr); year-one equity from $2k of loan paydown is wiped out by about $9k of value loss. Plan a longer hold.
- Craighead County population projected at +38% by 2050 — long-run rental-demand tailwind backs the buy-and-hold thesis.
Negotiation context
- It's been on market 134 days — a 12% lower offer ($255k) is reasonable based on typical stale-listing flexibility.
- 6 sale attempts since 9y ago with the ask held roughly flat each time — persistent listings suggest the price (not the market) is what's stuck; bring a comps-based counter.
- Current owner paid $235k; 23% above their basis — modest negotiation headroom, anchor on the comps not their cost.
Risks & watch-outs
- Climate carrying-cost: extreme-heat days projected 7→21/yr by 2055 (HVAC capex compounding) — expect insurance premiums to compound above CPI over the hold.
Questions for the listing agent
- What do current leases actually rent for vs. the listed asking? Can we see a recent rent roll and the last 12 months of T-12 income?
- It's been on market 134 days. Have you received any prior offers? Is the seller open to a 33% concession, seller financing, or rate buy-down credit?
- Why hasn't it sold? Are there any deal-killer items the seller is aware of (foundation, flood, title, zoning, code violations)?
- Is there a deadline driving the sale (1031 exchange, divorce, estate, relocation)? That informs how much negotiation room exists.
- Schools are D-rated, which usually means shorter tenancies and higher turnover. Who's the typical renter profile here, and what's been the actual vacancy rate?
- Crime grade is F in this area — have there been break-ins, vandalism, or insurance claims at this property in the last 3 years? What carrier currently insures it and at what premium?
- The area grade is low — what's the realistic commute time and amenity access for the typical tenant pool here? Any planned neighborhood developments (good or bad) we should know about?
- What's the average days-on-market for RENTAL listings here right now (not sales)? A rising rental-DOM trend means longer vacancies and softer asking-rent achievability than the comps imply.
- What's the recent tenant-quality profile in this submarket — average credit score on applications, eviction rate, late-payment / NSF rate, and stable-employment percentage? A property-management company in the area should have these aggregated.
- How much new for-sale + rental construction is in the pipeline within 1–3 miles? Heavy new supply typically softens prices + rents 12–24 months out; constrained supply supports both.
Investment metrics
- 1% rule
- 0.67% ✗
- Cap rate
- 5.17%
- Cash-on-cash
- -4.02%
- DSCR
- 0.82
- GRM
- 12.4
CMA / ARV
- ARV (median comp)
- $334,799
- List price
- $289,500
- Delta
- -13.53%
- Verdict
- UNDERPRICED
- Comps
- 20 within 1.0 mi
Show comp detail 12 sales within ~0.75 mi
| Address | Dist | Beds/Ba | Sqft | Sold | Price | $/sf | Match |
|---|---|---|---|---|---|---|---|
| 3409 Ridgeway Cir | 0.00mi | 4/2.0 | 1,995 (0%) | 1mo | $270,000 | $135 | 100 |
| 5412 Creekview Dr | 0.53mi | 4/2.0 | 1,988 (-0%) | 1mo | $336,130 | $169 | 74 |
| 6236 Merrell Dr | 0.57mi | 4/2.0 | 1,975 (-1%) | 4mo | $312,000 | $158 | 69 |
| 5408 Creekview Dr | 0.52mi | 4/2.0 | 1,912 (-4%) | 1mo | $315,480 | $165 | 68 |
| 3205 Bowden Dr | 0.15mi | 4/2.5 | 2,294 (+15%) | 2mo | $329,900 | $144 | 64 |
| 6239 Alan Dr | 0.66mi | 4/2.0 | 1,948 (-2%) | 3mo | $320,000 | $164 | 63 |
| 3705 Ridgeway Cir | 0.10mi | 3/2.0 (-1) | 1,724 (-14%) | 6mo | $264,900 | $154 | 62 |
| 5197 Julia Cv | 0.52mi | 4/2.5 | 2,135 (+7%) | 3mo | $335,000 | $157 | 60 |
| 3016 Bear Creek Cv | 0.46mi | 3/2.0 (-1) | 2,225 (+12%) | 6mo | $357,650 | $161 | 49 |
| 3004 Bear Creek Cv | 0.48mi | 3/2.0 (-1) | 2,274 (+14%) | 4mo | $363,840 | $160 | 46 |
| 6220 Alan Dr | 0.62mi | 3/2.5 (-1) | 1,695 (-15%) | 1mo | $285,000 | $168 | 38 |
| 6256 Alan Dr | 0.65mi | 5/2.0 (+1) | 2,235 (+12%) | 8mo | $335,000 | $150 | 38 |
Match score weights: distance 35% · size 25% · config 20% · recency 20%. Top-matched comps best support the ARV.
Projected returns pro-forma
-3.0% appreciation · 0.74% rent growth · sell at horizon
- IRR
- -25.4%
- Equity multiple
- 0.15×
- Total profit
- $-68,622
- Equity at exit
- $43,165
- IRR
- -29.4%
- Equity multiple
- -0.23×
- Total profit
- $-99,375
- Equity at exit
- $25,031
Cash invested: $81,060 (down + closing). Projections, not guarantees.
Landlord ↔ Tenant lean methodology
- Overall (STATE)
- 92 Strongly Landlord-Friendly
- State Arkansas
- 92 Strongly Landlord-Friendly · R+14
- County
- — inherits STATE
- City
- — inherits STATE
ZIP-level market 72404
- Home prices YoY
- -14.5%
- Rents YoY
- 0.7%
- Active inventory
- 309
- Price-to-rent
- 12.4×
Monthly cashflow live
- Estimated rent
- $1,951 medium interval (Pro) →
- Mortgage (P&I)
- −$1,518
- Tax from tax record
- −$174 /mo · $2,083/yr
- Insurance
- −$121
- HOA
- −$0
- Vacancy / Maint / Mgmt
- −$410
- Net cashflow
- $-271
Break-even live
UW: 25.0% down · 7.5% · 30yr · 1.5% tax · 5.0% vac · 8.0% maint · 8.0% mgmt
Financing live
Cash to close
- Down payment
- $72,375
- Closing costs
- $8,685
- Reserves months
- —
- Total cash needed
- —
Loan-product check · same deal, 3 products live
Conventional
25% down · 7.5% · 30yr
- Down + closing
- —
- Monthly P&I
- —
- Monthly cashflow
- —
- DSCR
- —
- Eligible?
- —
Personal DTI + credit; lowest rate.
DSCR
20% down · 8.5% · 30yr
- Down + closing
- —
- Monthly P&I
- —
- Monthly cashflow
- —
- DSCR
- —
- Eligible?
- —
No personal income docs; deal must DSCR.
Hard money
10% down · 12.0% · 12mo
- Down + closing
- —
- Monthly P&I
- —
- Monthly cashflow
- —
- DSCR
- —
- Eligible?
- —
Short-term bridge; refi at stabilization.
Rent comps 4 comps
| Address | Beds | Baths | Sqft | Rent | $/sqft | DOM | Units | Dist |
|---|---|---|---|---|---|---|---|---|
| 3632 Leafy Pass Jonesboro, AR | 3.0 | 2.0 | 1662 | $1,750 | $1.05 | 43d | 1 | 0.83mi |
| 5242 Orchard Pass Jonesboro, AR | 4.0 | 1.0 | 1500 | $1,700 | $1.13 | 43d | 1 | 0.94mi |
| 5707 Pope St Jonesboro, AR | 4.0 | 2.0 | 1459 | $1,750 | $1.20 | 43d | 1 | 1.26mi |
| 5303 Southwest Dr Jonesboro, AR | 3.0 | 2.5 | 2064 | $2,000 | $0.97 | 43d | 1 | 1.39mi |
Listing history 24 events
-
2026-06-02days on market $289,500 Active 134 DOM
-
2026-06-01days on market $289,500 Active 133 DOM
-
2026-05-31days on market $289,500 Active 132 DOM
-
2026-05-30days on market $289,500 Active 131 DOM
-
2026-01-19$289,500 Active 905-char remark
Show marketing remark (905 chars)
Welcome to this inviting and well-maintained 3 bedroom, 2 bath all-brick and stone home, nestled in a charming and sought-after Valley View neighborhood. The entire main level features fresh, updated paint and many new fixtures, creating a bright and modern feel throughout. Inside, you'll find beautiful hardwood flooring in the main living areas, along with spacious bedrooms and generous closet space. New downstairs carpet just installed March 2026. Upstairs, a versatile flex room offers endless possibilities Use it as a fourth bedroom, home office, playroom, or bonus room to suit your needs. Step outside to enjoy the private patio, perfect for relaxing or entertaining guests with a backyard BBQ. The attached garage provides additional storage and convenient parking. Don't miss your chance to make this move-in ready home yourscall today to schedule your private showing! * Agents see remarks.
-
2025-10-05price $289,500
-
2025-05-01$299,500 Active
-
2024-05-24soldstatus $235,000 Closed
-
2024-05-24soldstatus $235,000
-
2024-05-23soldstatus $235,000
-
2024-04-17historical Active Under Contract
-
2024-04-11price $252,000
-
2024-04-01$257,000 Active
-
2024-04-01$257,000
-
2018-03-27soldstatus $185,000
-
2018-03-26soldstatus $185,000
-
2018-03-26soldstatus $185,000
-
2017-12-06$189,800
-
2017-12-06$189,800
-
2014-07-28soldstatus $190,000
-
2011-11-16soldstatus $186,500
-
2011-03-11soldstatus $141,000
-
2011-03-11soldstatus $141,000
-
2003-02-04soldstatus $471,000
ⓘ Source: listings_history table (triggers on properties + properties_extension) + one-shot
backfill from property_details.listing_events for pre-trigger history.
Tax reassessment forecast AR · Resets to sale price
- Current annual tax
- $2,083 · $174/mo
- Projected year-2 tax
- $2,083 · $174/mo
- Expected delta
- $0/yr ($0/mo · 0.0%)
ⓘ Screening estimate from a state-policy table — verify with the county assessor before closing.
Climate risk First Street
- Flood 1/10 Low FEMA zone X · 0% chance over 30 yrs
- Wildfire 3/10 Moderate
- Heat 6/10 Major 7 d/yr ≥108°F today · 21 d/yr by 30 yrs out
- Wind 3/10 Moderate 6% chance of damaging wind over 30 yrs
- Air quality 2/10 Low 0 unhealthy d/yr today · 2 by 30 yrs out
Nearby sold comps map
Loading sold comps map…
Walkable amenities ~0.75 mi
Loading nearby amenities…
Taxation est. · year 1
- Rental income
- $23,407
- − Mortgage interest
- −$16,217
- − Property taxes
- −$2,083
- − Insurance
- −$1,448
- − Repairs & maintenance
- −$1,873
- − Management
- −$1,873
- − Depreciation
- −$8,422
- Taxable loss
- −$8,507
- Est. tax savings @ 24.0%
- +$2,042
- After-tax cash flow
- $-1,215/yr
For passive investors: Depreciation is non-cash, so a rental often shows a tax loss while cash-flowing — sheltering income. Rental losses are passive: they offset passive income freely, and up to $25,000/yr can offset ordinary (W-2) income if you actively participate and your MAGI is under $100k (phasing out to $0 by $150k); unused losses carry forward. On sale, claimed depreciation is recaptured at up to 25%, and gains may owe capital-gains tax (a 1031 exchange can defer both). Figures are a year-1 estimate at your 24.0% rate — not tax advice; consult a CPA.
Schools (NCES district)
- District
- Valley View School District
- NCES district ID
- 0513380
- Math proficiency
- 55% ▼ -11.00%
- Reading proficiency
- 60% ▼ -10.00%
- Median HH income
- $79,148
- Composite
- 51.78/100
- National rank
- #1672
- State rank
- #4 of 238 in AR
Livability — Jonesboro
- Score
- 65/100
- State rank
- #145
- US rank
- #12692
Category grades
Schools grade is shown separately in the Schools card above.
Census & demographics
- Census place
- Jonesboro, AR
- County
- Craighead County · 97,185 people
- City population
- 91,245
- Metro
- Jonesboro, AR
- Population (ZIP)
- 29,968
- Household income
- $70,269
- Rent vs Own
- Severe rent burden
- 869.0
Population outlook (Craighead County) Hauer SSP2
- Today (2025)
- 122,235 people
- By 2030
- 131,338 · +7.4%
- By 2040
- 149,862 · +22.6%
- By 2050
- 168,034 · +37.5%
- By 2075
- 208,094 · +70.2%
- By 2100
- 233,251 · +90.8%
Race, ethnicity, and origin ACS 2023
- Neighborhood character
- Predominantly White (72%)
- Race & ethnicity
- White 72% Black 18% Two or more races 5% Hispanic / Latino 4% Asian 2%
- Common ancestry
- Slovak 3% Lithuanian 1% Italian 1%
- Foreign-born
- 5% · Canada, China, South Korea
- Languages at home
- 95% English-only · Spanish 3% Chinese 1%
Political lean MEDSL · Craighead
- 2024 margin
- Solid R (+37.4) · D 30.1% · R 67.5% · Other 2.4%
- 2008→2024 swing
- -12.9pp toward R · 2008: -24.5pp · 2024: -37.4pp
- All cycles
- 2024: R+37.4 2020: R+35.4 2016: R+35.2 2012: R+31.1 2008: R+24.5
Not yet ingested
- Civics
- —
Market trends
- HPI YoY
- ▼ -35.22%
- Current HPI
- 208.3772
- Rent YoY
- ▲ 0.74%
- Metro
- Jonesboro, AR
- State GDP YoY
- ▲ 3.80%
- F500 in state
- 10
Industry mix (Fortune 500 HQ in AR)
| Industry | F500 HQs | Revenue |
|---|---|---|
| Retail | 1 | $681B |
|
||
| Food / Agriculture | 1 | $53B |
|
||
| Retail / Energy | 1 | $22B |
|
||
| Transportation / Logistics | 1 | $12B |
|
||
| Energy | 1 | $4B |
|
||
Price history
-38.5% since first listed20 events — show timeline
- 2026-01-19 Listed $289,500 NEABOR MLS
- 2025-10-05 Price Changed $289,500 NEABOR MLS
- 2025-05-01 Listed $299,500 NEABOR MLS
- 2024-05-24 Sold (MLS) $235,000 CARMLS
- 2024-05-24 Sold (MLS) $235,000 NEABOR MLS
- 2024-05-23 Sold (Public Records) $235,000 Public Records
- 2024-04-17 Contingent — NEABOR MLS
- 2024-04-11 Price Changed $252,000 NEABOR MLS
- 2024-04-01 Listed $257,000 CARMLS
- 2024-04-01 Listed $257,000 NEABOR MLS
- 2018-03-27 Sold (Public Records) $185,000 Public Records
- 2018-03-26 Sold (MLS) $185,000 NEABOR MLS
- 2018-03-26 Sold (MLS) $185,000 CARMLS
- 2017-12-06 Listed $189,800 NEABOR MLS
- 2017-12-06 Listed $189,800 CARMLS
- 2014-07-28 Sold (Public Records) $190,000 Public Records
- 2011-11-16 Sold (Public Records) $186,500 Public Records
- 2011-03-11 Sold (Public Records) $141,000 Public Records
- 2011-03-11 Sold (Public Records) $141,000 Public Records
- 2003-02-04 Sold (Public Records) $471,000 Public Records
Property tax history
+3.4%/yrLatest (2025): $2,083 · +0.0% YoY. Source: county tax records.
Cash-flow waterfall
monthlySold comps — $/sqft
last 12 mo · ≤1 miLoading sold comps…