 🏗️ New Construction
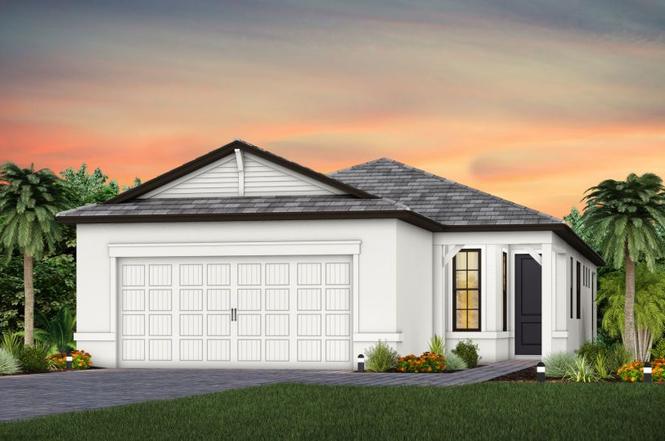
Flagstone Plan · Estero, FL
Flood risk 1/10 · Minimal
- FEMA flood zone
- X (unshaded)
- Chance of flooding over 30 yrs
- 0.0%
- Est. flood insurance / yr
- $507 – $1,088
Fire risk 7/10 · Major
- Est. fire insurance / yr
- $947 – $1,759
Heat risk 9/10 · Severe
- Hot days now (above 107°F)
- 7 days/yr
- Hot days in 30 yrs
- 29 days/yr
Wind risk 10/10 · Severe
- Chance of severe wind over 30 yrs
- 99.0%
Air-quality risk 2/10 · Minimal
- Unhealthy air days now
- 1 days/yr
- Unhealthy air days in 30 yrs
- 1 days/yr
Risk factors via First Street. Map © Google.
Why this score? — see what drove the C+ grade
The composite is a weighted blend of 9 inputs, each scored 0–100. Each bar is that input's sub-score; the figure is the points it added to the 100-point composite (weight × sub-score).
- Cash flow +26.4/30.0
- DSCR +9.0/10.0
- ARV discount +7.5/15.0
- 1% rule +7.1/10.0
- Schools +4.1/10.0
- Livability +4.0/5.0
- Condition / age +2.5/5.0
- Rent growth +2.1/5.0
- Appreciation +0.0/10.0
$399,990
🖨 Deal sheet 📄 Offer letter ✓ Due diligence
Listing remarks
Bright, open, and inviting, the Flagstone features a welcoming foyer with an adjacent flex room or den, leading into a spacious gathering room. The kitchen is thoughtfully placed at the back of the home, connecting to dining and outdoor living areas. A private owner's suite with a walk-in closet completes this smartly designed single-story plan.
Key facts
- Outdoor living areas
- Gathering room
- Walk-in closet
Tags
Property features AI
Finance
- Other: List price $399,990; Address: Estero, FL 33928
Exterior
- Parking: 2 total parking spaces; 2-car garage
- Home design: New construction plan; Model/plan: Flagstone
- Exterior features: Living area of 1518 (plan)
Interior
- Bedrooms: 2 bedrooms
- Bathrooms: 2 full bathrooms
- Interior features: Open living area (plan); Plan name: Flagstone
Neighborhood map
What this means for you Summary
Snapshot
- This is a 2-bed/2.0-bath single-family listed at $400k.
Deal economics
- At list price, monthly cash flow is $1k ($14k/yr) — positive.
- The deal already cash-flows at list — no discount required.
- Meets the 1% rule at list price ($5k rent vs $400k).
- Recommended offer: $352k (12.0% below list) — sets the bar for market timing.
- Cap rate 9.4% vs local median 3.4% in Estero — top-decile yield for the area; either an underpriced asset or a hidden risk that comps aren't pricing in. Stress-test before assuming the spread holds.
Location & tenants
- Location reads 79/100 on livability (#149 in FL, #2,242 nationally) — a middle-class / working-renter tenant base. Strengths: crime A+, employment A+, housing A+; Watch: amenities F, commute F, cost of living D-.
- Lee (suburban): math 47% / reading 50% proficiency, ranked #42 of 73 in FL (top 58%) — families likely to look elsewhere, expect single-tenant / working-renter base with shorter leases.
- Market conditions: Rents soft (-1.4%/yr); 668 active listings in the ZIP; 17 comparable units currently listed for rent nearby; rentals at typical pace (median 24d on market — plan ~3-4 weeks tenant-placement turnaround); solid renter incomes; 15,411 units permitted in Lee County in 2024 (4,686 in 5+ unit buildings).
- At $5,405/mo this rent would consume 63% of the median local household income ($103k/yr) (locally 606% of renters already pay >50% of income on rent) — very limited rent-growth headroom before tenants either downsize or default.
Forward outlook
- Local home prices are declining (-3.0%/yr); year-one equity from $3k of loan paydown is wiped out by about $13k of value loss. Plan a longer hold.
- Lee County population projected at +44% by 2050 — long-run rental-demand tailwind backs the buy-and-hold thesis.
Negotiation context
- It's been on market 130 days — a 12% lower offer ($352k) is reasonable based on typical stale-listing flexibility.
Risks & watch-outs
- Climate carrying-cost: severe wind risk, 99% chance of damaging wind over 30y; major wildfire risk; extreme-heat days projected 7→29/yr by 2055 (HVAC capex compounding) — expect insurance premiums to compound above CPI over the hold.
Questions for the listing agent
- It's been on market 130 days. Have you received any prior offers? Is the seller open to a 12% concession, seller financing, or rate buy-down credit?
- Why hasn't it sold? Are there any deal-killer items the seller is aware of (foundation, flood, title, zoning, code violations)?
- Is there a deadline driving the sale (1031 exchange, divorce, estate, relocation)? That informs how much negotiation room exists.
- Schools are A-rated — typically a magnet for longer-tenancy family renters. What's the average tenant stay here, and is there a school-zone premium baked into asking?
- What's the average days-on-market for RENTAL listings here right now (not sales)? A rising rental-DOM trend means longer vacancies and softer asking-rent achievability than the comps imply.
- What's the recent tenant-quality profile in this submarket — average credit score on applications, eviction rate, late-payment / NSF rate, and stable-employment percentage? A property-management company in the area should have these aggregated.
- How much new for-sale + rental construction is in the pipeline within 1–3 miles? Heavy new supply typically softens prices + rents 12–24 months out; constrained supply supports both.
Investment metrics
- 1% rule
- 1.21% ✓
- Cap rate
- 9.44%
- Cash-on-cash
- 11.25%
- DSCR
- 1.50
- GRM
- 6.9
CMA / ARV
- ARV (on-the-fly)
- $447,810
- Comps found
- 6
Show comp detail 6 sales within ~0.75 mi
| Address | Dist | Beds/Ba | Sqft | Sold | Price | $/sf | Match |
|---|---|---|---|---|---|---|---|
| 20590 Pebble Glen Dr | 0.59mi | 2/2.0 | 1,405 (-7%) | 3mo | $437,000 | $311 | 58 |
| 20506 Pebble Glen Dr | 0.41mi | 2/2.0 | 1,405 (-7%) | 14mo | $415,000 | $295 | 57 |
| 20564 Pebble Glen Dr | 0.55mi | 2/2.0 | 1,405 (-7%) | 8mo | $440,000 | $313 | 56 |
| 18297 Ridgeline Dr | 0.38mi | 3/2.0 (+1) | 1,677 (+10%) | 9mo | $445,000 | $265 | 52 |
| 19528 Hinkley Dr | 0.62mi | 3/2.0 (+1) | 1,564 (+3%) | 14mo | $350,000 | $224 | 50 |
| 20604 Pebble Glen Dr | 0.61mi | 3/2.0 (+1) | 1,655 (+9%) | 19mo | $439,735 | $266 | 36 |
Match score weights: distance 35% · size 25% · config 20% · recency 20%. Top-matched comps best support the ARV.
Projected returns pro-forma
-3.0% appreciation · 0.0% rent growth · sell at horizon
- IRR
- -3.0%
- Equity multiple
- 0.89×
- Total profit
- $-13,482
- Equity at exit
- $66,770
- IRR
- 3.0%
- Equity multiple
- 1.19×
- Total profit
- $23,748
- Equity at exit
- $38,718
Cash invested: $125,387 (down + closing). Projections, not guarantees.
Landlord ↔ Tenant lean methodology
- Overall (STATE)
- 87 Strongly Landlord-Friendly
- State Florida
- 87 Strongly Landlord-Friendly · R+3
- County
- — inherits STATE
- City
- — inherits STATE
ZIP-level market 33928
- Rents YoY
- -1.4%
- Active inventory
- 668
- Price-to-rent
- 6.2×
Monthly cashflow live
- Estimated rent
- $5,405 high interval (Pro) →
- Mortgage (P&I)
- −$2,348
- Tax est. 1.5%
- −$560 /mo · $6,717/yr
- Insurance
- −$187
- HOA
- −$0
- Vacancy / Maint / Mgmt
- −$1,135
- Net cashflow
- $1,175
Break-even live
UW: 25.0% down · 7.5% · 30yr · 1.5% tax · 5.0% vac · 8.0% maint · 8.0% mgmt
Financing live
Cash to close
- Down payment
- $111,952
- Closing costs
- $13,434
- Reserves months
- —
- Total cash needed
- —
Loan-product check · same deal, 3 products live
Conventional
25% down · 7.5% · 30yr
- Down + closing
- —
- Monthly P&I
- —
- Monthly cashflow
- —
- DSCR
- —
- Eligible?
- —
Personal DTI + credit; lowest rate.
DSCR
20% down · 8.5% · 30yr
- Down + closing
- —
- Monthly P&I
- —
- Monthly cashflow
- —
- DSCR
- —
- Eligible?
- —
No personal income docs; deal must DSCR.
Hard money
10% down · 12.0% · 12mo
- Down + closing
- —
- Monthly P&I
- —
- Monthly cashflow
- —
- DSCR
- —
- Eligible?
- —
Short-term bridge; refi at stabilization.
Rent comps 17 comps
| Address | Beds | Baths | Sqft | Rent | $/sqft | DOM | Units | Dist |
|---|---|---|---|---|---|---|---|---|
| 20419 Pebble Glen Dr Estero, FL | 3.0 | 2.0 | 2088 | $6,490 | $3.11 | 24d | 1 | 0.20mi |
| 20285 Napa Loop Estero, FL | 3.0 | 3.0 | 2133 | $6,200 | $2.91 | 24d | 1 | 0.29mi |
| 20047 Napa Loop Estero, FL | 3.0 | 3.0 | 2202 | $9,000 | $4.09 | 3d | 1 | 0.32mi |
| 19278 Hinkley Dr Estero, FL | 3.0 | 3.0 | 2201 | $3,395 | $1.54 | 3d | 1 | 0.33mi |
| 20015 Napa Loop Estero, FL | 3.0 | 3.0 | 2202 | $8,000 | $3.63 | 24d | 1 | 0.39mi |
| 18315 Ridgeline Dr Estero, FL | 3.0 | 3.0 | 2202 | $3,750 | $1.70 | 16d | 1 | 0.40mi |
| 18282 Parksville Dr Estero, FL | 3.0 | 3.0 | 2126 | $10,000 | $4.70 | 24d | 1 | 0.41mi |
| 20024 Hartford Blvd Estero, FL | 3.0 | 2.0 | 2081 | $6,950 | $3.34 | 24d | 1 | 0.42mi |
| 20514 Pebble Glen Dr Estero, FL | 2.0 | 2.0 | 1670 | $5,700 | $3.41 | 24d | 1 | 0.46mi |
| 19218 Hinkley Dr Estero, FL | 3.0 | 2.0 | 1655 | $3,000 | $1.81 | 14d | 1 | 0.48mi |
| 20530 Pebble Glen Dr Estero, FL | 3.0 | 3.0 | 2099 | $5,950 | $2.83 | 24d | 1 | 0.50mi |
| 19232 Gentry Pl Estero, FL | 3.0 | 3.0 | 2202 | $3,800 | $1.73 | 24d | 1 | 0.86mi |
| 19712 Deming Ln Estero, FL | 3.0 | 3.0 | 2091 | $8,500 | $4.07 | 21d | 1 | 0.98mi |
| 19565 Deming Ln Estero, FL | 3.0 | 3.0 | 1852 | $3,800 | $2.05 | 24d | 1 | 1.19mi |
| 19563 Utopia Ln Estero, FL | 3.0 | 2.0 | 2010 | $5,995 | $2.98 | 24d | 1 | 1.25mi |
| 19527 Utopia Ln Estero, FL | 3.0 | 3.0 | 1852 | $4,000 | $2.16 | 24d | 1 | 1.33mi |
| 19824 Beechcrest Pl Estero, FL | 3.0 | 3.0 | 2202 | $7,000 | $3.18 | 24d | 1 | 1.49mi |
Listing history 8 events
-
2026-06-17days on market $399,990 Active 130 DOM
-
2026-06-16days on market $399,990 Active 129 DOM
-
2026-06-16days on market $399,990 Active 128 DOM
-
2026-06-13days on market $399,990 Active 126 DOM
-
2026-06-09days on market $399,990 Active 122 DOM
-
2026-06-07days on market $399,990 Active 120 DOM
-
2026-06-01days on market $399,990 Active 114 DOM
-
2026-06-01days on market $399,990 Active 113 DOM
ⓘ Source: listings_history table (triggers on properties + properties_extension) + one-shot
backfill from property_details.listing_events for pre-trigger history.
Climate risk First Street
- Flood 1/10 Low FEMA zone X (unshaded) · 0% chance over 30 yrs
- Wildfire 7/10 Severe
- Heat 9/10 Extreme 7 d/yr ≥107°F today · 29 d/yr by 30 yrs out
- Wind 10/10 Extreme 99% chance of damaging wind over 30 yrs
- Air quality 2/10 Low 1 unhealthy d/yr today · 1 by 30 yrs out
Nearby sold comps map
Loading sold comps map…
Walkable amenities ~0.75 mi
Loading nearby amenities…
Taxation est. · year 1
- Rental income
- $64,857
- − Mortgage interest
- −$25,084
- − Property taxes
- −$6,717
- − Insurance
- −$2,239
- − Repairs & maintenance
- −$5,189
- − Management
- −$5,189
- − Depreciation
- −$13,027
- Taxable income
- $7,412
- Est. tax owed @ 24.0%
- −$1,779
- After-tax cash flow
- $12,322/yr
For passive investors: Depreciation is non-cash, so a rental often shows a tax loss while cash-flowing — sheltering income. Rental losses are passive: they offset passive income freely, and up to $25,000/yr can offset ordinary (W-2) income if you actively participate and your MAGI is under $100k (phasing out to $0 by $150k); unused losses carry forward. On sale, claimed depreciation is recaptured at up to 25%, and gains may owe capital-gains tax (a 1031 exchange can defer both). Figures are a year-1 estimate at your 24.0% rate — not tax advice; consult a CPA.
Schools (NCES district)
- District
- Lee
- NCES district ID
- 1201080
- Math proficiency
- 47% ▼ -11.00%
- Reading proficiency
- 50% ▼ -4.00%
- Median HH income
- $49,518
- Composite
- 41.49/100
- National rank
- #3458
- State rank
- #42 of 73 in FL
Livability — Estero
- Score
- 79/100
- State rank
- #149
- US rank
- #2242
Category grades
Schools grade is shown separately in the Schools card above.
Census & demographics
- County
- Lee County · 788,662 people
- City population
- 31,926
- Metro
- Cape Coral-Fort Myers, FL
- Population (ZIP)
- 31,926
- Household income
- $102,624
- Rent vs Own
- Severe rent burden
- 606.0
Population outlook (Lee County) Hauer SSP2
- Today (2025)
- 871,946 people
- By 2030
- 955,468 · +9.6%
- By 2040
- 1,113,587 · +27.7%
- By 2050
- 1,256,891 · +44.1%
- By 2075
- 1,560,270 · +78.9%
- By 2100
- 1,726,848 · +98.0%
Race, ethnicity, and origin ACS 2023
- Neighborhood character
- Predominantly White (85%)
- Race & ethnicity
- White 85% Hispanic / Latino 8% Two or more races 7% Asian 3% Black 1%
- Hispanic origin (detail)
- Mexican 2% Puerto Rican 2% Cuban 1%
- Common ancestry
- Romanian 5% Lithuanian 3% Slovak 2%
- Foreign-born
- 11% · Canada, China, Jamaica
- Languages at home
- 90% English-only · Spanish 5% Other Indo-European 1% French/Haitian/Cajun 1%
Political lean MEDSL · Lee
- 2024 margin
- Strong R (+28.4) · D 35.5% · R 63.9%
- 2008→2024 swing
- -18.0pp toward R · 2008: -10.4pp · 2024: -28.4pp
- All cycles
- 2024: R+28.4 2020: R+19.2 2016: R+20.4 2012: R+16.6 2008: R+10.4
Not yet ingested
- Civics
- —
Market trends
- HPI YoY
- ▼ -109.49%
- Current HPI
- 197.5913
- Rent YoY
- ▼ -1.42%
- Metro
- Cape Coral-Fort Myers, FL
- State GDP YoY
- ▲ 3.28%
- F500 in state
- 36
Industry mix (Fortune 500 HQ in FL)
| Industry | F500 HQs | Revenue |
|---|---|---|
| Industrial Technology | 2 | $29B |
|
||
| Insurance | 2 | $17B |
|
||
| Retail | 1 | $60B |
|
||
| Technology Distribution | 1 | $58B |
|
||
| Homebuilding | 1 | $35B |
|
||
| Technology Manufacturing | 1 | $35B |
|
||
Cash-flow waterfall
monthlySold comps — $/sqft
last 12 mo · ≤1 miLoading sold comps…