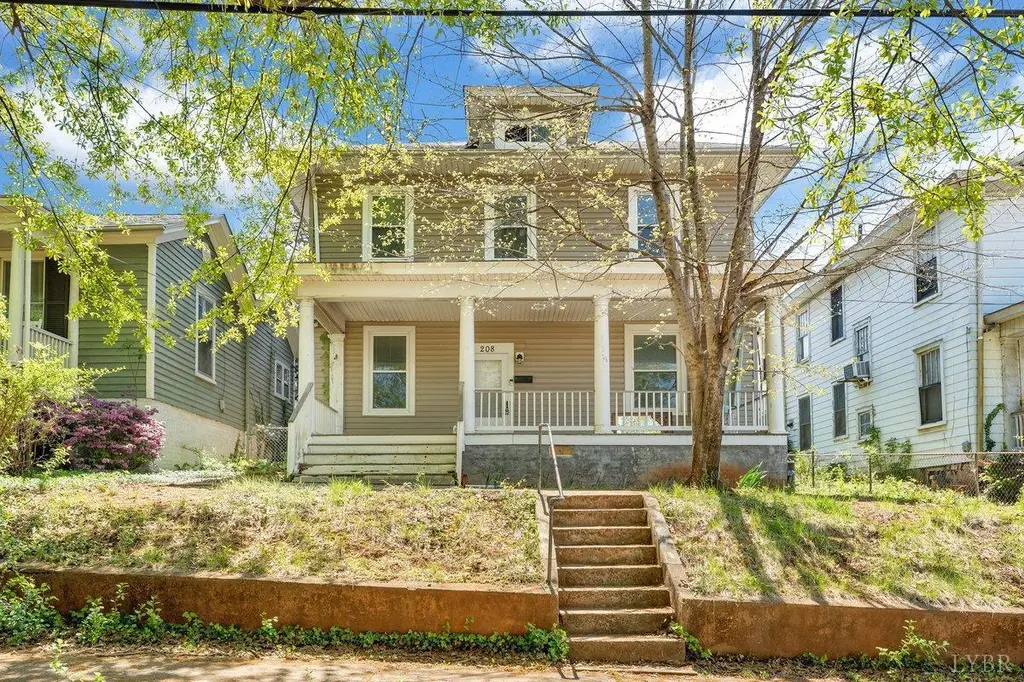
208 Denver Ave · Lynchburg, VA
Flood risk 1/10 · Minimal
- FEMA flood zone
- X (unshaded)
- Chance of flooding over 30 yrs
- 0.0%
- Est. flood insurance / yr
- $473 – $860
Fire risk 3/10 · Minor
- Est. fire insurance / yr
- $666 – $1,236
Heat risk 6/10 · Moderate
- Hot days now (above 102°F)
- 7 days/yr
- Hot days in 30 yrs
- 18 days/yr
Wind risk 2/10 · Minimal
- Chance of severe wind over 30 yrs
- 2.0%
Air-quality risk 2/10 · Minimal
- Unhealthy air days now
- 0 days/yr
- Unhealthy air days in 30 yrs
- 1 days/yr
Risk factors via First Street. Map © Google.
Why this score? — see what drove the C grade
The composite is a weighted blend of 9 inputs, each scored 0–100. Each bar is that input's sub-score; the figure is the points it added to the 100-point composite (weight × sub-score).
- Cash flow +20.2/30.0
- ARV discount +13.9/15.0
- DSCR +6.4/10.0
- 1% rule +4.7/10.0
- Livability +4.5/5.0
- Schools +4.0/10.0
- Rent growth +2.5/5.0
- Condition / age +2.5/5.0
- Appreciation +0.0/10.0
$199,900
🖨 Deal sheet (PDF) 📄 Offer letter ✓ Due diligence
Listing remarks MLS
Conveniently located just minutes from downtown and the hospitals, this move-in ready 2-story home offers space, flexibility, and strong investment potential. With 5 bedrooms and 2.5 baths, the floor plan features generously sized rooms, hardwood floors throughout, a spacious living room with fireplace, and an open kitchen. The main level includes a pantry, mud room, full bath, and multiple bedroom options, while the second floor adds even more space with additional bedrooms, baths, and a walk-in closet off the primary bedroom. Replacement vinyl windows and vinyl siding add low-maintenance appeal, and the Trex front porch offers a welcoming entry. Laundry can be located on the main level or in the basement for added convenience. Outside, enjoy a backyard and off-street parking. A rare opportunity to own so much house in a location close to work, dining, and downtown amenities.
Key facts
- 5,798 sq ft lot
- Built 1922
- Listed 43 days
Neighborhood map
What this means for you Summary
Snapshot
- This is a 5-bed/3.0-bath single-family listed at $200k.
Deal economics
- At list price, monthly cash flow is $252 ($3k/yr) — positive.
- The deal already cash-flows at list — no discount required.
- To meet the 1% rule (rent ≥ 1% of price), the offer needs to be $194k (2.7% below list).
- Recommended offer: $194k (3.0% below list) — sets the bar for market timing.
- Cap rate 7.8% vs local median 4.0% in Lynchburg — top-decile yield for the area; either an underpriced asset or a hidden risk that comps aren't pricing in. Stress-test before assuming the spread holds.
Location & tenants
- Location reads 91/100 on livability (#1 in VA, #58 nationally) — a professional / high-income tenant draw. Strengths: amenities A+, commute A+, cost of living A+; Watch: crime C-, employment D+.
- Lynchburg City Public School District (urban): math 36% / reading 61% proficiency, ranked #104 of 131 in VA (top 79%) — families likely to look elsewhere, expect single-tenant / working-renter base with shorter leases; 61% free/reduced lunch — lower-income household profile, screen leases tightly.
- Market conditions: 176 active listings in the ZIP; 1 comparable units currently listed for rent nearby; solid renter incomes; 472 units permitted in Lynchburg city in 2024 (240 in 5+ unit buildings).
Forward outlook
- Local home prices are declining (-3.0%/yr); year-one equity from $1k of loan paydown is wiped out by about $6k of value loss. Plan a longer hold.
- Lynchburg County population projected at +37% by 2050 — long-run rental-demand tailwind backs the buy-and-hold thesis.
Negotiation context
- It's been on market 43 days — a 3% lower offer ($194k) is reasonable based on typical stale-listing flexibility.
- 2 sale attempts since 8y ago; this cycle's ask has dropped $50k (20%) from the opening price — seller is motivated, your offer sets the floor, not the list.
- Current owner paid $130k; list at $200k implies a 54% gain — meaningful room to come down on a strong offer.
Risks & watch-outs
- Watch-outs: built in 1922 — expect roof / HVAC / electrical / plumbing capex.
- Climate carrying-cost: extreme-heat days projected 7→18/yr by 2055 (HVAC capex compounding) — expect insurance premiums to compound above CPI over the hold.
Questions for the listing agent
- It's been on market 43 days. Have you received any prior offers? Is the seller open to a 3% concession, seller financing, or rate buy-down credit?
- Built in 1922 — when were the roof, HVAC, electrical panel, plumbing, and water heater last replaced?
- Is there a deadline driving the sale (1031 exchange, divorce, estate, relocation)? That informs how much negotiation room exists.
- Schools are A-rated — typically a magnet for longer-tenancy family renters. What's the average tenant stay here, and is there a school-zone premium baked into asking?
- What's the average days-on-market for RENTAL listings here right now (not sales)? A rising rental-DOM trend means longer vacancies and softer asking-rent achievability than the comps imply.
- What's the recent tenant-quality profile in this submarket — average credit score on applications, eviction rate, late-payment / NSF rate, and stable-employment percentage? A property-management company in the area should have these aggregated.
- How much new for-sale + rental construction is in the pipeline within 1–3 miles? Heavy new supply typically softens prices + rents 12–24 months out; constrained supply supports both.
Investment metrics
- 1% rule
- 0.97% ✗
- Cap rate
- 7.81%
- Cash-on-cash
- 5.41%
- DSCR
- 1.24
- GRM
- 8.6
CMA / ARV
- ARV (median comp)
- $233,176
- List price
- $199,900
- Delta
- -14.27%
- Verdict
- UNDERPRICED
- Comps
- 20 within 1.0 mi
Show comp detail 6 sales within ~0.75 mi
| Address | Dist | Beds/Ba | Sqft | Sold | Price | $/sf | Match |
|---|---|---|---|---|---|---|---|
| 223 Denver Ave | 0.05mi | 5/3.5 | 2,642 (-3%) | 1mo | $399,900 | $151 | 91 |
| 3 Riverview Pl | 0.44mi | 4/3.0 (-1) | 2,990 (+10%) | 2mo | $547,000 | $183 | 56 |
| 952 Cabell St | 0.30mi | 4/2.0 (-1) | 2,408 (-11%) | 16mo | $207,400 | $86 | 44 |
| 518 Elmwood Ave | 0.66mi | 4/3.0 (-1) | 2,461 (-9%) | 18mo | $319,900 | $130 | 34 |
| 706 Elmwood Avenue Ave | 0.74mi | 4/3.0 (-1) | 3,102 (+14%) | 6mo | $606,000 | $195 | 32 |
| 2013 Early St | 0.50mi | 6/3.5 (+1) | 2,326 (-14%) | 21mo | $165,000 | $71 | 28 |
Match score weights: distance 35% · size 25% · config 20% · recency 20%. Top-matched comps best support the ARV.
Projected returns pro-forma
-3.0% appreciation · 3.0% rent growth · sell at horizon
- IRR
- -7.9%
- Equity multiple
- 0.71×
- Total profit
- $-16,350
- Equity at exit
- $29,806
- IRR
- 1.6%
- Equity multiple
- 1.11×
- Total profit
- $6,335
- Equity at exit
- $17,284
Cash invested: $55,972 (down + closing). Projections, not guarantees.
Landlord ↔ Tenant lean methodology
- Overall (STATE)
- 55 Moderately Landlord-Leaning
- State Virginia
- 55 Moderately Landlord-Leaning · D+2
- County
- — inherits STATE
- City
- — inherits STATE
ZIP-level market 24503
- Active inventory
- 176
- Price-to-rent
- 8.6×
Monthly cashflow live
- Estimated rent
- $1,944 medium interval (Pro) →
- Mortgage (P&I)
- −$1,048
- Tax from tax record
- −$152 /mo · $1,822/yr
- Insurance
- −$83
- HOA
- −$0
- Vacancy / Maint / Mgmt
- −$408
- Net cashflow
- $252
Break-even live
Sensitivity live
| Price | -10% $366 | -5% $309 | +0% $252 | +5% $196 | +10% $139 |
|---|---|---|---|---|---|
| Rent | -10% $99 | -5% $176 | +0% $252 | +5% $329 | +10% $406 |
| Rate | -1.0pp $353 | -0.5pp $303 | base $252 | +0.5pp $201 | +1.0pp $148 |
UW: 25.0% down · 7.5% · 30yr · 1.5% tax · 5.0% vac · 8.0% maint · 8.0% mgmt
Financing live
Cash to close
- Down payment
- $49,975
- Closing costs
- $5,997
- Reserves months
- —
- Total cash needed
- —
Loan-product check · same deal, 3 products live
Conventional
25% down · 7.5% · 30yr
- Down + closing
- —
- Monthly P&I
- —
- Monthly cashflow
- —
- DSCR
- —
- Eligible?
- —
Personal DTI + credit; lowest rate.
DSCR
20% down · 8.5% · 30yr
- Down + closing
- —
- Monthly P&I
- —
- Monthly cashflow
- —
- DSCR
- —
- Eligible?
- —
No personal income docs; deal must DSCR.
Hard money
10% down · 12.0% · 12mo
- Down + closing
- —
- Monthly P&I
- —
- Monthly cashflow
- —
- DSCR
- —
- Eligible?
- —
Short-term bridge; refi at stabilization.
Rent comps 1 comps
| Address | Beds | Baths | Sqft | Rent | $/sqft | DOM | Units | Dist |
|---|---|---|---|---|---|---|---|---|
| 520 Elmwood Ave Lynchburg, VA | 5.0 | 3.0 | 1800 | $2,250 | $1.25 | 45d | 1 | 0.65mi |
Listing history 6 events
-
2026-05-15price $199,900 889-char remark
Show marketing remark (889 chars)
Conveniently located just minutes from downtown and the hospitals, this move-in ready 2-story home offers space, flexibility, and strong investment potential. With 5 bedrooms and 2.5 baths, the floor plan features generously sized rooms, hardwood floors throughout, a spacious living room with fireplace, and an open kitchen. The main level includes a pantry, mud room, full bath, and multiple bedroom options, while the second floor adds even more space with additional bedrooms, baths, and a walk-in closet off the primary bedroom. Replacement vinyl windows and vinyl siding add low-maintenance appeal, and the Trex front porch offers a welcoming entry. Laundry can be located on the main level or in the basement for added convenience. Outside, enjoy a backyard and off-street parking. A rare opportunity to own so much house in a location close to work, dining, and downtown amenities.
-
2026-04-30price $225,000 889-char remark
Show marketing remark (889 chars)
Conveniently located just minutes from downtown and the hospitals, this move-in ready 2-story home offers space, flexibility, and strong investment potential. With 5 bedrooms and 2.5 baths, the floor plan features generously sized rooms, hardwood floors throughout, a spacious living room with fireplace, and an open kitchen. The main level includes a pantry, mud room, full bath, and multiple bedroom options, while the second floor adds even more space with additional bedrooms, baths, and a walk-in closet off the primary bedroom. Replacement vinyl windows and vinyl siding add low-maintenance appeal, and the Trex front porch offers a welcoming entry. Laundry can be located on the main level or in the basement for added convenience. Outside, enjoy a backyard and off-street parking. A rare opportunity to own so much house in a location close to work, dining, and downtown amenities.
-
2026-04-15$250,000 Active 889-char remark
Show marketing remark (889 chars)
Conveniently located just minutes from downtown and the hospitals, this move-in ready 2-story home offers space, flexibility, and strong investment potential. With 5 bedrooms and 2.5 baths, the floor plan features generously sized rooms, hardwood floors throughout, a spacious living room with fireplace, and an open kitchen. The main level includes a pantry, mud room, full bath, and multiple bedroom options, while the second floor adds even more space with additional bedrooms, baths, and a walk-in closet off the primary bedroom. Replacement vinyl windows and vinyl siding add low-maintenance appeal, and the Trex front porch offers a welcoming entry. Laundry can be located on the main level or in the basement for added convenience. Outside, enjoy a backyard and off-street parking. A rare opportunity to own so much house in a location close to work, dining, and downtown amenities.
-
2019-07-02soldstatus $130,000
-
2019-07-01soldstatus $130,000 349-char remark
Show marketing remark (349 chars)
Investment opportunity. So convenient to downtown and minutes from hospitals. 5 bedrooms 2.5 bath, large rooms, new windows, hardwood throughout, great open kitchen, pantry, mud room - so much house. Laundry can be main level or in the basement. Back yard off street parking, vinyl siding, trex front porch, replacement vinyl windows. Move in ready.
-
2018-08-03$139,900 349-char remark
Show marketing remark (349 chars)
Investment opportunity. So convenient to downtown and minutes from hospitals. 5 bedrooms 2.5 bath, large rooms, new windows, hardwood throughout, great open kitchen, pantry, mud room - so much house. Laundry can be main level or in the basement. Back yard off street parking, vinyl siding, trex front porch, replacement vinyl windows. Move in ready.
ⓘ Source: listings_history table (triggers on properties + properties_extension) + one-shot
backfill from property_details.listing_events for pre-trigger history.
Tax reassessment forecast VA · Resets to sale price
- Current annual tax
- $1,822 · $152/mo
- Projected year-2 tax
- $1,822 · $152/mo
- Expected delta
- $0/yr ($0/mo · 0.0%)
ⓘ Screening estimate from a state-policy table — verify with the county assessor before closing.
Climate risk First Street
- Flood 1/10 Low FEMA zone X (unshaded) · 0% chance over 30 yrs
- Wildfire 3/10 Moderate
- Heat 6/10 Major 7 d/yr ≥102°F today · 18 d/yr by 30 yrs out
- Wind 2/10 Low 2% chance of damaging wind over 30 yrs
- Air quality 2/10 Low 0 unhealthy d/yr today · 1 by 30 yrs out
Nearby sold comps map
Loading sold comps map…
Walkable amenities ~0.75 mi
Loading nearby amenities…
Taxation est. · year 1
- Rental income
- $23,328
- − Mortgage interest
- −$11,198
- − Property taxes
- −$1,822
- − Insurance
- −$1,000
- − Repairs & maintenance
- −$1,866
- − Management
- −$1,866
- − Depreciation
- −$5,815
- Taxable loss
- −$238
- Est. tax savings @ 24.0%
- +$57
- After-tax cash flow
- $3,086/yr
For passive investors: Depreciation is non-cash, so a rental often shows a tax loss while cash-flowing — sheltering income. Rental losses are passive: they offset passive income freely, and up to $25,000/yr can offset ordinary (W-2) income if you actively participate and your MAGI is under $100k (phasing out to $0 by $150k); unused losses carry forward. On sale, claimed depreciation is recaptured at up to 25%, and gains may owe capital-gains tax (a 1031 exchange can defer both). Figures are a year-1 estimate at your 24.0% rate — not tax advice; consult a CPA.
Schools (NCES district)
- District
- Lynchburg City Public School District
- NCES district ID
- 5102340
- Math proficiency
- 36% ▼ -38.00%
- Reading proficiency
- 61% ▼ -8.00%
- Median HH income
- $39,097
- Composite
- 40.4/100
- National rank
- #3730
- State rank
- #104 of 131 in VA
Livability — Lynchburg
- Score
- 91/100
- State rank
- #1
- US rank
- #58
Category grades
Schools grade is shown separately in the Schools card above.
Census & demographics
- Census place
- Lynchburg, VA
- County
- Lynchburg City · 97,036 people
- City population
- 97,036
- Metro
- Lynchburg, VA
- Population (ZIP)
- 20,419
- Household income
- $89,137
- Rent vs Own
- Severe rent burden
- 506.0
Population outlook (Lynchburg County) Hauer SSP2
- Today (2025)
- 87,977 people
- By 2030
- 93,626 · +6.4%
- By 2040
- 106,145 · +20.7%
- By 2050
- 120,783 · +37.3%
- By 2075
- 162,249 · +84.4%
- By 2100
- 191,358 · +117.5%
Race, ethnicity, and origin ACS 2023
- Neighborhood character
- Predominantly White (79%)
- Race & ethnicity
- White 79% Black 12% Two or more races 5% Hispanic / Latino 4%
- Common ancestry
- Italian 4% Slovak 2% Lithuanian 2%
- Foreign-born
- 3% · Canada, China
- Languages at home
- 96% English-only · Spanish 2% Other Indo-European 1%
Political lean MEDSL · Lynchburg
- 2024 margin
- Lean R (+7.9) · D 45.4% · R 53.3% · Other 1.3%
- 2008→2024 swing
- -3.9pp toward R · 2008: -4.0pp · 2024: -7.9pp
- All cycles
- 2024: R+7.9 2020: D+2.6 2016: R+9.0 2012: R+10.6 2008: R+4.0
Not yet ingested
- Civics
- —
Market trends
- HPI YoY
- ▼ -220.75%
- Current HPI
- 227.1443
- Rent YoY
- —
- Metro
- Lynchburg, VA
- State GDP YoY
- ▲ 2.40%
- F500 in state
- 50
Industry mix (Fortune 500 HQ in VA)
| Industry | F500 HQs | Revenue |
|---|---|---|
| Aerospace / Defense | 4 | $236B |
|
||
| Technology / Defense | 3 | $32B |
|
||
| Financial Services | 2 | $176B |
|
||
| Utilities | 2 | $27B |
|
||
| Insurance | 2 | $25B |
|
||
| Technology | 2 | $15B |
|
||
Price history
+42.9% since first listed6 events — show timeline
- 2026-05-15 Price Changed $199,900 LMLS
- 2026-04-30 Price Changed $225,000 LMLS
- 2026-04-15 Listed $250,000 LMLS
- 2019-07-02 Sold (Public Records) $130,000 Public Records
- 2019-07-01 Sold (MLS) $130,000 LMLS
- 2018-08-03 Listed $139,900 LMLS
Property tax history
+1.1%/yrLatest (2025): $1,822 · +16.9% YoY. Source: county tax records.
Cash-flow waterfall
monthlySold comps — $/sqft
last 12 mo · ≤1 miLoading sold comps…