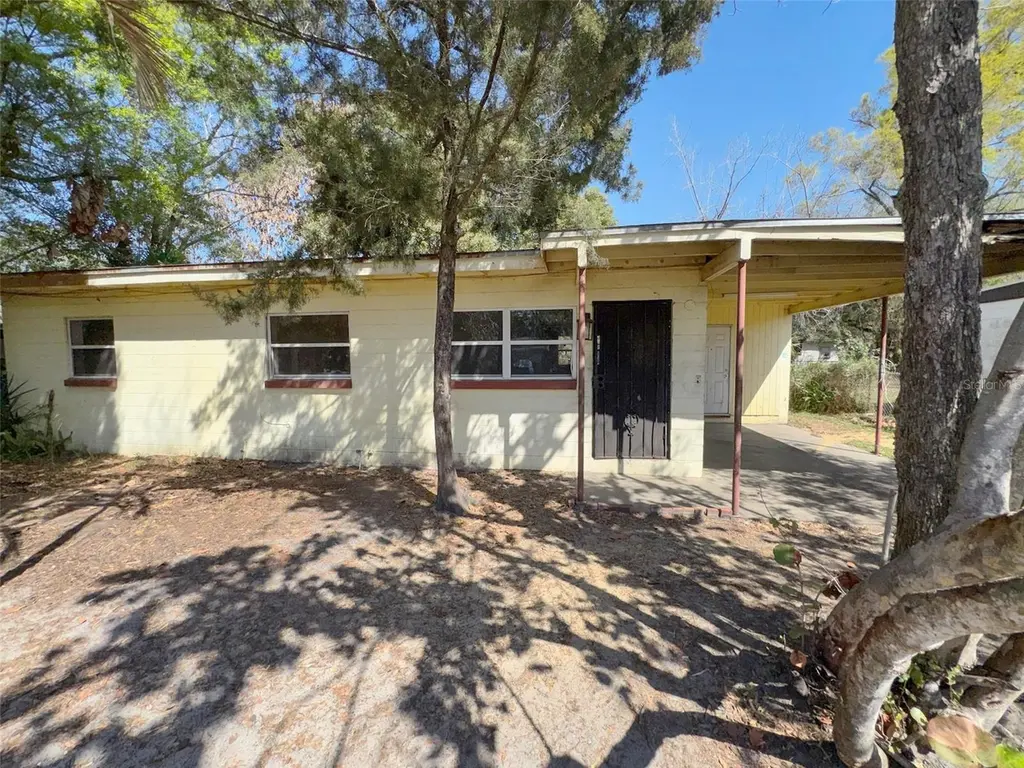
2841 W Amelia St · Orlando, FL
Flood risk 4/10 · Minor
- FEMA flood zone
- X (unshaded)
- Chance of flooding over 30 yrs
- 0.24%
- Est. flood insurance / yr
- $507 – $1,088
Fire risk 1/10 · Minimal
- Est. fire insurance / yr
- $947 – $1,759
Heat risk 8/10 · Major
- Hot days now (above 108°F)
- 7 days/yr
- Hot days in 30 yrs
- 22 days/yr
Wind risk 9/10 · Severe
- Chance of severe wind over 30 yrs
- 99.0%
Air-quality risk 1/10 · Minimal
- Unhealthy air days now
- 0 days/yr
- Unhealthy air days in 30 yrs
- 0 days/yr
Risk factors via First Street. Map © Google.
Why this score? — see what drove the C+ grade
The composite is a weighted blend of 9 inputs, each scored 0–100. Each bar is that input's sub-score; the figure is the points it added to the 100-point composite (weight × sub-score).
- Cash flow +22.7/30.0
- ARV discount +15.0/15.0
- DSCR +7.3/10.0
- 1% rule +5.9/10.0
- Livability +4.3/5.0
- Schools +4.1/10.0
- Rent growth +2.9/5.0
- Condition / age +2.5/5.0
- Appreciation +0.0/10.0
$130,000
🖨 Deal sheet (PDF) 📄 Offer letter ✓ Due diligence
Listing remarks
3-bedroom 1 bath home for sale AS IS. Large front and back yard perfect for privacy and storage. Please note: all carpet and kitchen appliances have been removed. This home is ready for renovations to make it a perfect rental or first home. Easy access to the expressway, shopping and dining.
Key facts
- Front and back yard
- Shopping and dining
- 6,098 sq ft lot
Tags
Property features AI
Finance
- Other: Residential, R-1A zoning; Living area reported as 864 (public records); Building area total reported as 1,192; Universal property identifier on file; Property not in a CDD; Not homesteaded
- Financial info: Unfurnished; No lease restrictions
Exterior
- Parking: Carport with 1 space
- Utilities: Public water; Public sewer; Electricity available
- Home design: Single family residence; One story; South-facing
- Construction: Block and stucco construction; Shingle roof; Slab foundation; Built on a lot of about 0 to less than 1/4 acre
- Exterior features: Paved road access; Lot approximately 0.14 acres
Interior
- Kitchen: No appliances included
- Bedrooms: 3 bedrooms
- Flooring: Concrete floors
- Bathrooms: 1 full bathroom
- Heating & cooling: No heating; No cooling
- Interior features: Eat-in kitchen; Living room/dining room combo; Storage
- Laundry & utility: Laundry room
Neighborhood map
What this means for you Summary
Snapshot
- This is a 3-bed/1.0-bath single-family listed at $130k.
Deal economics
- At list price, monthly cash flow is $223 ($3k/yr) — positive.
- The deal already cash-flows at list — no discount required.
- Meets the 1% rule at list price ($1k rent vs $130k).
- Recommended offer: $126k (3.0% below list) — sets the bar for market timing.
- Cap rate 8.3% vs local median 3.0% in Orlando — top-decile yield for the area; either an underpriced asset or a hidden risk that comps aren't pricing in. Stress-test before assuming the spread holds.
Location & tenants
- Location reads 86/100 on livability (#12 in FL, #360 nationally) — a professional / high-income tenant draw. Strengths: amenities A+, commute A+, housing A+.
- Orange (suburban): math 46% / reading 51% proficiency, ranked #43 of 73 in FL (top 59%) — families likely to look elsewhere, expect single-tenant / working-renter base with shorter leases.
- Market conditions: Rents rising (+1.4%/yr); 142 active listings in the ZIP; 28 comparable units currently listed for rent nearby; rentals at typical pace (median 25d on market — plan ~3-4 weeks tenant-placement turnaround); lower-income renter base — watch delinquency; 8,053 units permitted in Orange County in 2024 (3,133 in 5+ unit buildings).
- This rent runs 42% of the median local income ($41k/yr) — at the standard rent-burdened threshold; future hikes will face affordability resistance.
Forward outlook
- Local home prices are declining (-3.0%/yr); year-one equity from $899 of loan paydown is wiped out by about $4k of value loss. Plan a longer hold.
- Orange County population projected at +52% by 2050 — long-run rental-demand tailwind backs the buy-and-hold thesis.
Negotiation context
- It's been on market 39 days — a 3% lower offer ($126k) is reasonable based on typical stale-listing flexibility.
- 5 sale attempts since 3y ago with the ask held roughly flat each time — persistent listings suggest the price (not the market) is what's stuck; bring a comps-based counter.
Risks & watch-outs
- Watch-outs: built in 1958 — expect roof / HVAC / electrical / plumbing capex.
- Climate carrying-cost: severe wind risk, 99% chance of damaging wind over 30y; extreme-heat days projected 7→22/yr by 2055 (HVAC capex compounding) — expect insurance premiums to compound above CPI over the hold.
Questions for the listing agent
- It's been on market 39 days. Have you received any prior offers? Is the seller open to a 3% concession, seller financing, or rate buy-down credit?
- Built in 1958 — when were the roof, HVAC, electrical panel, plumbing, and water heater last replaced?
- Is there a deadline driving the sale (1031 exchange, divorce, estate, relocation)? That informs how much negotiation room exists.
- Schools are B-rated — typically a magnet for longer-tenancy family renters. What's the average tenant stay here, and is there a school-zone premium baked into asking?
- What's the average days-on-market for RENTAL listings here right now (not sales)? A rising rental-DOM trend means longer vacancies and softer asking-rent achievability than the comps imply.
- What's the recent tenant-quality profile in this submarket — average credit score on applications, eviction rate, late-payment / NSF rate, and stable-employment percentage? A property-management company in the area should have these aggregated.
- How much new for-sale + rental construction is in the pipeline within 1–3 miles? Heavy new supply typically softens prices + rents 12–24 months out; constrained supply supports both.
Investment metrics
- 1% rule
- 1.09% ✓
- Cap rate
- 8.35%
- Cash-on-cash
- 7.34%
- DSCR
- 1.33
- GRM
- 7.6
CMA / ARV
- ARV (on-the-fly)
- $179,712
- Comps found
- 2
Show comp detail 2 sales within ~0.75 mi
| Address | Dist | Beds/Ba | Sqft | Sold | Price | $/sf | Match |
|---|---|---|---|---|---|---|---|
| 3001 W Amelia St | 0.08mi | 3/1.0 | 864 (0%) | 1mo | $145,000 | $168 | 96 |
| 3524 Amigos Ave | 0.69mi | 2/1.0 (-1) | 970 (+12%) | 11mo | $202,000 | $208 | 33 |
Match score weights: distance 35% · size 25% · config 20% · recency 20%. Top-matched comps best support the ARV.
Projected returns pro-forma
-3.0% appreciation · 1.42% rent growth · sell at horizon
- IRR
- -6.9%
- Equity multiple
- 0.75×
- Total profit
- $-9,083
- Equity at exit
- $19,383
- IRR
- 0.7%
- Equity multiple
- 1.04×
- Total profit
- $1,610
- Equity at exit
- $11,240
Cash invested: $36,400 (down + closing). Projections, not guarantees.
Landlord ↔ Tenant lean methodology
- Overall (STATE)
- 87 Strongly Landlord-Friendly
- State Florida
- 87 Strongly Landlord-Friendly · R+3
- County
- — inherits STATE
- City
- — inherits STATE
ZIP-level market 32805
- Home prices YoY
- -7.6%
- Rents YoY
- 1.4%
- Active inventory
- 142
- Price-to-rent
- 7.6×
Monthly cashflow live
- Estimated rent
- $1,419 high interval (Pro) →
- Mortgage (P&I)
- −$682
- Tax est. 1.5%
- −$162 /mo · $1,950/yr
- Insurance
- −$54
- HOA
- −$0
- Vacancy / Maint / Mgmt
- −$298
- Net cashflow
- $223
Break-even live
Sensitivity live
| Price | -10% $313 | -5% $268 | +0% $223 | +5% $178 | +10% $133 |
|---|---|---|---|---|---|
| Rent | -10% $111 | -5% $167 | +0% $223 | +5% $279 | +10% $335 |
| Rate | -1.0pp $288 | -0.5pp $256 | base $223 | +0.5pp $189 | +1.0pp $155 |
UW: 25.0% down · 7.5% · 30yr · 1.5% tax · 5.0% vac · 8.0% maint · 8.0% mgmt
Financing live
Cash to close
- Down payment
- $32,500
- Closing costs
- $3,900
- Reserves months
- —
- Total cash needed
- —
Loan-product check · same deal, 3 products live
Conventional
25% down · 7.5% · 30yr
- Down + closing
- —
- Monthly P&I
- —
- Monthly cashflow
- —
- DSCR
- —
- Eligible?
- —
Personal DTI + credit; lowest rate.
DSCR
20% down · 8.5% · 30yr
- Down + closing
- —
- Monthly P&I
- —
- Monthly cashflow
- —
- DSCR
- —
- Eligible?
- —
No personal income docs; deal must DSCR.
Hard money
10% down · 12.0% · 12mo
- Down + closing
- —
- Monthly P&I
- —
- Monthly cashflow
- —
- DSCR
- —
- Eligible?
- —
Short-term bridge; refi at stabilization.
Rent comps 28 comps
| Address | Beds | Baths | Sqft | Rent | $/sqft | DOM | Units | Dist |
|---|---|---|---|---|---|---|---|---|
| 2800 W Concord St Orlando, FL | 3.0 | 1.0 | 864 | $844 | $0.98 | 25d | 1 | 0.12mi |
| 2208 W Central Blvd Unit 2208 B Orlando, FL | 2.0 | 1.0 | 600 | $1,195 | $1.99 | 25d | 1 | 0.60mi |
| 936 Pinedale Ave Unit A Orlando, FL | 3.0 | 2.0 | 950 | $1,499 | $1.58 | 23d | 1 | 0.62mi |
| 936 Pinedale Ave Orlando, FL | 3.0 | 2.0 | 950 | $1,499 | $1.58 | 4d | 1 | 0.62mi |
| 2023 W Pine St Unit 4 Orlando, FL | 2.0 | 1.0 | 720 | $1,195 | $1.66 | 25d | 1 | 0.78mi |
| 1100 N John Young Pkwy Orlando, FL | 1.0–3.0 | 1.0–2.0 | 977 | $2,569 | $2.63 | 3d | 12 | 0.86mi |
| 3750 W D Judge Dr Orlando, FL | 1.0–2.0 | 1.0–2.0 | 805 | $1,612 | $2.00 | 9d | 1 | 0.92mi |
| 3025 Long St Unit A Orlando, FL | 2.0 | 1.0 | 678 | $1,650 | $2.43 | 25d | 1 | 0.92mi |
| 516 Sunset Dr Orlando, FL | 2.0 | 1.0 | 600 | $1,395 | $2.33 | 9d | 1 | 1.00mi |
| 1322 Arlington St Orlando, FL | 3.0 | 1.0 | 846 | $1,750 | $2.07 | 25d | 1 | 1.09mi |
| 4333 Cynthia St Orlando, FL | 3.0 | 2.0 | 1039 | $1,813 | $1.74 | 23d | 1 | 1.14mi |
| 3205 Orange Center Blvd Orlando, FL | 2.0 | 1.0 | 600 | $1,336 | $2.23 | 25d | 1 | 1.15mi |
| 4431 Barley St Orlando, FL | 4.0 | 1.0 | 1026 | $864 | $0.84 | 25d | 1 | 1.31mi |
| 1045 Polk St Unit 1049B Orlando, FL | 3.0 | 1.0 | 1062 | $1,650 | $1.55 | 25d | 1 | 1.31mi |
| 1045 W Washington St Orlando, FL | 2.0 | 1.0 | 715 | $1,095 | $1.53 | 25d | 1 | 1.32mi |
| 1032 W Jefferson St Unit 5 Orlando, FL | 2.0 | 1.0 | 810 | $940 | $1.16 | 12d | 1 | 1.34mi |
| 1032 W Jefferson St Unit 5 Orlando, FL | 2.0 | 1.0 | 810 | $940 | $1.16 | 5d | 1 | 1.34mi |
| 1216 Lawne Blvd Orlando, FL | 3.0 | 2.0 | 1000 | $1,800 | $1.80 | 25d | 1 | 1.35mi |
| 408 N Westmoreland Dr Orlando, FL | 1.0–2.0 | 1.0 | 550 | $1,595 | $2.90 | 25d | 1 | 1.37mi |
| 1011 Dewitt Dr Unit 1013 Dewitt A Orlando, FL | 2.0 | 1.0 | 625 | $1,195 | $1.91 | 12d | 1 | 1.39mi |
| 1011 Dewitt Dr Apt B Orlando, FL | 2.0 | 1.0 | 650 | $995 | $1.53 | 23d | 1 | 1.39mi |
| 1016 Alba Dr Unit 1016 Orlando, FL | 2.0 | 1.0 | 1008 | $2,100 | $2.08 | 4d | 1 | 1.41mi |
| 909 W Livingston St Unit 2 Orlando, FL | 2.0 | 1.0 | 550 | $1,295 | $2.35 | 12d | 1 | 1.43mi |
| 200 Fanfair Ave Orlando, FL | 3.0 | 1.0 | 941 | $1,730 | $1.84 | 9d | 1 | 1.45mi |
| 817 Bentley St Unit A Orlando, FL | 2.0 | 1.0 | 730 | $1,300 | $1.78 | 25d | 1 | 1.47mi |
| 812 W Livingston St Unit B Orlando, FL | 2.0 | 1.0 | 650 | $1,175 | $1.81 | 4d | 1 | 1.48mi |
| 4610 Barley St Orlando, FL | 2.0 | 1.0 | 805 | $1,699 | $2.11 | 25d | 1 | 1.48mi |
| 811 Hills St Orlando, FL | 2.0 | 1.0 | 792 | $1,399 | $1.77 | 25d | 1 | 1.50mi |
Listing history 26 events
-
2026-06-21days on market $130,000 Active 39 DOM
-
2026-06-18days on market $130,000 Active 36 DOM
-
2026-06-17days on market $130,000 Active 35 DOM
-
2026-06-16days on market $130,000 Active 34 DOM
-
2026-06-15days on market $130,000 Active 33 DOM
-
2026-06-13days on market $130,000 Active 31 DOM
-
2026-06-13days on market $130,000 Active 30 DOM
-
2026-06-09days on market $130,000 Active 27 DOM
-
2026-06-08status $130,000 Active 26 DOM
-
2026-06-07statusdays on market $130,000 Pending 26 DOM
-
2026-06-04days on market $130,000 Active 24 DOM
-
2026-06-03days on market $130,000 Active 23 DOM
-
2026-06-02days on market $130,000 Active 22 DOM
-
2026-06-01days on market $130,000 Active 21 DOM
-
2026-05-31days on market $130,000 Active 20 DOM
-
2026-05-20status Active
-
2026-05-13status Pending
-
2026-05-05$130,000 Active
-
2024-07-22status Pending
-
2024-07-16status Active
-
2024-06-26status Pending
-
2024-06-18$165,000 Active
-
2024-06-05historical
-
2024-03-25price $190,000
-
2024-02-13price $195,000
-
2023-10-18$220,000 Active
ⓘ Source: listings_history table (triggers on properties + properties_extension) + one-shot
backfill from property_details.listing_events for pre-trigger history.
Climate risk First Street
- Flood 4/10 Moderate FEMA zone X (unshaded) · 24% chance over 30 yrs
- Wildfire 1/10 Low
- Heat 8/10 Severe 7 d/yr ≥108°F today · 22 d/yr by 30 yrs out
- Wind 9/10 Extreme 99% chance of damaging wind over 30 yrs
- Air quality 1/10 Low 0 unhealthy d/yr today · 0 by 30 yrs out
Nearby sold comps map
Loading sold comps map…
Walkable amenities ~0.75 mi
Loading nearby amenities…
Taxation est. · year 1
- Rental income
- $17,029
- − Mortgage interest
- −$7,282
- − Property taxes
- −$1,950
- − Insurance
- −$650
- − Repairs & maintenance
- −$1,362
- − Management
- −$1,362
- − Depreciation
- −$3,782
- Taxable income
- $640
- Est. tax owed @ 24.0%
- −$154
- After-tax cash flow
- $2,518/yr
For passive investors: Depreciation is non-cash, so a rental often shows a tax loss while cash-flowing — sheltering income. Rental losses are passive: they offset passive income freely, and up to $25,000/yr can offset ordinary (W-2) income if you actively participate and your MAGI is under $100k (phasing out to $0 by $150k); unused losses carry forward. On sale, claimed depreciation is recaptured at up to 25%, and gains may owe capital-gains tax (a 1031 exchange can defer both). Figures are a year-1 estimate at your 24.0% rate — not tax advice; consult a CPA.
Schools (NCES district)
- District
- Orange
- NCES district ID
- 1201440
- Math proficiency
- 46% ▼ -9.00%
- Reading proficiency
- 51% ▼ -2.00%
- Median HH income
- $49,350
- Composite
- 41.47/100
- National rank
- #3461
- State rank
- #43 of 73 in FL
Livability — Orlando
- Score
- 86/100
- State rank
- #12
- US rank
- #360
Category grades
Schools grade is shown separately in the Schools card above.
Census & demographics
- Census place
- Orlando, FL
- County
- Orange County · 1,471,359 people
- City population
- 964,969
- Metro
- Orlando-Kissimmee-Sanford, FL
- Population (ZIP)
- 19,294
- Household income
- $40,515
- Rent vs Own
- Severe rent burden
- 1597.0
Population outlook (Orange County) Hauer SSP2
- Today (2025)
- 1,618,226 people
- By 2030
- 1,787,404 · +10.5%
- By 2040
- 2,125,621 · +31.4%
- By 2050
- 2,454,016 · +51.6%
- By 2075
- 3,173,711 · +96.1%
- By 2100
- 3,607,781 · +122.9%
Race, ethnicity, and origin ACS 2023
- Neighborhood character
- Predominantly Black (70%)
- Race & ethnicity
- Black 70% Hispanic / Latino 15% White 13% Two or more races 8%
- Hispanic origin (detail)
- Mexican 3% Puerto Rican 4% Cuban 1% Dominican 3%
- Common ancestry
- Hispanic 9% Russian 1%
- Foreign-born
- 16% · Canada, Jamaica
- Languages at home
- 80% English-only · Spanish 11% French/Haitian/Cajun 8%
Political lean MEDSL · Orange
- 2024 margin
- D (+13.6) · D 56.1% · R 42.5% · Other 1.3%
- 2008→2024 swing
- -5.0pp toward R · 2008: 18.6pp · 2024: 13.6pp
- All cycles
- 2024: D+13.6 2020: D+23.1 2016: D+24.6 2012: D+18.2 2008: D+18.6
Not yet ingested
- Civics
- —
Market trends
- HPI YoY
- ▼ -35.19%
- Current HPI
- 429.3242
- Rent YoY
- ▲ 1.42%
- Metro
- Orlando-Kissimmee-Sanford, FL
- State GDP YoY
- ▲ 3.28%
- F500 in state
- 36
Industry mix (Fortune 500 HQ in FL)
| Industry | F500 HQs | Revenue |
|---|---|---|
| Industrial Technology | 2 | $29B |
|
||
| Insurance | 2 | $17B |
|
||
| Retail | 1 | $60B |
|
||
| Technology Distribution | 1 | $58B |
|
||
| Homebuilding | 1 | $35B |
|
||
| Technology Manufacturing | 1 | $35B |
|
||
Price history
-40.9% since first listed11 events — show timeline
- 2026-05-20 Relisted — Stellar MLS as Distributed by MLS Grid
- 2026-05-13 Pending — Stellar MLS as Distributed by MLS Grid
- 2026-05-05 Listed $130,000 Stellar MLS as Distributed by MLS Grid
- 2024-07-22 Pending — Stellar MLS as Distributed by MLS Grid
- 2024-07-16 Relisted — Stellar MLS as Distributed by MLS Grid
- 2024-06-26 Pending — Stellar MLS as Distributed by MLS Grid
- 2024-06-18 Listed $165,000 Stellar MLS as Distributed by MLS Grid
- 2024-06-05 Listing Removed — Stellar MLS as Distributed by MLS Grid
- 2024-03-25 Price Changed $190,000 Stellar MLS as Distributed by MLS Grid
- 2024-02-13 Price Changed $195,000 Stellar MLS as Distributed by MLS Grid
- 2023-10-18 Listed $220,000 Stellar MLS as Distributed by MLS Grid
Property tax history
+3.3%/yrLatest (2025): $159 · +25.0% YoY. Source: county tax records.
Cash-flow waterfall
monthlySold comps — $/sqft
last 12 mo · ≤1 miLoading sold comps…