 Multi-family
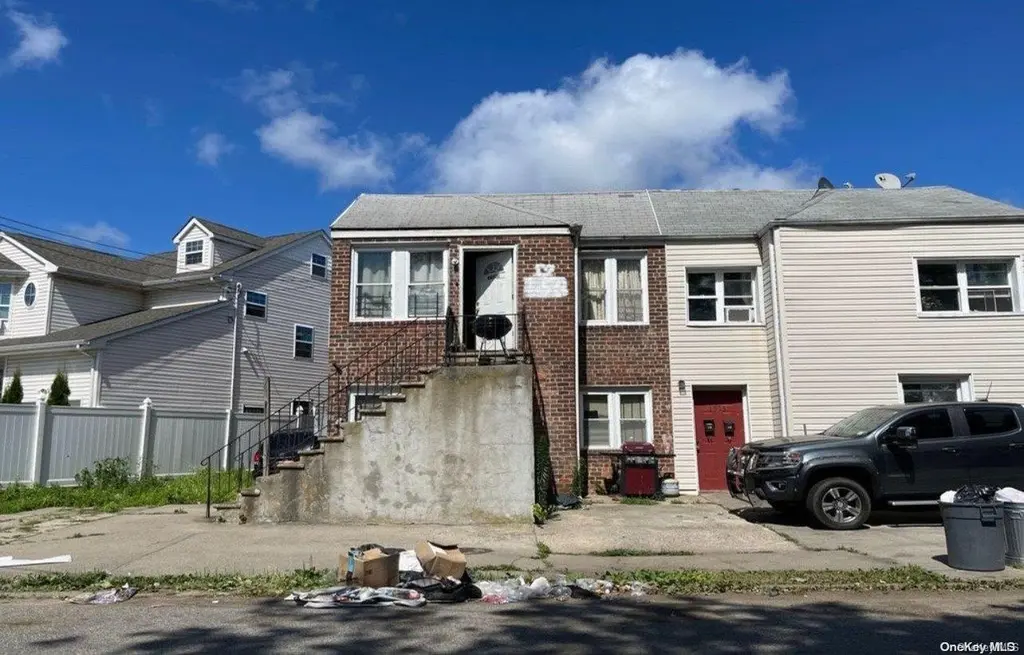
15-20 Beach 12th St · New York, NY
Flood risk 6/10 · Moderate
- FEMA flood zone
- X (shaded)
- Chance of flooding over 30 yrs
- 0.73%
- Est. flood insurance / yr
- $507 – $1,088
Fire risk 1/10 · Minimal
- Est. fire insurance / yr
- $691 – $1,283
Heat risk 6/10 · Moderate
- Hot days now (above 95°F)
- 7 days/yr
- Hot days in 30 yrs
- 16 days/yr
Wind risk 8/10 · Major
- Chance of severe wind over 30 yrs
- 80.0%
Air-quality risk 4/10 · Minor
- Unhealthy air days now
- 4 days/yr
- Unhealthy air days in 30 yrs
- 6 days/yr
Risk factors via First Street. Map © Google.
Why this score? — see what drove the B+ grade
The composite is a weighted blend of 9 inputs, each scored 0–100. Each bar is that input's sub-score; the figure is the points it added to the 100-point composite (weight × sub-score).
- Cash flow +30.0/30.0
- ARV discount +15.0/15.0
- 1% rule +10.0/10.0
- DSCR +10.0/10.0
- Schools +5.0/10.0
- Livability +3.8/5.0
- Rent growth +2.5/5.0
- Condition / age +2.5/5.0
- Appreciation +0.0/10.0
$350,000
🖨 Deal sheet (PDF) 📄 Offer letter ✓ Due diligence
Multi-family units
County records classify this as Multi-Family (2-4 Unit). Listing-text estimate: 1 unit. estimate disagrees with records
Listing remarks
SHORT SALE SUBJECT TO THIRD PARTY APPROVAL.
Key facts
- 4,450 sq ft lot
- Built 1945
- Listed 133 days
Neighborhood map
What this means for you Summary
Snapshot
- This is a 4-bed/2.0-bath multifamily listed at $350k.
Deal economics
- At list price, monthly cash flow is $2k ($28k/yr) — positive.
- The deal already cash-flows at list — no discount required.
- Meets the 1% rule at list price ($6k rent vs $350k).
- Recommended offer: $308k (12.0% below list) — sets the bar for market timing.
- Cap rate 14.2% vs local median 2.6% in New York — top-decile yield for the area; either an underpriced asset or a hidden risk that comps aren't pricing in. Stress-test before assuming the spread holds.
Location & tenants
- Location reads 75/100 on livability (#268 in NY, #4,188 nationally) — a middle-class / working-renter tenant base. Strengths: amenities A+, commute A+, health & safety A; Watch: crime F, cost of living F.
- Market conditions: 137 active listings in the ZIP; 3 comparable units currently listed for rent nearby; rentals at typical pace (median 20d on market — plan ~3-4 weeks tenant-placement turnaround); 5,302 units permitted in Queens County in 2024 (4,918 in 5+ unit buildings).
- At $5,770/mo this rent would consume 123% of the median local household income ($56k/yr) (locally 4702% of renters already pay >50% of income on rent) — very limited rent-growth headroom before tenants either downsize or default.
Forward outlook
- Local home prices are declining (-3.0%/yr); year-one equity from $2k of loan paydown is wiped out by about $10k of value loss. Plan a longer hold.
- Queens County population projected at +16% by 2050 — long-run rental-demand tailwind backs the buy-and-hold thesis.
- At projected returns (-3.0% appreciation + 3.0% rent growth), your $98k cash investment doubles in ~5 years — after that, you're playing with house money.
Negotiation context
- It's been on market 133 days — a 12% lower offer ($308k) is reasonable based on typical stale-listing flexibility.
- 2 sale attempts since 11y ago with the ask held roughly flat each time — persistent listings suggest the price (not the market) is what's stuck; bring a comps-based counter.
Risks & watch-outs
- Watch-outs: built in 1945 — expect roof / HVAC / electrical / plumbing capex.
- Climate carrying-cost: major flood risk; severe wind risk, 80% chance of damaging wind over 30y; extreme-heat days projected 7→16/yr by 2055 (HVAC capex compounding) — expect insurance premiums to compound above CPI over the hold.
Questions for the listing agent
- It's been on market 133 days. Have you received any prior offers? Is the seller open to a 12% concession, seller financing, or rate buy-down credit?
- Built in 1945 — when were the roof, HVAC, electrical panel, plumbing, and water heater last replaced?
- Why hasn't it sold? Are there any deal-killer items the seller is aware of (foundation, flood, title, zoning, code violations)?
- Is there a deadline driving the sale (1031 exchange, divorce, estate, relocation)? That informs how much negotiation room exists.
- Schools are B-rated — typically a magnet for longer-tenancy family renters. What's the average tenant stay here, and is there a school-zone premium baked into asking?
- Crime grade is F in this area — have there been break-ins, vandalism, or insurance claims at this property in the last 3 years? What carrier currently insures it and at what premium?
- What's the average days-on-market for RENTAL listings here right now (not sales)? A rising rental-DOM trend means longer vacancies and softer asking-rent achievability than the comps imply.
- What's the recent tenant-quality profile in this submarket — average credit score on applications, eviction rate, late-payment / NSF rate, and stable-employment percentage? A property-management company in the area should have these aggregated.
- How much new apartment / multifamily construction is in the pipeline within 1–3 miles? Heavy new supply (>2% of stock underway) typically softens rents 12–24 months out; light construction supports rent growth.
Investment metrics
- 1% rule
- 1.65% ✓
- Cap rate
- 14.21%
- Cash-on-cash
- 28.28%
- DSCR
- 2.26
- GRM
- 5.1
CMA / ARV
- ARV (on-the-fly)
- $579,600
- Comps found
- 4
Show comp detail 4 sales within ~0.75 mi
| Address | Dist | Beds/Ba | Sqft | Sold | Price | $/sf | Match |
|---|---|---|---|---|---|---|---|
| 15-05 Beach 11 St | 0.03mi | 4/2.0 | 1,444 (+5%) | 0mo | $542,000 | $375 | 90 |
| 1507 Beach 11th St | 0.03mi | 5/2.0 (+1) | 1,430 (+4%) | 6mo | $600,000 | $420 | 83 |
| 14-11 Chandler St | 0.44mi | 4/2.0 | 1,564 (+13%) | 4mo | $665,000 | $425 | 54 |
| 2202 Loretta Rd | 0.67mi | 4/3.0 | 1,440 (+4%) | 7mo | $510,000 | $354 | 51 |
Match score weights: distance 35% · size 25% · config 20% · recency 20%. Top-matched comps best support the ARV.
Projected returns pro-forma
-3.0% appreciation · 3.0% rent growth · sell at horizon
- IRR
- 22.5%
- Equity multiple
- 1.92×
- Total profit
- $90,366
- Equity at exit
- $52,186
- IRR
- 30.5%
- Equity multiple
- 3.74×
- Total profit
- $268,032
- Equity at exit
- $30,262
Cash invested: $98,000 (down + closing). Projections, not guarantees.
Landlord ↔ Tenant lean methodology
- Overall (CITY)
- 0 Strongly Tenant-Friendly
- State New York
- 15 Strongly Tenant-Friendly · D+10
- County
- — inherits STATE
- City New York
- 0 Strongly Tenant-Friendly · D+34
ZIP-level market 11691
- Active inventory
- 137
- Price-to-rent
- 10.1×
Monthly cashflow live
- Estimated rent
- $5,770 medium interval (Pro) →
- Mortgage (P&I)
- −$1,835
- Tax from tax record
- −$267 /mo · $3,209/yr
- Insurance
- −$146
- HOA
- −$0
- Vacancy / Maint / Mgmt
- −$1,212
- Net cashflow
- $2,310
Break-even live
Sensitivity live
| Price | -10% $2,508 | -5% $2,409 | +0% $2,310 | +5% $2,211 | +10% $2,111 |
|---|---|---|---|---|---|
| Rent | -10% $1,854 | -5% $2,082 | +0% $2,310 | +5% $2,538 | +10% $2,765 |
| Rate | -1.0pp $2,486 | -0.5pp $2,399 | base $2,310 | +0.5pp $2,219 | +1.0pp $2,127 |
2-unit breakdown (identical units grouped — click to expand)
| Units | Beds | Baths | Est. rent |
|---|---|---|---|
| 2× units | 2 | 1 | $5,770 |
| #1 | 2 | 1 | $2,885 |
| #2 | 2 | 1 | $2,885 |
| Total (2 units) | $5,770 | ||
UW: 25.0% down · 7.5% · 30yr · 1.5% tax · 5.0% vac · 8.0% maint · 8.0% mgmt
Financing live
Cash to close
- Down payment
- $87,500
- Closing costs
- $10,500
- Reserves months
- —
- Total cash needed
- —
Loan-product check · same deal, 3 products live
Conventional
25% down · 7.5% · 30yr
- Down + closing
- —
- Monthly P&I
- —
- Monthly cashflow
- —
- DSCR
- —
- Eligible?
- —
Personal DTI + credit; lowest rate.
DSCR
20% down · 8.5% · 30yr
- Down + closing
- —
- Monthly P&I
- —
- Monthly cashflow
- —
- DSCR
- —
- Eligible?
- —
No personal income docs; deal must DSCR.
Hard money
10% down · 12.0% · 12mo
- Down + closing
- —
- Monthly P&I
- —
- Monthly cashflow
- —
- DSCR
- —
- Eligible?
- —
Short-term bridge; refi at stabilization.
Rent comps 3 comps
| Address | Beds | Baths | Sqft | Rent | $/sqft | DOM | Units | Dist |
|---|---|---|---|---|---|---|---|---|
| 11 Bayview Ave Inwood, NY | 3.0 | 2.0 | 1246 | $4,500 | $3.61 | 25d | 1 | 0.18mi |
| 13-15 Heyson Rd Unit 2 Far Rockaway, NY | 3.0 | 1.0 | 1200 | $3,600 | $3.00 | 19d | 1 | 1.11mi |
| 324 Buckingham Rd Cedarhurst, NY | 3.0 | 2.0 | 1583 | $7,000 | $4.42 | 13d | 1 | 1.22mi |
Listing history 7 events
-
2024-11-04soldstatus $479,272
-
2023-06-12status Pending
-
2023-01-30$350,000 Active
-
2015-07-29historical
-
2015-01-20$239,000
-
2007-10-26soldstatus $370,737
-
2003-09-10soldstatus $190,000
ⓘ Source: listings_history table (triggers on properties + properties_extension) + one-shot
backfill from property_details.listing_events for pre-trigger history.
Tax reassessment forecast NY · Partial reset (capped growth)
- Current annual tax
- $3,209 · $267/mo
- Projected year-2 tax
- $4,562 · $380/mo
- Expected delta
- +$1,353/yr (+$113/mo · 42.2%)
ⓘ Screening estimate from a state-policy table — verify with the county assessor before closing.
Climate risk First Street
- Flood 6/10 Major FEMA zone X (shaded) · 73% chance over 30 yrs
- Wildfire 1/10 Low
- Heat 6/10 Major 7 d/yr ≥95°F today · 16 d/yr by 30 yrs out
- Wind 8/10 Severe 80% chance of damaging wind over 30 yrs
- Air quality 4/10 Moderate 4 unhealthy d/yr today · 6 by 30 yrs out
Nearby sold comps map
Loading sold comps map…
Walkable amenities ~0.75 mi
Loading nearby amenities…
Taxation est. · year 1
- Rental income
- $69,240
- − Mortgage interest
- −$19,605
- − Property taxes
- −$3,209
- − Insurance
- −$1,750
- − Repairs & maintenance
- −$5,539
- − Management
- −$5,539
- − Depreciation
- −$10,182
- Taxable income
- $23,415
- Est. tax owed @ 24.0%
- −$5,620
- After-tax cash flow
- $22,095/yr
For passive investors: Depreciation is non-cash, so a rental often shows a tax loss while cash-flowing — sheltering income. Rental losses are passive: they offset passive income freely, and up to $25,000/yr can offset ordinary (W-2) income if you actively participate and your MAGI is under $100k (phasing out to $0 by $150k); unused losses carry forward. On sale, claimed depreciation is recaptured at up to 25%, and gains may owe capital-gains tax (a 1031 exchange can defer both). Figures are a year-1 estimate at your 24.0% rate — not tax advice; consult a CPA.
Schools (NCES district)
No district data.
Livability — New York
- Score
- 75/100
- State rank
- #268
- US rank
- #4188
Category grades
Schools grade is shown separately in the Schools card above.
Census & demographics
- Census place
- New York, NY
- County
- Queens County · 1,914,869 people
- City population
- 7,731,280
- Metro
- New York-Newark-Jersey City, NY-NJ-PA
- Population (ZIP)
- 69,359
- Household income
- $56,135
- Rent vs Own
- Severe rent burden
- 4702.0
Population outlook (Queens County) Hauer SSP2
- Today (2025)
- 2,546,320 people
- By 2030
- 2,643,059 · +3.8%
- By 2040
- 2,815,563 · +10.6%
- By 2050
- 2,944,423 · +15.6%
- By 2075
- 3,123,338 · +22.7%
- By 2100
- 3,098,688 · +21.7%
Race, ethnicity, and origin ACS 2023
- Neighborhood character
- Highly diverse neighborhood (Simpson 0.71)
- Race & ethnicity
- Black 40% Hispanic / Latino 26% White 24% Two or more races 12% Asian 4%
- Hispanic origin (detail)
- Puerto Rican 4% Dominican 5%
- Common ancestry
- Hispanic 3% Italian 2% Romanian 2%
- Foreign-born
- 35% · Canada, China, Jamaica
- Languages at home
- 66% English-only · Spanish 21% French/Haitian/Cajun 2% Russian/Polish/Slavic 2%
Political lean MEDSL · Queens
- 2024 margin
- Strong D (+24.6) · D 62.3% · R 37.7%
- 2008→2024 swing
- -26.2pp toward R · 2008: 50.8pp · 2024: 24.6pp
- All cycles
- 2024: D+24.6 2020: D+45.2 2016: D+53.4 2012: D+58.5 2008: D+50.8
Not yet ingested
- Civics
- —
Market trends
- HPI YoY
- ▼ -397.66%
- Current HPI
- 281.4044
- Rent YoY
- —
- Metro
- New York-Newark-Jersey City, NY-NJ-PA
- State GDP YoY
- ▲ 2.60%
- F500 in state
- 92
Industry mix (Fortune 500 HQ in NY)
| Industry | F500 HQs | Revenue |
|---|---|---|
| Financial Services | 10 | $950B |
|
||
| Consumer Goods | 9 | $162B |
|
||
| Insurance | 4 | $225B |
|
||
| Telecommunications | 2 | $144B |
|
||
| Pharmaceuticals | 2 | $112B |
|
||
| Media / Entertainment | 2 | $69B |
|
||
Price history
+152.2% since first listed7 events — show timeline
- 2024-11-04 Sold (Public Records) $479,272 Public Records
- 2023-06-12 Pending — OneKey® MLS as Distributed by MLS Grid
- 2023-01-30 Listed $350,000 OneKey® MLS as Distributed by MLS Grid
- 2015-07-29 Listing Removed — OneKey® MLS as Distributed by MLS Grid
- 2015-01-20 Listed $239,000 OneKey® MLS as Distributed by MLS Grid
- 2007-10-26 Sold (Public Records) $370,737 Public Records
- 2003-09-10 Sold (Public Records) $190,000 Public Records
Property tax history
+5.4%/yrLatest (2025): $3,209 · +3.3% YoY. Source: county tax records.
Cash-flow waterfall
monthlySold comps — $/sqft
last 12 mo · ≤1 miLoading sold comps…