 🏗️ New Construction
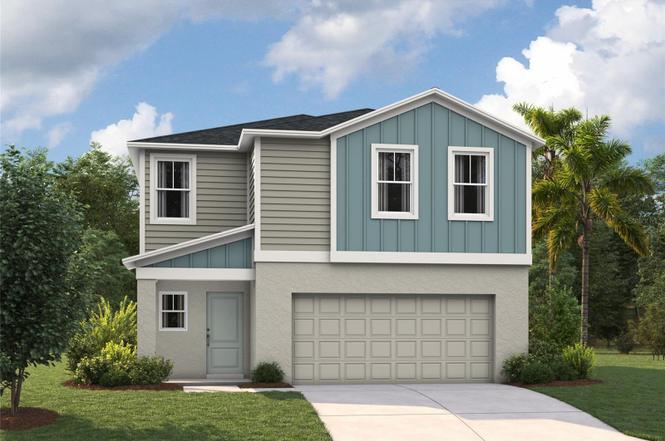
4410 Riverbend Blvd · Haines City, FL
Flood risk 1/10 · Minimal
- FEMA flood zone
- X (unshaded)
- Chance of flooding over 30 yrs
- 0.0%
- Est. flood insurance / yr
- $507 – $1,088
Fire risk 5/10 · Moderate
- Est. fire insurance / yr
- $947 – $1,759
Heat risk 8/10 · Major
- Hot days now (above 108°F)
- 7 days/yr
- Hot days in 30 yrs
- 24 days/yr
Wind risk 10/10 · Severe
- Chance of severe wind over 30 yrs
- 99.0%
Air-quality risk 2/10 · Minimal
- Unhealthy air days now
- 0 days/yr
- Unhealthy air days in 30 yrs
- 1 days/yr
Risk factors via First Street. Map © Google.
Why this score? — see what drove the F grade
The composite is a weighted blend of 9 inputs, each scored 0–100. Each bar is that input's sub-score; the figure is the points it added to the 100-point composite (weight × sub-score).
- ARV discount +7.5/15.0
- Cash flow +7.1/30.0
- Livability +3.7/5.0
- Schools +3.5/10.0
- Rent growth +2.8/5.0
- Condition / age +2.5/5.0
- 1% rule +2.0/10.0
- DSCR +1.3/10.0
- Appreciation +0.0/10.0
$334,999
🖨 Deal sheet 📄 Offer letter ✓ Due diligence
Listing remarks
One or more photo(s) has been virtually staged. Under Construction. BELOW MARKET INTEREST RATES with use of Seller's Preferred Lender. The Turquesa is the ultimate family haven, a two-story home featuring 4 bedrooms, 2.5 bathrooms and a private 2-car garage. This home offers an open concept living space designed for both relaxation and entertainment. The half bathroom off the foyer ensures every guest feels at home while the extended foyer opens to the main living and dining area. Featuring luxury vinyl plank flooring and convenient indoor-outdoor living with a lanai through sliding glass doors, it’s a haven of comfort and style perfect for gatherings. The kitchen includes stunning qu
Key facts
- Extended foyer
- 4,400 sq ft lot
- 2 garage spots
Tags
Neighborhood map
What this means for you Summary
Snapshot
- This is a 4-bed/2.5-bath land listed at $335k.
Deal economics
- At list price, monthly cash flow is $-476 ($-6k/yr) — negative.
- To cash-flow at today's rent, offer at most $266k (20.6% below list).
- To meet the 1% rule (rent ≥ 1% of price), the offer needs to be $236k (29.6% below list).
- Recommended offer: $236k (29.6% below list) — sets the bar for 1% rule.
Location & tenants
- Location reads 74/100 on livability (#285 in FL, #4,575 nationally) — a middle-class / working-renter tenant base. Strengths: crime A+, cost of living A+, housing A+; Watch: amenities F, commute F, employment F.
- Polk (suburban): math 39% / reading 43% proficiency, ranked #62 of 73 in FL (top 85%) — families likely to look elsewhere, expect single-tenant / working-renter base with shorter leases.
- Zoned schools: Eastside Elementary School (math 33% / reading 29%, grade F, #1,854 of 2,144 statewide, top 87%, 615 students, 66% FRL); Ridge Community High School (math 12% / reading 33%, grade F, #539 of 667 statewide, top 81%, 2,711 students, 48% FRL) — zoned schools at 57% FRL track the district average.
- Zoned-school proficiency averages 27% at this address vs 41% district-wide (-14 pts) — the specific schools serving this property underperform the Polk average; the district grade overstates school quality for this exact location.
- Market conditions: Rents rising (+1.2%/yr); 1333 active listings in the ZIP; 40 comparable units currently listed for rent nearby; rentals at typical pace (median 24d on market — plan ~3-4 weeks tenant-placement turnaround); 10,384 units permitted in Polk County in 2024 (1,716 in 5+ unit buildings).
- This rent runs 44% of the median local income ($64k/yr) — at the standard rent-burdened threshold; future hikes will face affordability resistance.
Forward outlook
- Local home prices are declining (-3.0%/yr); year-one equity from $2k of loan paydown is wiped out by about $10k of value loss. Plan a longer hold.
- Polk County population projected at +33% by 2050 — long-run rental-demand tailwind backs the buy-and-hold thesis.
Negotiation context
- Only 8 days on market — expect competitive offers; lowballing is unlikely to land.
Risks & watch-outs
- Climate carrying-cost: severe wind risk, 99% chance of damaging wind over 30y; moderate wildfire risk; extreme-heat days projected 7→24/yr by 2055 (HVAC capex compounding) — expect insurance premiums to compound above CPI over the hold.
Questions for the listing agent
- What do current leases actually rent for vs. the listed asking? Can we see a recent rent roll and the last 12 months of T-12 income?
- What does the HOA fee cover, when was the last increase, and are there any pending special assessments or reserve-fund shortfalls?
- Is there a deadline driving the sale (1031 exchange, divorce, estate, relocation)? That informs how much negotiation room exists.
- Schools are D-rated, which usually means shorter tenancies and higher turnover. Who's the typical renter profile here, and what's been the actual vacancy rate?
- The area grade is low — what's the realistic commute time and amenity access for the typical tenant pool here? Any planned neighborhood developments (good or bad) we should know about?
- What's the average days-on-market for RENTAL listings here right now (not sales)? A rising rental-DOM trend means longer vacancies and softer asking-rent achievability than the comps imply.
- What's the recent tenant-quality profile in this submarket — average credit score on applications, eviction rate, late-payment / NSF rate, and stable-employment percentage? A property-management company in the area should have these aggregated.
- How much new for-sale + rental construction is in the pipeline within 1–3 miles? Heavy new supply typically softens prices + rents 12–24 months out; constrained supply supports both.
Investment metrics
- 1% rule
- 0.70% ✗
- Cap rate
- 4.59%
- Cash-on-cash
- -6.09%
- DSCR
- 0.73
- GRM
- 11.8
CMA / ARV
No comps found within radius.
Projected returns pro-forma
-3.0% appreciation · 1.16% rent growth · sell at horizon
- IRR
- -28.8%
- Equity multiple
- 0.05×
- Total profit
- $-88,833
- Equity at exit
- $49,949
- IRR
- -38.0%
- Equity multiple
- -0.42×
- Total profit
- $-133,142
- Equity at exit
- $28,965
Cash invested: $93,800 (down + closing). Projections, not guarantees.
Landlord ↔ Tenant lean methodology
- Overall (STATE)
- 87 Strongly Landlord-Friendly
- State Florida
- 87 Strongly Landlord-Friendly · R+3
- County
- — inherits STATE
- City
- — inherits STATE
ZIP-level market 33844
- Home prices YoY
- -26.7%
- Rents YoY
- 1.2%
- Active inventory
- 1333
- Price-to-rent
- 11.8×
Monthly cashflow live
- Estimated rent
- $2,360 high interval (Pro) →
- Mortgage (P&I)
- −$1,757
- Tax est. 1.5%
- −$419 /mo · $5,025/yr
- Insurance
- −$140
- HOA
- −$25
- Vacancy / Maint / Mgmt
- −$496
- Net cashflow
- $-476
Break-even live
UW: 25.0% down · 7.5% · 30yr · 1.5% tax · 5.0% vac · 8.0% maint · 8.0% mgmt
Financing live
Cash to close
- Down payment
- $83,750
- Closing costs
- $10,050
- Reserves months
- —
- Total cash needed
- —
Loan-product check · same deal, 3 products live
Conventional
25% down · 7.5% · 30yr
- Down + closing
- —
- Monthly P&I
- —
- Monthly cashflow
- —
- DSCR
- —
- Eligible?
- —
Personal DTI + credit; lowest rate.
DSCR
20% down · 8.5% · 30yr
- Down + closing
- —
- Monthly P&I
- —
- Monthly cashflow
- —
- DSCR
- —
- Eligible?
- —
No personal income docs; deal must DSCR.
Hard money
10% down · 12.0% · 12mo
- Down + closing
- —
- Monthly P&I
- —
- Monthly cashflow
- —
- DSCR
- —
- Eligible?
- —
Short-term bridge; refi at stabilization.
Rent comps 40 comps
| Address | Beds | Baths | Sqft | Rent | $/sqft | DOM | Units | Dist |
|---|---|---|---|---|---|---|---|---|
| 4757 Katrina Dr Haines City, FL | 4.0 | 2.0 | 2451 | $2,050 | $0.84 | 23d | 1 | 0.16mi |
| 4746 Katrina Dr Haines City, FL | 4.0 | 2.0 | 1818 | $2,095 | $1.15 | 23d | 1 | 0.18mi |
| 4770 Katrina Dr Haines City, FL | 3.0 | 2.0 | 2109 | $2,000 | $0.95 | 23d | 1 | 0.21mi |
| 5161 Green Belt Dr Haines City, FL | 4.0 | 2.5 | 2500 | $2,100 | $0.84 | 23d | 1 | 0.22mi |
| 5157 Green Belt Dr Haines City, FL | 4.0 | 3.0 | 2109 | $2,900 | $1.38 | 3d | 1 | 0.23mi |
| 5153 Green Belt Dr Haines City, FL | 4.0 | 2.0 | 1824 | $2,300 | $1.26 | 14d | 1 | 0.23mi |
| 5177 Green Belt Dr Haines City, FL | 4.0 | 3.0 | 2109 | $2,920 | $1.38 | 3d | 1 | 0.24mi |
| 4813 Katrina Dr Haines City, FL | 4.0 | 2.0 | 2000 | $2,000 | $1.00 | 23d | 1 | 0.26mi |
| 5193 Green Belt Dr Haines City, FL | 4.0 | 2.0 | 1824 | $2,099 | $1.15 | 23d | 1 | 0.27mi |
| 3754 King Hill Dr Haines City, FL | 3.0 | 2.5 | 1720 | $1,800 | $1.05 | 23d | 1 | 0.35mi |
| 4156 Hummock Pl Haines City, FL | 3.0 | 2.5 | 1548 | $1,850 | $1.20 | 23d | 1 | 0.36mi |
| 5009 Katrina Dr Haines City, FL | 4.0 | 2.0 | 1840 | $2,500 | $1.36 | 23d | 1 | 0.37mi |
| 914 Princess Sabal Pt Haines City, FL | 3.0 | 2.0 | 1677 | $1,775 | $1.06 | 14d | 1 | 0.42mi |
| 4034 Old Mill Rd Haines City, FL | 5.0 | 2.5 | 2326 | $2,400 | $1.03 | 3d | 1 | 0.52mi |
| 1433 Princess Tree Ct Haines City, FL | 4.0 | 2.0 | 1828 | $1,999 | $1.09 | 23d | 1 | 0.55mi |
| 3874 Amers Loop Haines City, FL | 4.0 | 2.5 | 1874 | $2,130 | $1.14 | 3d | 1 | 0.57mi |
| 3898 Amers Loop Haines City, FL | 4.0 | 2.5 | 1874 | $2,150 | $1.15 | 23d | 1 | 0.57mi |
| 3910 Amers Loop Haines City, FL | 5.0 | 2.5 | 2112 | $2,600 | $1.23 | 23d | 1 | 0.57mi |
| 144 Towns Cir Haines City, FL | 5.0 | 3.0 | 2712 | $2,600 | $0.96 | 23d | 1 | 0.71mi |
| 2203 Pigeon Plum Dr Haines City, FL | 4.0 | 3.0 | 1887 | $2,190 | $1.16 | 10d | 1 | 0.75mi |
| 333 Hidden Lake Loop Haines City, FL | 4.0 | 2.0 | 1909 | $1,985 | $1.04 | 11d | 1 | 0.75mi |
| 202 Hidden Lake Loop Haines City, FL | 4.0 | 2.0 | 1981 | $1,905 | $0.96 | 11d | 1 | 0.78mi |
| 148 Summerlin Loop Haines City, FL | 3.0 | 2.0 | 1579 | $1,850 | $1.17 | 14d | 1 | 0.79mi |
| 621 Sand Pine Ln Haines City, FL | 4.0 | 2.5 | 2040 | $2,350 | $1.15 | 10d | 1 | 0.82mi |
| 1361 Current Pl Haines City, FL | 4.0 | 2.0 | 1630 | $2,100 | $1.29 | 23d | 1 | 0.82mi |
| 167 Hidden Lake Loop Haines City, FL | 4.0 | 2.0 | 1981 | $2,020 | $1.02 | 19d | 1 | 0.82mi |
| 117 Hidden Lake Loop Haines City, FL | 4.0 | 2.5 | 2099 | $2,085 | $0.99 | 23d | 1 | 0.83mi |
| 120 Hidden Lake Loop Haines City, FL | 4.0 | 2.0 | 1909 | $2,020 | $1.06 | 14d | 1 | 0.84mi |
| 1462 Sea Glass Rd Haines City, FL | 4.0 | 2.5 | 2168 | $2,200 | $1.01 | 23d | 1 | 0.89mi |
| 1138 Foreshore Ln Haines City, FL | 3.0 | 2.0 | 1734 | $2,200 | $1.27 | 23d | 1 | 0.90mi |
| 1276 Tupelo Trl Haines City, FL | 4.0 | 3.0 | 1900 | $1,895 | $1.00 | 11d | 1 | 0.91mi |
| 1950 Pond Pine Ct Haines City, FL | 4.0 | 2.0 | 1939 | $1,975 | $1.02 | 23d | 1 | 0.93mi |
| 600 Silver Palm Dr Haines City, FL | 4.0 | 2.5 | 2267 | $2,800 | $1.24 | 10d | 1 | 0.99mi |
| 239 Summerlin Ln Haines City, FL | 4.0 | 2.0 | 2168 | $2,300 | $1.06 | 23d | 1 | 0.99mi |
| 429 Silver Palm Dr Haines City, FL | 4.0 | 2.0 | 1625 | $1,990 | $1.22 | 19d | 1 | 1.03mi |
| 1105 Lexington Ln Haines City, FL | 4.0 | 2.0 | 2123 | $1,995 | $0.94 | 19d | 1 | 1.12mi |
| 299 Bottle Brush Dr Haines City, FL | 4.0 | 2.0 | 1763 | $2,300 | $1.30 | 23d | 1 | 1.12mi |
| 601 Ambleside Dr Haines City, FL | 5.0 | 3.0 | 2827 | $2,600 | $0.92 | 23d | 1 | 1.14mi |
| 1364 Conch Key Ln Davenport, FL | 3.0 | 2.0 | 1485 | $2,150 | $1.45 | 3d | 1 | 1.15mi |
| 219 Bottle Brush Dr Haines City, FL | 4.0 | 3.0 | 2420 | $2,450 | $1.01 | 23d | 1 | 1.19mi |
HOA detail
- Monthly dues
- $25 · $300/yr
Listing history 3 events
-
2026-03-20status Pending
-
2026-03-18price $334,999
-
2026-03-12$337,339 Active
ⓘ Source: listings_history table (triggers on properties + properties_extension) + one-shot
backfill from property_details.listing_events for pre-trigger history.
Climate risk First Street
- Flood 1/10 Low FEMA zone X (unshaded) · 0% chance over 30 yrs
- Wildfire 5/10 Major
- Heat 8/10 Severe 7 d/yr ≥108°F today · 24 d/yr by 30 yrs out
- Wind 10/10 Extreme 99% chance of damaging wind over 30 yrs
- Air quality 2/10 Low 0 unhealthy d/yr today · 1 by 30 yrs out
Nearby sold comps map
Loading sold comps map…
Walkable amenities ~0.75 mi
Loading nearby amenities…
Taxation est. · year 1
- Rental income
- $28,317
- − Mortgage interest
- −$18,765
- − Property taxes
- −$5,025
- − Insurance
- −$1,675
- − Repairs & maintenance
- −$2,265
- − Management
- −$2,265
- − HOA
- −$300
- − Depreciation
- −$9,745
- Taxable loss
- −$11,724
- Est. tax savings @ 24.0%
- +$2,814
- After-tax cash flow
- $-2,897/yr
For passive investors: Depreciation is non-cash, so a rental often shows a tax loss while cash-flowing — sheltering income. Rental losses are passive: they offset passive income freely, and up to $25,000/yr can offset ordinary (W-2) income if you actively participate and your MAGI is under $100k (phasing out to $0 by $150k); unused losses carry forward. On sale, claimed depreciation is recaptured at up to 25%, and gains may owe capital-gains tax (a 1031 exchange can defer both). Figures are a year-1 estimate at your 24.0% rate — not tax advice; consult a CPA.
Schools (NCES district)
- District
- Polk
- NCES district ID
- 1201590
- Math proficiency
- 39% ▼ -11.00%
- Reading proficiency
- 43% ▼ -4.00%
- Median HH income
- $43,979
- Composite
- 34.74/100
- National rank
- #5132
- State rank
- #62 of 73 in FL
Livability — Haines City
- Score
- 74/100
- State rank
- #285
- US rank
- #4575
Category grades
Schools grade is shown separately in the Schools card above.
Census & demographics
- Census place
- Haines City, FL
- County
- Polk County · 740,051 people
- City population
- 51,255
- Metro
- Lakeland-Winter Haven, FL
- Population (ZIP)
- 51,255
- Household income
- $63,650
- Rent vs Own
- Severe rent burden
- 1107.0
Population outlook (Polk County) Hauer SSP2
- Today (2025)
- 752,975 people
- By 2030
- 804,621 · +6.9%
- By 2040
- 906,117 · +20.3%
- By 2050
- 1,000,476 · +32.9%
- By 2075
- 1,197,520 · +59.0%
- By 2100
- 1,271,518 · +68.9%
Race, ethnicity, and origin ACS 2023
- Neighborhood character
- Diverse neighborhood (Simpson 0.64)
- Race & ethnicity
- Hispanic / Latino 48% White 31% Black 18% Two or more races 12% Asian 1%
- Hispanic origin (detail)
- Mexican 19% Puerto Rican 19% Cuban 1% Dominican 3%
- Common ancestry
- Hispanic 4% Lithuanian 1% Romanian 1%
- Foreign-born
- 15% · Canada, Jamaica, Guatemala
- Languages at home
- 55% English-only · Spanish 39% French/Haitian/Cajun 4% Other Indo-European 0%
Political lean MEDSL · Polk
- 2024 margin
- Strong R (+20.7) · D 39.2% · R 59.9%
- 2008→2024 swing
- -14.6pp toward R · 2008: -6.1pp · 2024: -20.7pp
- All cycles
- 2024: R+20.7 2020: R+14.4 2016: R+14.1 2012: R+6.8 2008: R+6.1
Not yet ingested
- Civics
- —
Market trends
- HPI YoY
- ▼ -105.94%
- Current HPI
- 291.0798
- Rent YoY
- ▲ 1.16%
- Metro
- Lakeland-Winter Haven, FL
- State GDP YoY
- ▲ 3.28%
- F500 in state
- 36
Industry mix (Fortune 500 HQ in FL)
| Industry | F500 HQs | Revenue |
|---|---|---|
| Industrial Technology | 2 | $29B |
|
||
| Insurance | 2 | $17B |
|
||
| Retail | 1 | $60B |
|
||
| Technology Distribution | 1 | $58B |
|
||
| Homebuilding | 1 | $35B |
|
||
| Technology Manufacturing | 1 | $35B |
|
||
Price history
-0.7% since first listed3 events — show timeline
- 2026-03-20 Pending — Stellar MLS as Distributed by MLS Grid
- 2026-03-18 Price Changed $334,999 Stellar MLS as Distributed by MLS Grid
- 2026-03-12 Listed $337,339 Stellar MLS as Distributed by MLS Grid
Cash-flow waterfall
monthlySold comps — $/sqft
last 12 mo · ≤1 miLoading sold comps…