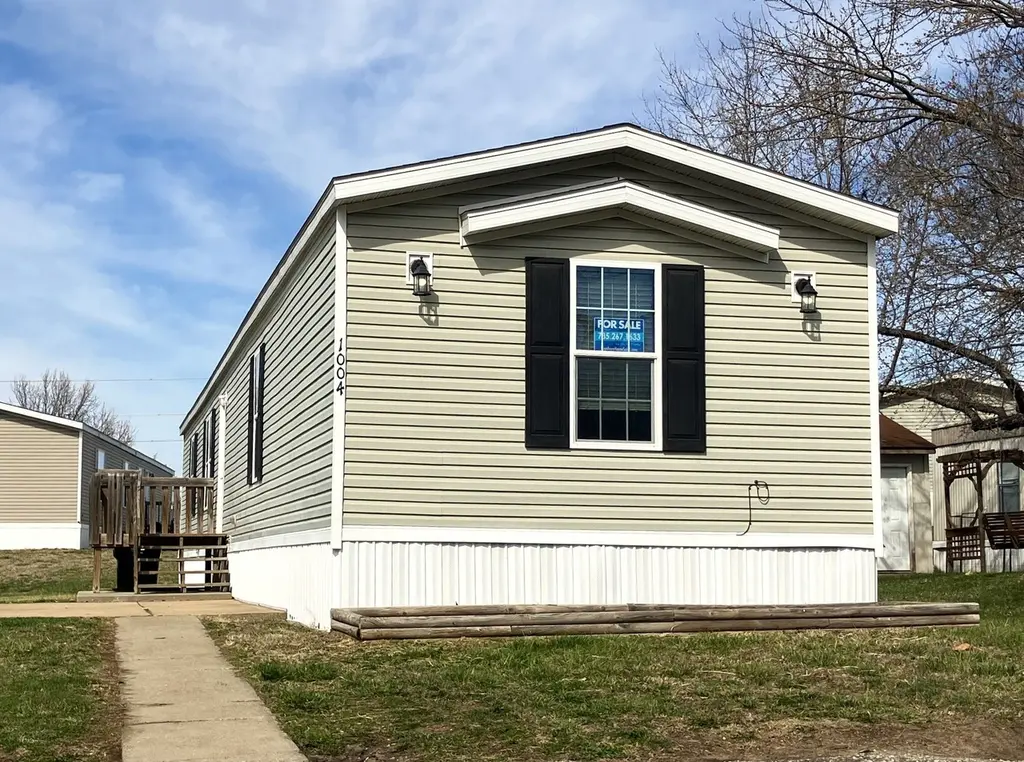
1004 SE 42nd St #820 · Topeka, KS
Flood risk 1/10 · Minimal
- FEMA flood zone
- X (unshaded)
- Chance of flooding over 30 yrs
- 0.0%
- Est. flood insurance / yr
- $507 – $1,088
Fire risk 4/10 · Minor
- Est. fire insurance / yr
- $1,154 – $2,142
Heat risk 4/10 · Minor
- Hot days now (above 108°F)
- 7 days/yr
- Hot days in 30 yrs
- 17 days/yr
Wind risk 2/10 · Minimal
- Chance of severe wind over 30 yrs
- —
Air-quality risk 3/10 · Minor
- Unhealthy air days now
- 3 days/yr
- Unhealthy air days in 30 yrs
- 4 days/yr
Risk factors via First Street. Map © Google.
Why this score? — see what drove the B grade
The composite is a weighted blend of 9 inputs, each scored 0–100. Each bar is that input's sub-score; the figure is the points it added to the 100-point composite (weight × sub-score).
- Cash flow +30.0/30.0
- 1% rule +10.0/10.0
- DSCR +10.0/10.0
- ARV discount +7.5/15.0
- Condition / age +4.0/5.0
- Livability +3.5/5.0
- Schools +2.7/10.0
- Rent growth +2.5/5.0
- Appreciation +0.0/10.0
$36,200
🖨 Deal sheet (PDF) 📄 Offer letter ✓ Due diligence
Listing remarks
* THIS IS A RESALE LISTING * This welcoming, well-maintained 3 bedroom, 2 bathroom home is a perfect place to raise your family. For your convenience, we have onsite community management to assist you when you need it. With our family-friendly community amenities such as a clubhouse, a picnic area / pavilion / grill, and a swimming pool, your family will be excited to live here. This home won't be on the market long, so call us today for more information or to schedule a tour. Deposits & Fees are subject to change.
Key facts
- Built 2026
- Listed 60 days
Property features AI
Finance
- Other: List price $35,700; Plan name 91398
- Financial info: Listed as active
Exterior
- Utilities: Natural gas; Central air
- Home design: Condominium (unit address: 1004 SE 42nd St #820, Topeka, KS); Spec model
- Exterior features: Living area 1,216
Interior
- Bedrooms: 3 bedrooms
- Bathrooms: 2 full bathrooms
- Heating & cooling: Natural gas heating; Central air conditioning
- Interior features: 2 total bathrooms
Neighborhood map
What this means for you Summary
Snapshot
- This is a 3-bed/2.0-bath manufactured listed at $36k. Condition is rated good.
Deal economics
- At list price, monthly cash flow is $556 ($7k/yr) — positive.
- The deal already cash-flows at list — no discount required.
- Meets the 1% rule at list price ($1k rent vs $36k).
- Recommended offer: $35k (3.0% below list) — sets the bar for market timing.
- Cap rate 24.7% vs local median 4.3% in Topeka — top-decile yield for the area; either an underpriced asset or a hidden risk that comps aren't pricing in. Stress-test before assuming the spread holds.
Location & tenants
- Location reads 69/100 on livability (#195 in KS) — a middle-class / working-renter tenant base. Strengths: cost of living A+, housing A+, health & safety A+; Watch: employment C-, schools D-, crime F.
- Shawnee Heights (rural): math 27% / reading 30% proficiency, ranked #90 of 169 in KS (top 53%) — low school quality limits family demand, transient renter base, plan for 1-2y turnover.
- Market conditions: 39 active listings in the ZIP; 6 comparable units currently listed for rent nearby; rentals at typical pace (median 22d on market — plan ~3-4 weeks tenant-placement turnaround); 219 units permitted in Shawnee County in 2024 (25 in 5+ unit buildings).
Forward outlook
- Local home prices are declining (-3.0%/yr); year-one equity from $250 of loan paydown is wiped out by about $1k of value loss. Plan a longer hold.
- Shawnee County population projected to shrink 7% by 2050 — rents likely to lag national; underwrite the cash flow, not the appreciation.
- At projected returns (-3.0% appreciation + 3.0% rent growth), your $10k cash investment doubles in ~2 years — after that, you're playing with house money.
Negotiation context
- It's been on market 60 days — a 3% lower offer ($35k) is reasonable based on typical stale-listing flexibility.
Questions for the listing agent
- It's been on market 60 days. Have you received any prior offers? Is the seller open to a 3% concession, seller financing, or rate buy-down credit?
- Is there a deadline driving the sale (1031 exchange, divorce, estate, relocation)? That informs how much negotiation room exists.
- Schools are D-rated, which usually means shorter tenancies and higher turnover. Who's the typical renter profile here, and what's been the actual vacancy rate?
- Crime grade is F in this area — have there been break-ins, vandalism, or insurance claims at this property in the last 3 years? What carrier currently insures it and at what premium?
- What's the average days-on-market for RENTAL listings here right now (not sales)? A rising rental-DOM trend means longer vacancies and softer asking-rent achievability than the comps imply.
- What's the recent tenant-quality profile in this submarket — average credit score on applications, eviction rate, late-payment / NSF rate, and stable-employment percentage? A property-management company in the area should have these aggregated.
- How much new for-sale + rental construction is in the pipeline within 1–3 miles? Heavy new supply typically softens prices + rents 12–24 months out; constrained supply supports both.
Investment metrics
- 1% rule
- 2.82% ✓
- Cap rate
- 24.73%
- Cash-on-cash
- 65.85%
- DSCR
- 3.93
- GRM
- 3.0
CMA / ARV
No comps found within radius.
Projected returns pro-forma
-3.0% appreciation · 3.0% rent growth · sell at horizon
- IRR
- 65.1%
- Equity multiple
- 3.92×
- Total profit
- $29,575
- Equity at exit
- $5,398
- IRR
- 69.4%
- Equity multiple
- 8.05×
- Total profit
- $71,432
- Equity at exit
- $3,130
Cash invested: $10,136 (down + closing). Projections, not guarantees.
Landlord ↔ Tenant lean methodology
- Overall (STATE)
- 83 Strongly Landlord-Friendly
- State Kansas
- 83 Strongly Landlord-Friendly · R+10
- County
- — inherits STATE
- City
- — inherits STATE
ZIP-level market 66609
- Home prices YoY
- -14.6%
- Active inventory
- 39
- Price-to-rent
- 3.0×
Monthly cashflow live
- Estimated rent
- $1,021 high interval (Pro) →
- Mortgage (P&I)
- −$190
- Tax est. 1.5%
- −$45 /mo · $543/yr
- Insurance
- −$15
- HOA
- −$0
- Vacancy / Maint / Mgmt
- −$214
- Net cashflow
- $556
Break-even live
Sensitivity live
| Price | -10% $581 | -5% $569 | +0% $556 | +5% $544 | +10% $531 |
|---|---|---|---|---|---|
| Rent | -10% $476 | -5% $516 | +0% $556 | +5% $597 | +10% $637 |
| Rate | -1.0pp $574 | -0.5pp $565 | base $556 | +0.5pp $547 | +1.0pp $537 |
UW: 25.0% down · 7.5% · 30yr · 1.5% tax · 5.0% vac · 8.0% maint · 8.0% mgmt
Financing live
Cash to close
- Down payment
- $9,050
- Closing costs
- $1,086
- Reserves months
- —
- Total cash needed
- —
Loan-product check · same deal, 3 products live
Conventional
25% down · 7.5% · 30yr
- Down + closing
- —
- Monthly P&I
- —
- Monthly cashflow
- —
- DSCR
- —
- Eligible?
- —
Personal DTI + credit; lowest rate.
DSCR
20% down · 8.5% · 30yr
- Down + closing
- —
- Monthly P&I
- —
- Monthly cashflow
- —
- DSCR
- —
- Eligible?
- —
No personal income docs; deal must DSCR.
Hard money
10% down · 12.0% · 12mo
- Down + closing
- —
- Monthly P&I
- —
- Monthly cashflow
- —
- DSCR
- —
- Eligible?
- —
Short-term bridge; refi at stabilization.
Rent comps 6 comps
| Address | Beds | Baths | Sqft | Rent | $/sqft | DOM | Units | Dist |
|---|---|---|---|---|---|---|---|---|
| 3729 SE Fremont St Topeka, KS | 3.0 | 1.5 | 1392 | $1,095 | $0.79 | 22d | 1 | 0.75mi |
| 3831 SW South Park Ave Unit D21 Topeka, KS | 3.0 | 2.0 | 1280 | $1,050 | $0.82 | 22d | 1 | 1.03mi |
| 3831 SW South Park Ave Unit 34 Topeka, KS | 2.0 | 2.0 | 840 | $950 | $1.13 | 22d | 1 | 1.04mi |
| 3317 SE Bryant St Topeka, KS | 3.0 | 1.0 | 1000 | $1,050 | $1.05 | 22d | 1 | 1.05mi |
| 3365 SE Girard St Topeka, KS | 2.0 | 1.0 | 1023 | $950 | $0.93 | 22d | 1 | 1.07mi |
| 4842 SW Topeka Blvd Topeka, KS | 2.0 | 2.0 | 840 | $950 | $1.13 | 22d | 1 | 1.47mi |
Listing history 9 events
-
2026-06-09days on market $36,200 Active 60 DOM
-
2026-06-08days on market $36,200 Active 59 DOM
-
2026-06-07days on market $36,200 Active 58 DOM
-
2026-06-05days on market $36,200 Active 55 DOM
-
2026-06-03days on market $36,200 Active 54 DOM
-
2026-06-02days on market $36,200 Active 53 DOM
-
2026-06-01pricedays on market $36,200 Active 52 DOM
-
2026-05-31days on market $35,700 Active 51 DOM
-
2026-05-30days on market $35,700 Active 50 DOM
ⓘ Source: listings_history table (triggers on properties + properties_extension) + one-shot
backfill from property_details.listing_events for pre-trigger history.
Climate risk First Street
- Flood 1/10 Low FEMA zone X (unshaded) · 0% chance over 30 yrs
- Wildfire 4/10 Moderate
- Heat 4/10 Moderate 7 d/yr ≥108°F today · 17 d/yr by 30 yrs out
- Wind 2/10 Low
- Air quality 3/10 Moderate 3 unhealthy d/yr today · 4 by 30 yrs out
Nearby sold comps map
Loading sold comps map…
Walkable amenities ~0.75 mi
Loading nearby amenities…
Taxation est. · year 1
- Rental income
- $12,249
- − Mortgage interest
- −$2,028
- − Property taxes
- −$543
- − Insurance
- −$181
- − Repairs & maintenance
- −$980
- − Management
- −$980
- − Depreciation
- −$1,053
- Taxable income
- $6,484
- Est. tax owed @ 24.0%
- −$1,556
- After-tax cash flow
- $5,118/yr
For passive investors: Depreciation is non-cash, so a rental often shows a tax loss while cash-flowing — sheltering income. Rental losses are passive: they offset passive income freely, and up to $25,000/yr can offset ordinary (W-2) income if you actively participate and your MAGI is under $100k (phasing out to $0 by $150k); unused losses carry forward. On sale, claimed depreciation is recaptured at up to 25%, and gains may owe capital-gains tax (a 1031 exchange can defer both). Figures are a year-1 estimate at your 24.0% rate — not tax advice; consult a CPA.
Condition & rehab AI · 12 photos
This well-maintained mobile home is move-in ready with new flooring, fixtures, and appliances. It offers a good return on investment with minor cosmetic upgrades for increased resale and rental value.
Value-add opportunities
- Both Painting exterior and interior walls — Enhances curb appeal and interior aesthetics.
- Both Landscaping and adding outdoor lighting — Improves curb appeal and safety.
- Both Upgrading appliances — Modernizes the kitchen and increases appeal for potential buyers/renters.
Renovation cost estimate screening
Value-add ROI direction
- Both Painting exterior and interior walls — Enhances curb appeal and interior aesthetics. ↑
- Both Landscaping and adding outdoor lighting — Improves curb appeal and safety. ↑
- Both Upgrading appliances — Modernizes the kitchen and increases appeal for potential buyers/renters. ↑
ⓘ Cost ranges are severity-bucket heuristics (US national rule-of-thumb). Get contractor quotes + a written scope before underwriting a rehab budget.
Schools (NCES district)
- District
- Shawnee Heights
- NCES district ID
- 2012180
- Math proficiency
- 27% ▼ -11.00%
- Reading proficiency
- 30% ▼ -7.00%
- Median HH income
- $71,771
- Composite
- 27.04/100
- National rank
- #7053
- State rank
- #90 of 169 in KS
Livability — Topeka
- Score
- 69/100
- State rank
- #195
- US rank
- #8848
Category grades
Schools grade is shown separately in the Schools card above.
Census & demographics
- Census place
- Topeka, KS
- City population
- 118,130
- Population (ZIP)
- 7,912
Population outlook (Shawnee County) Hauer SSP2
- Today (2025)
- 179,277 people
- By 2030
- 177,762 · -0.8%
- By 2040
- 172,341 · -3.9%
- By 2050
- 166,330 · -7.2%
- By 2075
- 152,417 · -15.0%
- By 2100
- 134,782 · -24.8%
Race, ethnicity, and origin ACS 2023
- Neighborhood character
- Predominantly White (69%)
- Race & ethnicity
- White 69% Hispanic / Latino 15% Two or more races 11% Black 9%
- Hispanic origin (detail)
- Mexican 15%
- Common ancestry
- Italian 5% Iranian 2% Slovak 2%
- Foreign-born
- 7% · Canada
- Languages at home
- 83% English-only · Spanish 13% Russian/Polish/Slavic 2% Tagalog/Filipino 1%
Political lean MEDSL · Shawnee
- 2024 margin
- Toss-up / Even · D 49.3% · R 48.8% · Other 2.0%
- 2008→2024 swing
- +0.8pp no change · 2008: -0.3pp · 2024: 0.5pp
- All cycles
- 2024: D+0.5 2020: D+3.0 2016: R+2.8 2012: R+1.7 2008: R+0.3
Not yet ingested
- Civics
- —
Market trends
- HPI YoY
- ▼ -38.27%
- Current HPI
- 223.4808
- Rent YoY
- —
- Metro
- —
- State GDP YoY
- —
- F500 in state
- 0
Cash-flow waterfall
monthlySold comps — $/sqft
last 12 mo · ≤1 miLoading sold comps…