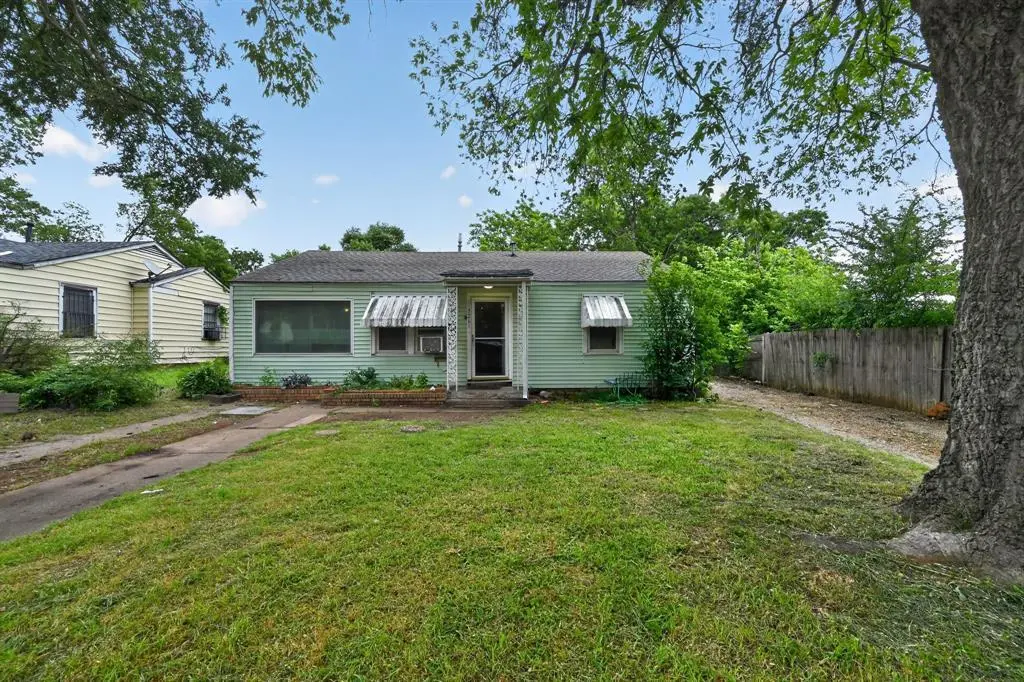
3261 Abney Ave · Fort Worth, TX
Flood risk 1/10 · Minimal
- FEMA flood zone
- X (unshaded)
- Chance of flooding over 30 yrs
- 0.0%
- Est. flood insurance / yr
- $507 – $1,088
Fire risk 1/10 · Minimal
- Est. fire insurance / yr
- $1,222 – $2,270
Heat risk 7/10 · Major
- Hot days now (above 109°F)
- 7 days/yr
- Hot days in 30 yrs
- 23 days/yr
Wind risk 4/10 · Minor
- Chance of severe wind over 30 yrs
- 24.0%
Air-quality risk 3/10 · Minor
- Unhealthy air days now
- 3 days/yr
- Unhealthy air days in 30 yrs
- 4 days/yr
Risk factors via First Street. Map © Google.
Why this score? — see what drove the B+ grade
The composite is a weighted blend of 9 inputs, each scored 0–100. Each bar is that input's sub-score; the figure is the points it added to the 100-point composite (weight × sub-score).
- Cash flow +30.0/30.0
- ARV discount +15.0/15.0
- 1% rule +10.0/10.0
- DSCR +10.0/10.0
- Livability +4.0/5.0
- Rent growth +2.7/5.0
- Condition / age +2.5/5.0
- Schools +2.0/10.0
- Appreciation +0.0/10.0
$129,500
🖨 Deal sheet (PDF) 📄 Offer letter ✓ Due diligence
Listing remarks
Opportunity awaits in the heart of Ft Worth! This 3-bed, 1-bath, 1,682 sq ft home sits on a generous 7,100 sq ft lot with a detached garage and mature shade trees offering strong potential for investors or buyers ready to take on a renovation project. Conveniently located less than 10 minutes from TCU's campus, 10 minutes to Downtown Fort Worth, and 15 minutes to the world-famous Stockyards. With solid bones and a generous lot size, this home is ideal for a flip, rental, or custom renovation. A great opportunity to add value in a rapidly growing area.
Key facts
- 7,100 sq ft lot
- 2 garage spots
- Built 1948
Property features AI
Finance
- Financial info: No second mortgage reported
- HOA & community: No homeowners association
Exterior
- Parking: Attached 2-car garage; Covered parking for 2 vehicles; Driveway; garage faces side
- Utilities: City water; City sewer; Electricity connected; Not in a municipal utility district
- Home design: Single-family residence; Residential property; One story; Built in 1948
- Construction: Originally built in 1948
- Exterior features: Lot under 0.5 acre (approximately 0.163 acres); Subdivision: Morningside Park Add
Interior
- Kitchen: No appliances included
- Bedrooms: 3 bedrooms (primary bedroom on main level)
- Bathrooms: 1 full bathroom
- Interior features: Open floorplan; One-level living; One living area and one dining area
- Laundry & utility: No specific laundry or utility equipment listed
Neighborhood map
What this means for you Summary
Snapshot
- This is a 3-bed/1.0-bath single-family listed at $130k.
Deal economics
- At list price, monthly cash flow is $482 ($6k/yr) — positive.
- The deal already cash-flows at list — no discount required.
- Meets the 1% rule at list price ($2k rent vs $130k).
- Recommended offer: $126k (3.0% below list) — sets the bar for market timing.
- Cap rate 10.8% vs local median 3.9% in Fort Worth — top-decile yield for the area; either an underpriced asset or a hidden risk that comps aren't pricing in. Stress-test before assuming the spread holds.
Location & tenants
- Location reads 80/100 on livability (#49 in TX, #1,954 nationally) — a professional / high-income tenant draw. Strengths: amenities A+, cost of living A+, housing A+; Watch: crime F.
- Fort Worth ISD (urban): math 18% / reading 28% proficiency, ranked #742 of 826 in TX (top 90%) — low school quality limits family demand, transient renter base, plan for 1-2y turnover; 73% free/reduced lunch — lower-income household profile, screen leases tightly.
- Zoned schools: Morningside El (math 22% / reading 22%, grade F, #3,333 of 4,322 statewide, top 80%, 377 students, 97% FRL) — zoned schools average 97% FRL vs 73% district-wide (25 pts higher); higher-poverty schools than district average — tighter screening recommended.
- Market conditions: Rents flat; 151 active listings in the ZIP; 34 comparable units currently listed for rent nearby; rentals at typical pace (median 23d on market — plan ~3-4 weeks tenant-placement turnaround); 18,938 units permitted in Tarrant County in 2024 (8,336 in 5+ unit buildings).
- This rent runs 35% of the median local income ($70k/yr) — at the standard rent-burdened threshold; future hikes will face affordability resistance.
Forward outlook
- Local home prices are declining (-3.0%/yr); year-one equity from $895 of loan paydown is wiped out by about $4k of value loss. Plan a longer hold.
- Tarrant County population projected at +41% by 2050 — long-run rental-demand tailwind backs the buy-and-hold thesis.
- At projected returns (-3.0% appreciation + 0.7% rent growth), your $36k cash investment doubles in ~10 years — after that, you're playing with house money.
Negotiation context
- It's been on market 32 days — a 3% lower offer ($126k) is reasonable based on typical stale-listing flexibility.
Risks & watch-outs
- Watch-outs: property tax is 3.8% of price; built in 1948 — expect roof / HVAC / electrical / plumbing capex.
- Climate carrying-cost: extreme-heat days projected 7→23/yr by 2055 (HVAC capex compounding) — expect insurance premiums to compound above CPI over the hold.
Questions for the listing agent
- It's been on market 32 days. Have you received any prior offers? Is the seller open to a 3% concession, seller financing, or rate buy-down credit?
- Built in 1948 — when were the roof, HVAC, electrical panel, plumbing, and water heater last replaced?
- Property tax is high relative to price — has the assessment been appealed recently, and will the sale trigger a re-assessment?
- Is there a deadline driving the sale (1031 exchange, divorce, estate, relocation)? That informs how much negotiation room exists.
- Schools are D-rated, which usually means shorter tenancies and higher turnover. Who's the typical renter profile here, and what's been the actual vacancy rate?
- Crime grade is F in this area — have there been break-ins, vandalism, or insurance claims at this property in the last 3 years? What carrier currently insures it and at what premium?
- What's the average days-on-market for RENTAL listings here right now (not sales)? A rising rental-DOM trend means longer vacancies and softer asking-rent achievability than the comps imply.
- What's the recent tenant-quality profile in this submarket — average credit score on applications, eviction rate, late-payment / NSF rate, and stable-employment percentage? A property-management company in the area should have these aggregated.
- How much new for-sale + rental construction is in the pipeline within 1–3 miles? Heavy new supply typically softens prices + rents 12–24 months out; constrained supply supports both.
Investment metrics
- 1% rule
- 1.59% ✓
- Cap rate
- 10.76%
- Cash-on-cash
- 15.97%
- DSCR
- 1.71
- GRM
- 5.2
CMA / ARV
- ARV (median comp)
- $230,151
- List price
- $129,500
- Delta
- -43.73%
- Verdict
- UNDERPRICED
- Comps
- 20 within 1.0 mi
Show comp detail 12 sales within ~0.75 mi
| Address | Dist | Beds/Ba | Sqft | Sold | Price | $/sf | Match |
|---|---|---|---|---|---|---|---|
| 3209 New York Ave | 0.14mi | 3/1.0 | 1,524 (-9%) | 8mo | $237,500 | $156 | 71 |
| 3200 Burson Ave | 0.20mi | 3/2.0 | 1,492 (-11%) | 15mo | $215,000 | $144 | 55 |
| 3213 New York Ave | 0.13mi | 4/2.0 (+1) | 1,882 (+12%) | 13mo | $335,000 | $178 | 54 |
| 3528 Stuart Dr | 0.65mi | 3/2.0 | 1,545 (-8%) | 7mo | $315,000 | $204 | 46 |
| 1205 E Butler St | 0.55mi | 3/2.0 | 1,562 (-7%) | 18mo | $350,000 | $224 | 43 |
| 912 E Morningside Dr | 0.73mi | 3/2.0 | 1,718 (+2%) | 21mo | $275,000 | $160 | 41 |
| 1508 Sierra Estate Trl | 0.74mi | 4/2.5 (+1) | 1,818 (+8%) | 3mo | $245,000 | $135 | 39 |
| 2909 Nara Vista Trl | 0.62mi | 3/2.0 | 1,867 (+11%) | 13mo | $238,000 | $127 | 38 |
| 1213 E Butler St | 0.54mi | 4/2.5 (+1) | 1,894 (+13%) | 6mo | $340,000 | $180 | 38 |
| 2101 Kingsdale Dr | 0.67mi | 4/2.5 (+1) | 1,779 (+6%) | 15mo | $264,000 | $148 | 36 |
| 1201 E Butler St | 0.55mi | 4/2.0 (+1) | 1,894 (+13%) | 13mo | $365,000 | $193 | 33 |
| 1328 Glen Garden Dr | 0.67mi | 3/2.0 | 1,437 (-15%) | 13mo | $244,990 | $170 | 30 |
Match score weights: distance 35% · size 25% · config 20% · recency 20%. Top-matched comps best support the ARV.
Projected returns pro-forma
-3.0% appreciation · 0.7% rent growth · sell at horizon
- IRR
- 3.9%
- Equity multiple
- 1.15×
- Total profit
- $5,269
- Equity at exit
- $19,309
- IRR
- 10.7%
- Equity multiple
- 1.73×
- Total profit
- $26,647
- Equity at exit
- $11,197
Cash invested: $36,260 (down + closing). Projections, not guarantees.
Landlord ↔ Tenant lean methodology
- Overall (STATE)
- 87 Strongly Landlord-Friendly
- State Texas
- 87 Strongly Landlord-Friendly · R+5
- County
- — inherits STATE
- City
- — inherits STATE
ZIP-level market 76110
- Rents YoY
- 0.7%
- Active inventory
- 151
- Price-to-rent
- 5.2×
Monthly cashflow live
- Estimated rent
- $2,059 high interval (Pro) →
- Mortgage (P&I)
- −$679
- Tax from tax record
- −$411 /mo · $4,937/yr
- Insurance
- −$54
- HOA
- −$0
- Vacancy / Maint / Mgmt
- −$432
- Net cashflow
- $482
Break-even live
Sensitivity live
| Price | -10% $556 | -5% $519 | +0% $482 | +5% $446 | +10% $409 |
|---|---|---|---|---|---|
| Rent | -10% $320 | -5% $401 | +0% $482 | +5% $564 | +10% $645 |
| Rate | -1.0pp $548 | -0.5pp $515 | base $482 | +0.5pp $449 | +1.0pp $415 |
UW: 25.0% down · 7.5% · 30yr · 1.5% tax · 5.0% vac · 8.0% maint · 8.0% mgmt
Financing live
Cash to close
- Down payment
- $32,375
- Closing costs
- $3,885
- Reserves months
- —
- Total cash needed
- —
Loan-product check · same deal, 3 products live
Conventional
25% down · 7.5% · 30yr
- Down + closing
- —
- Monthly P&I
- —
- Monthly cashflow
- —
- DSCR
- —
- Eligible?
- —
Personal DTI + credit; lowest rate.
DSCR
20% down · 8.5% · 30yr
- Down + closing
- —
- Monthly P&I
- —
- Monthly cashflow
- —
- DSCR
- —
- Eligible?
- —
No personal income docs; deal must DSCR.
Hard money
10% down · 12.0% · 12mo
- Down + closing
- —
- Monthly P&I
- —
- Monthly cashflow
- —
- DSCR
- —
- Eligible?
- —
Short-term bridge; refi at stabilization.
Rent comps 34 comps
| Address | Beds | Baths | Sqft | Rent | $/sqft | DOM | Units | Dist |
|---|---|---|---|---|---|---|---|---|
| 2920 Pima Ln Fort Worth, TX | 3.0 | 2.5 | 1540 | $1,800 | $1.17 | 15d | 1 | 0.60mi |
| 1224 Elva Warren St Fort Worth, TX | 4.0 | 2.5 | 1584 | $2,000 | $1.26 | 45d | 1 | 0.68mi |
| 1516 Chama Dr Fort Worth, TX | 3.0 | 2.5 | 1625 | $1,700 | $1.05 | 25d | 1 | 0.71mi |
| 1516 Chama Dr Fort Worth, TX | 3.0 | 2.0 | 1332 | $1,695 | $1.27 | 22d | 1 | 0.71mi |
| 1037 Colvin St Fort Worth, TX | 2.0 | 1.0 | 1092 | $1,500 | $1.37 | 21d | 1 | 0.83mi |
| 1108 E Robert St Fort Worth, TX | 3.0 | 1.0 | 1444 | $1,775 | $1.23 | 0d | 1 | 0.87mi |
| 2701 Stuart Dr Fort Worth, TX | 3.0 | 3.0 | 2104 | $1,800 | $0.86 | 45d | 1 | 0.91mi |
| 3329 Hemphill St Fort Worth, TX | 3.0 | 2.0 | 1425 | $2,950 | $2.07 | 45d | 1 | 0.96mi |
| 205 E Fogg St Fort Worth, TX | 4.0 | 2.0 | 1350 | $2,100 | $1.56 | 45d | 1 | 0.96mi |
| 504 E Mason St Fort Worth, TX | 4.0 | 2.0 | 1600 | $2,650 | $1.66 | 45d | 1 | 0.99mi |
| 504 E Mason St Fort Worth, TX | 4.0 | 2.0 | 1600 | $2,099 | $1.31 | 18d | 1 | 0.99mi |
| 1429 E Robert St Fort Worth, TX | 3.0 | 2.0 | 1050 | $1,350 | $1.29 | 23d | 1 | 1.05mi |
| 2201 Sims Dr Fort Worth, TX | 3.0 | 2.0 | 1170 | $1,650 | $1.41 | 45d | 1 | 1.06mi |
| 2333 Wyatt Ct Fort Worth, TX | 3.0 | 1.5 | 1280 | $1,795 | $1.40 | 0d | 1 | 1.07mi |
| 2837 Hemphill St Unit 203 Fort Worth, TX | 2.0 | 2.0 | 1297 | $1,875 | $1.45 | 22d | 1 | 1.09mi |
| 2837 Hemphill St Unit 202 Fort Worth, TX | 2.0 | 2.0 | 1297 | $1,800 | $1.39 | 22d | 1 | 1.09mi |
| 2705 Belzise Ter Fort Worth, TX | 2.0 | 2.0 | 1160 | $1,450 | $1.25 | 45d | 1 | 1.10mi |
| 2901 Travis Ave Fort Worth, TX | 1.0–2.0 | 1.0–2.0 | 975 | $1,340 | $1.37 | 25d | 5 | 1.13mi |
| 2932 Travis Ave Unit 2932 Fort Worth, TX | 3.0 | 2.0 | 1600 | $1,700 | $1.06 | 22d | 1 | 1.15mi |
| 2216 Old Leonard St Fort Worth, TX | 4.0 | 2.5 | 2053 | $2,500 | $1.22 | 45d | 1 | 1.20mi |
| 2256 Old Leonard St Fort Worth, TX | 4.0 | 2.0 | 1899 | $2,400 | $1.26 | 45d | 1 | 1.21mi |
| 3225 S Adams St Fort Worth, TX | 4.0 | 2.0 | 1948 | $2,395 | $1.23 | 25d | 1 | 1.26mi |
| 1229 E Harvey Ave Fort Worth, TX | 3.0 | 2.0 | 1684 | $2,150 | $1.28 | 0d | 1 | 1.28mi |
| 2344 Linda Ln Fort Worth, TX | 3.0 | 2.0 | 1679 | $1,850 | $1.10 | 45d | 1 | 1.28mi |
| 1200 E Seminary Dr Fort Worth, TX | 2.0–3.0 | 1.0–2.0 | 925 | $1,625 | $1.76 | 16d | 7 | 1.28mi |
| 4029 Saint Christian St Fort Worth, TX | 4.0 | 2.0 | 1690 | $1,995 | $1.18 | 0d | 1 | 1.35mi |
| 642 E Harvey Ave Fort Worth, TX | 4.0 | 2.0 | 1755 | $2,099 | $1.20 | 45d | 1 | 1.36mi |
| 4800 Dunlap Dr Fort Worth, TX | 3.0 | 2.0 | 1706 | $2,150 | $1.26 | 5d | 1 | 1.38mi |
| 4800 Dunlap Dr Fort Worth, TX | 3.0 | 2.0 | 1705 | $2,150 | $1.26 | 21d | 1 | 1.38mi |
| 4800 Dunlap Dr Fort Worth, TX | 3.0 | 2.0 | 1705 | $2,150 | $1.26 | 7d | 1 | 1.38mi |
| 823 E Arlington Ave Fort Worth, TX | 4.0 | 2.5 | 1720 | $2,350 | $1.37 | 25d | 1 | 1.41mi |
| 1246 Lowe St Fort Worth, TX | 3.0 | 2.5 | 1752 | $1,895 | $1.08 | 16d | 1 | 1.43mi |
| 2812 Ryan Place Dr Fort Worth, TX | 2.0 | 1.0 | 1234 | $2,795 | $2.26 | 18d | 1 | 1.48mi |
| 1327 E Baltimore Ave Fort Worth, TX | 3.0 | 2.0 | 1426 | $1,650 | $1.16 | 25d | 1 | 1.49mi |
Listing history 11 events
-
2026-06-08statusdays on market $129,500 Pending 32 DOM
-
2026-06-07days on market $129,500 Active 31 DOM
-
2026-06-04pricedays on market $129,500 Active 28 DOM
-
2026-06-03days on market $139,500 Active 27 DOM
-
2026-06-02days on market $139,500 Active 26 DOM
-
2026-06-01days on market $139,500 Active 25 DOM
-
2026-05-31days on market $139,500 Active 24 DOM
-
2026-05-13price $154,900 569-char remark
-
2026-05-07$164,900 Active 569-char remark
-
2026-03-26soldstatus
-
2026-03-26soldstatus
ⓘ Source: listings_history table (triggers on properties + properties_extension) + one-shot
backfill from property_details.listing_events for pre-trigger history.
Tax reassessment forecast TX · Resets to sale price
- Current annual tax
- $4,937 · $411/mo
- Projected year-2 tax
- $4,937 · $411/mo
- Expected delta
- $0/yr ($0/mo · 0.0%)
ⓘ Screening estimate from a state-policy table — verify with the county assessor before closing.
Climate risk First Street
- Flood 1/10 Low FEMA zone X (unshaded) · 0% chance over 30 yrs
- Wildfire 1/10 Low
- Heat 7/10 Severe 7 d/yr ≥109°F today · 23 d/yr by 30 yrs out
- Wind 4/10 Moderate 24% chance of damaging wind over 30 yrs
- Air quality 3/10 Moderate 3 unhealthy d/yr today · 4 by 30 yrs out
Nearby sold comps map
Loading sold comps map…
Walkable amenities ~0.75 mi
Loading nearby amenities…
Taxation est. · year 1
- Rental income
- $24,713
- − Mortgage interest
- −$7,254
- − Property taxes
- −$4,937
- − Insurance
- −$648
- − Repairs & maintenance
- −$1,977
- − Management
- −$1,977
- − Depreciation
- −$3,767
- Taxable income
- $4,153
- Est. tax owed @ 24.0%
- −$997
- After-tax cash flow
- $4,793/yr
For passive investors: Depreciation is non-cash, so a rental often shows a tax loss while cash-flowing — sheltering income. Rental losses are passive: they offset passive income freely, and up to $25,000/yr can offset ordinary (W-2) income if you actively participate and your MAGI is under $100k (phasing out to $0 by $150k); unused losses carry forward. On sale, claimed depreciation is recaptured at up to 25%, and gains may owe capital-gains tax (a 1031 exchange can defer both). Figures are a year-1 estimate at your 24.0% rate — not tax advice; consult a CPA.
Schools (NCES district)
- District
- Fort Worth ISD
- NCES district ID
- 4819700
- Math proficiency
- 18% ▼ -16.00%
- Reading proficiency
- 28% ▼ -6.00%
- Median HH income
- $42,109
- Composite
- 19.61/100
- National rank
- #8753
- State rank
- #742 of 826 in TX
Livability — Fort Worth
- Score
- 80/100
- State rank
- #49
- US rank
- #1954
Category grades
Schools grade is shown separately in the Schools card above.
Census & demographics
- Census place
- Fort Worth, TX
- County
- Tarrant County · 2,033,669 people
- City population
- 911,619
- Metro
- Dallas-Fort Worth-Arlington, TX
- Population (ZIP)
- 33,441
- Household income
- $69,790
- Rent vs Own
- Severe rent burden
- 1471.0
Population outlook (Tarrant County) Hauer SSP2
- Today (2025)
- 2,380,417 people
- By 2030
- 2,578,900 · +8.3%
- By 2040
- 2,974,995 · +25.0%
- By 2050
- 3,350,489 · +40.8%
- By 2075
- 4,216,909 · +77.2%
- By 2100
- 4,741,527 · +99.2%
Race, ethnicity, and origin ACS 2023
- Neighborhood character
- Majority Hispanic (63%)
- Race & ethnicity
- Hispanic / Latino 63% White 30% Two or more races 24% Black 2% Asian 2%
- Hispanic origin (detail)
- Mexican 57%
- Common ancestry
- Slovak 1% Italian 1% Lithuanian 1%
- Foreign-born
- 26% · Canada, China
- Languages at home
- 45% English-only · Spanish 52% Other Asian/Pacific 1% Other Indo-European 1%
Political lean MEDSL · Tarrant
- 2024 margin
- Lean R (+5.1) · D 46.7% · R 51.9% · Other 1.4%
- 2008→2024 swing
- +6.6pp toward D · 2008: -11.7pp · 2024: -5.1pp
- All cycles
- 2024: R+5.1 2020: D+0.2 2016: R+8.7 2012: R+15.7 2008: R+11.7
Not yet ingested
- Civics
- —
Market trends
- HPI YoY
- ▼ -194.46%
- Current HPI
- 274.8888
- Rent YoY
- ▲ 0.70%
- Metro
- Dallas-Fort Worth-Arlington, TX
- State GDP YoY
- ▲ 3.95%
- F500 in state
- 110
Industry mix (Fortune 500 HQ in TX)
| Industry | F500 HQs | Revenue |
|---|---|---|
| Energy | 16 | $1,198B |
|
||
| Technology | 5 | $198B |
|
||
| Engineering / Construction | 4 | $72B |
|
||
| Energy Services | 3 | $60B |
|
||
| Utilities | 3 | $41B |
|
||
| Healthcare | 2 | $330B |
|
||
Price history
-21.5% since first listed8 events — show timeline
- 2026-06-08 Pending — NTREIS
- 2026-06-03 Price Changed $129,500 NTREIS
- 2026-05-28 Price Changed $139,500 NTREIS
- 2026-05-20 Price Changed $149,500 NTREIS
- 2026-05-13 Price Changed $154,900 NTREIS
- 2026-05-07 Listed $164,900 NTREIS
- 2026-03-26 Sold (Public Records) — Public Records
- 2026-03-26 Sold (Public Records) — Public Records
Property tax history
+7.3%/yrLatest (2025): $4,937 · -2.4% YoY. Source: county tax records.
Cash-flow waterfall
monthlySold comps — $/sqft
last 12 mo · ≤1 miLoading sold comps…