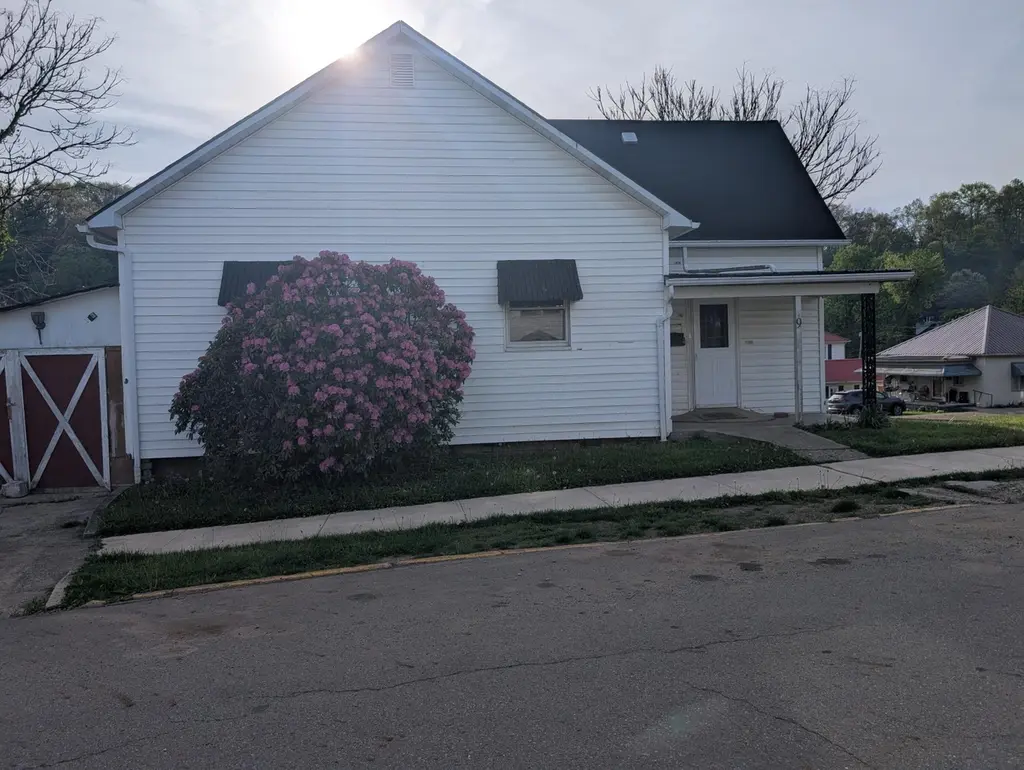
9 Madison St · Glouster, OH
Flood risk 1/10 · Minimal
- FEMA flood zone
- X (unshaded)
- Chance of flooding over 30 yrs
- 0.0%
- Est. flood insurance / yr
- $507 – $1,088
Fire risk 3/10 · Minor
- Est. fire insurance / yr
- $713 – $1,323
Heat risk 4/10 · Minor
- Hot days now (above 98°F)
- 7 days/yr
- Hot days in 30 yrs
- 19 days/yr
Wind risk 2/10 · Minimal
- Chance of severe wind over 30 yrs
- 1.0%
Air-quality risk 2/10 · Minimal
- Unhealthy air days now
- 0 days/yr
- Unhealthy air days in 30 yrs
- 1 days/yr
Risk factors via First Street. Map © Google.
Why this score? — see what drove the C+ grade
The composite is a weighted blend of 9 inputs, each scored 0–100. Each bar is that input's sub-score; the figure is the points it added to the 100-point composite (weight × sub-score).
- Cash flow +30.0/30.0
- DSCR +10.0/10.0
- 1% rule +9.8/10.0
- Livability +3.2/5.0
- Rent growth +2.5/5.0
- Condition / age +2.5/5.0
- Schools +2.4/10.0
- Appreciation +0.1/10.0
- ARV discount +0.0/15.0
$89,000
🖨 Deal sheet (PDF) 📄 Offer letter ✓ Due diligence
Listing remarks
Situated on a corner lot in the Village of Glouster this cute 2 bedroom, one bath home is move in ready. Home offers a separate dining room, bonus pantry and extra kitchen cabinets, stove & fridge. Laundry hook-ups in the bathroom. Attached shed is perfect for the mower, bikes and ATVs. Most recently used as a rental property with rent at $750/mo. The previous tenants left the home freshly cleaned, carpets shampooed, and added fresh paint. Seller may entertain owner financing.
Key facts
- 2,178 sq ft lot
- Built 1900
- Listed 55 days
Property features AI
Finance
- Other: Standard listing conditions
- Financial info: Taxes listed for 2025
Exterior
- Parking: On-street parking
- Utilities: Public water; Public sewer
- Home design: Single family residence; One story; No shared/common walls; Built in 1900
- Construction: Block foundation (listed)
- Exterior features: Block foundation; Lot approximately 0.05 acres
Interior
- Bedrooms: 2 main-level bedrooms
- Bathrooms: 1 bathroom
- Heating & cooling: Forced air heating
- Interior features: Partial basement; Living area approximately 916
Neighborhood map
What this means for you Summary
Snapshot
- This is a 2-bed/1.0-bath single-family listed at $89k.
Deal economics
- At list price, monthly cash flow is $459 ($6k/yr) — positive.
- The deal already cash-flows at list — no discount required.
- Meets the 1% rule at list price ($1k rent vs $89k).
- Recommended offer: $86k (3.0% below list) — sets the bar for market timing.
Location & tenants
- Location reads 64/100 on livability (#804 in OH) — a middle-class / working-renter tenant base. Strengths: cost of living A+, housing A+, crime A; Watch: health & safety C-, amenities F, commute F.
- Trimble Local (rural): math 25% / reading 33% proficiency, ranked #589 of 656 in OH (top 90%) — low school quality limits family demand, transient renter base, plan for 1-2y turnover; 69% free/reduced lunch — lower-income household profile, screen leases tightly.
- Zoned schools: Trimble Elementary School (math 22% / reading 27%, grade F, #1,217 of 1,584 statewide, top 78%, 344 students, 0% FRL); Trimble Junior High (math 32% / reading 37%, grade F, #547 of 654 statewide, top 84%, 191 students, 0% FRL); Trimble High School (math 12% / reading 42%, grade F, #632 of 781 statewide, top 81%, 188 students, 0% FRL) — zoned schools average 0% FRL vs 69% district-wide (69 pts lower); this property's tenant base skews higher-income than the district average.
- Market conditions: 23 active listings in the ZIP; 5 units permitted in Athens County in 2024 (0 in 5+ unit buildings).
Forward outlook
- Local home prices are declining (-3.0%/yr); year-one equity from $615 of loan paydown is wiped out by about $3k of value loss. Plan a longer hold.
- Athens County population projected at +4% by 2050 — modest demand growth; plan on rents tracking national, not racing it.
- At projected returns (-3.0% appreciation + 3.0% rent growth), your $25k cash investment doubles in ~6 years — after that, you're playing with house money.
Negotiation context
- It's been on market 55 days — a 3% lower offer ($86k) is reasonable based on typical stale-listing flexibility.
- Current owner paid $62k; 43% above their basis — modest negotiation headroom, anchor on the comps not their cost.
Risks & watch-outs
- Watch-outs: built in 1900 — expect roof / HVAC / electrical / plumbing capex.
Questions for the listing agent
- It's been on market 55 days. Have you received any prior offers? Is the seller open to a 3% concession, seller financing, or rate buy-down credit?
- Built in 1900 — when were the roof, HVAC, electrical panel, plumbing, and water heater last replaced?
- Is there a deadline driving the sale (1031 exchange, divorce, estate, relocation)? That informs how much negotiation room exists.
- Schools are F-rated, which usually means shorter tenancies and higher turnover. Who's the typical renter profile here, and what's been the actual vacancy rate?
- What's the average days-on-market for RENTAL listings here right now (not sales)? A rising rental-DOM trend means longer vacancies and softer asking-rent achievability than the comps imply.
- What's the recent tenant-quality profile in this submarket — average credit score on applications, eviction rate, late-payment / NSF rate, and stable-employment percentage? A property-management company in the area should have these aggregated.
- How much new for-sale + rental construction is in the pipeline within 1–3 miles? Heavy new supply typically softens prices + rents 12–24 months out; constrained supply supports both.
Investment metrics
- 1% rule
- 1.48% ✓
- Cap rate
- 12.48%
- Cash-on-cash
- 22.09%
- DSCR
- 1.98
- GRM
- 5.6
CMA / ARV
- ARV (median comp)
- $69,535
- List price
- $89,000
- Delta
- 27.99%
- Verdict
- OVERPRICED
- Comps
- 20 within 1.0 mi
Show comp detail 7 sales within ~0.75 mi
| Address | Dist | Beds/Ba | Sqft | Sold | Price | $/sf | Match |
|---|---|---|---|---|---|---|---|
| 28 Maple St | 0.12mi | 2/1.0 | 836 (-9%) | 9mo | $38,000 | $45 | 72 |
| 21 Maple St | 0.15mi | 2/1.0 | 888 (-3%) | 19mo | $32,000 | $36 | 72 |
| 88 Front St | 0.40mi | 2/1.0 | 982 (+7%) | 3mo | $158,300 | $161 | 67 |
| 32 New St | 0.08mi | 2/1.0 | 1,032 (+13%) | 16mo | $146,000 | $141 | 62 |
| 9 Summit St | 0.17mi | 3/1.0 (+1) | 982 (+7%) | 16mo | $39,000 | $40 | 61 |
| 35 Main St | 0.35mi | 2/1.0 | 996 (+9%) | 17mo | $36,000 | $36 | 55 |
| 119 Front St | 0.54mi | 3/1.0 (+1) | 816 (-11%) | 22mo | $58,000 | $71 | 33 |
Match score weights: distance 35% · size 25% · config 20% · recency 20%. Top-matched comps best support the ARV.
Projected returns pro-forma
-3.0% appreciation · 3.0% rent growth · sell at horizon
- IRR
- 14.8%
- Equity multiple
- 1.59×
- Total profit
- $14,793
- Equity at exit
- $13,270
- IRR
- 23.5%
- Equity multiple
- 3.03×
- Total profit
- $50,499
- Equity at exit
- $7,695
Cash invested: $24,920 (down + closing). Projections, not guarantees.
Landlord ↔ Tenant lean methodology
- Overall (STATE)
- 73 Landlord-Friendly
- State Ohio
- 73 Landlord-Friendly · R+6
- County
- — inherits STATE
- City
- — inherits STATE
ZIP-level market 45732
- Home prices YoY
- -3.9%
- Active inventory
- 23
- Price-to-rent
- 5.6×
Monthly cashflow live
- Estimated rent
- $1,318 medium interval (Pro) →
- Mortgage (P&I)
- −$467
- Tax from tax record
- −$78 /mo · $940/yr
- Insurance
- −$37
- HOA
- −$0
- Vacancy / Maint / Mgmt
- −$277
- Net cashflow
- $459
Break-even live
Sensitivity live
| Price | -10% $509 | -5% $484 | +0% $459 | +5% $434 | +10% $408 |
|---|---|---|---|---|---|
| Rent | -10% $355 | -5% $407 | +0% $459 | +5% $511 | +10% $563 |
| Rate | -1.0pp $504 | -0.5pp $481 | base $459 | +0.5pp $436 | +1.0pp $412 |
UW: 25.0% down · 7.5% · 30yr · 1.5% tax · 5.0% vac · 8.0% maint · 8.0% mgmt
Financing live
Cash to close
- Down payment
- $22,250
- Closing costs
- $2,670
- Reserves months
- —
- Total cash needed
- —
Loan-product check · same deal, 3 products live
Conventional
25% down · 7.5% · 30yr
- Down + closing
- —
- Monthly P&I
- —
- Monthly cashflow
- —
- DSCR
- —
- Eligible?
- —
Personal DTI + credit; lowest rate.
DSCR
20% down · 8.5% · 30yr
- Down + closing
- —
- Monthly P&I
- —
- Monthly cashflow
- —
- DSCR
- —
- Eligible?
- —
No personal income docs; deal must DSCR.
Hard money
10% down · 12.0% · 12mo
- Down + closing
- —
- Monthly P&I
- —
- Monthly cashflow
- —
- DSCR
- —
- Eligible?
- —
Short-term bridge; refi at stabilization.
Listing history 20 events
-
2026-06-21days on market $89,000 Active 55 DOM
-
2026-06-21days on market $89,000 Active 54 DOM
-
2026-06-18days on market $89,000 Active 52 DOM
-
2026-06-17days on market $89,000 Active 51 DOM
-
2026-06-16days on market $89,000 Active 50 DOM
-
2026-06-15days on market $89,000 Active 49 DOM
-
2026-06-13days on market $89,000 Active 47 DOM
-
2026-06-12days on market $89,000 Active 46 DOM
-
2026-06-09days on market $89,000 Active 43 DOM
-
2026-06-08days on market $89,000 Active 42 DOM
-
2026-06-08days on market $89,000 Active 41 DOM
-
2026-06-07days on market $89,000 Active 40 DOM
-
2026-06-04days on market $89,000 Active 37 DOM
-
2026-06-02days on market $89,000 Active 36 DOM
-
2026-06-01days on market $89,000 Active 35 DOM
-
2026-05-31days on market $89,000 Active 34 DOM
-
2026-05-12price $89,000 487-char remark
-
2026-04-27$92,000 Active 487-char remark
-
2022-04-01soldstatus $62,400
-
1994-05-10soldstatus $18,000
ⓘ Source: listings_history table (triggers on properties + properties_extension) + one-shot
backfill from property_details.listing_events for pre-trigger history.
Tax reassessment forecast OH · Partial reset (capped growth)
- Current annual tax
- $940 · $78/mo
- Projected year-2 tax
- $1,164 · $97/mo
- Expected delta
- +$224/yr (+$19/mo · 23.8%)
ⓘ Screening estimate from a state-policy table — verify with the county assessor before closing.
Climate risk First Street
- Flood 1/10 Low FEMA zone X (unshaded) · 0% chance over 30 yrs
- Wildfire 3/10 Moderate
- Heat 4/10 Moderate 7 d/yr ≥98°F today · 19 d/yr by 30 yrs out
- Wind 2/10 Low 100% chance of damaging wind over 30 yrs
- Air quality 2/10 Low 0 unhealthy d/yr today · 1 by 30 yrs out
Nearby sold comps map
Loading sold comps map…
Walkable amenities ~0.75 mi
Loading nearby amenities…
Taxation est. · year 1
- Rental income
- $15,811
- − Mortgage interest
- −$4,985
- − Property taxes
- −$940
- − Insurance
- −$445
- − Repairs & maintenance
- −$1,265
- − Management
- −$1,265
- − Depreciation
- −$2,589
- Taxable income
- $4,321
- Est. tax owed @ 24.0%
- −$1,037
- After-tax cash flow
- $4,467/yr
For passive investors: Depreciation is non-cash, so a rental often shows a tax loss while cash-flowing — sheltering income. Rental losses are passive: they offset passive income freely, and up to $25,000/yr can offset ordinary (W-2) income if you actively participate and your MAGI is under $100k (phasing out to $0 by $150k); unused losses carry forward. On sale, claimed depreciation is recaptured at up to 25%, and gains may owe capital-gains tax (a 1031 exchange can defer both). Figures are a year-1 estimate at your 24.0% rate — not tax advice; consult a CPA.
Schools (NCES district)
- District
- Trimble Local
- NCES district ID
- 3904592
- Math proficiency
- 25% ▼ -14.00%
- Reading proficiency
- 33% ▼ -12.00%
- Median HH income
- $34,745
- Composite
- 23.89/100
- National rank
- #7795
- State rank
- #589 of 656 in OH
Livability — Glouster
- Score
- 64/100
- State rank
- #804
- US rank
- #14789
Category grades
Schools grade is shown separately in the Schools card above.
Census & demographics
- Census place
- Glouster, OH
- County
- Athens · 60,466 people
- Population (ZIP)
- 4,287
- Household income
- $57,034
- Rent vs Own
- Severe rent burden
- 5.2
Population outlook (Athens County) Hauer SSP2
- Today (2025)
- 71,867 people
- By 2030
- 73,556 · +2.4%
- By 2040
- 74,528 · +3.7%
- By 2050
- 74,947 · +4.3%
- By 2075
- 77,996 · +8.5%
- By 2100
- 81,619 · +13.6%
Race, ethnicity, and origin ACS 2023
- Neighborhood character
- Predominantly White (96%)
- Race & ethnicity
- White 96% Two or more races 3%
- Common ancestry
- Iranian 2% Romanian 2% Italian 1%
- Foreign-born
- 2% · Canada
- Languages at home
- 96% English-only · German/W. Germanic 2% French/Haitian/Cajun 1%
Political lean MEDSL · Athens
- 2024 margin
- D (+10.8) · D 54.9% · R 44.2%
- 2008→2024 swing
- -24.5pp toward R · 2008: 35.3pp · 2024: 10.8pp
- All cycles
- 2024: D+10.8 2020: D+15.0 2016: D+16.9 2012: D+35.0 2008: D+35.3
Not yet ingested
- Civics
- —
Market trends
- HPI YoY
- ▼ -9.80%
- Current HPI
- 239.26
- Rent YoY
- —
- Metro
- —
- State GDP YoY
- ▲ 1.98%
- F500 in state
- 48
Industry mix (Fortune 500 HQ in OH)
| Industry | F500 HQs | Revenue |
|---|---|---|
| Insurance | 3 | $145B |
|
||
| Industrial Machinery | 3 | $49B |
|
||
| Financial Services | 3 | $24B |
|
||
| Consumer Goods | 2 | $93B |
|
||
| Aerospace / Defense | 2 | $47B |
|
||
| Utilities | 2 | $33B |
|
||
Price history
+394.4% since first listed4 events — show timeline
- 2026-05-12 Price Changed $89,000 CBRMLS
- 2026-04-27 Listed $92,000 CBRMLS
- 2022-04-01 Sold (Public Records) $62,400 Public Records
- 1994-05-10 Sold (Public Records) $18,000 Public Records
Property tax history
+1.5%/yrLatest (2025): $940 · -23.8% YoY. Source: county tax records.
Cash-flow waterfall
monthlySold comps — $/sqft
last 12 mo · ≤1 miLoading sold comps…