4701 Flat Shoals Rd Unit 61C · Union City, GA
Flood risk 1/10 · Minimal
- FEMA flood zone
- X (unshaded)
- Chance of flooding over 30 yrs
- 0.0%
- Est. flood insurance / yr
- $507 – $1,088
Fire risk 3/10 · Minor
- Est. fire insurance / yr
- $963 – $1,789
Heat risk 6/10 · Moderate
- Hot days now (above 104°F)
- 7 days/yr
- Hot days in 30 yrs
- 20 days/yr
Wind risk 6/10 · Moderate
- Chance of severe wind over 30 yrs
- 27.0%
Air-quality risk 4/10 · Minor
- Unhealthy air days now
- 4 days/yr
- Unhealthy air days in 30 yrs
- 6 days/yr
Risk factors via First Street. Map © Google.
Why this score? — see what drove the B- grade
The composite is a weighted blend of 9 inputs, each scored 0–100. Each bar is that input's sub-score; the figure is the points it added to the 100-point composite (weight × sub-score).
- Cash flow +22.3/30.0
- Appreciation +10.0/10.0
- 1% rule +7.9/10.0
- ARV discount +7.5/15.0
- DSCR +7.1/10.0
- Schools +4.5/10.0
- Rent growth +3.1/5.0
- Livability +2.9/5.0
- Condition / age +2.5/5.0
$124,900
🖨 Deal sheet 📄 Offer letter ✓ Due diligence
Listing remarks MLS
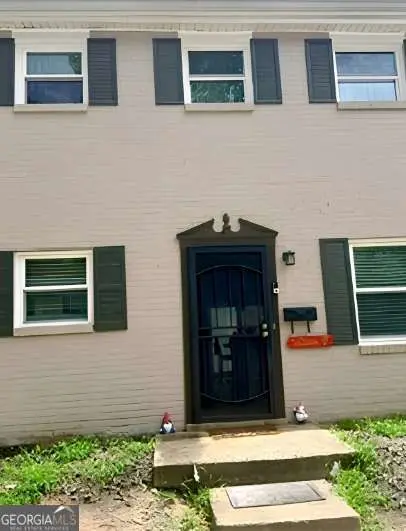
Welcome home to this well-maintained 2-bedroom, 1.5-bath townhome offering approximately 1,100 square feet of comfortable living space. This move-in-ready home features updated flooring, crown molding, energy-efficient windows with built-in blinds, beautiful wood blinds, and a private fenced patio perfect for relaxing or entertaining. The kitchen offers updated cabinetry, subway tile backsplash, stainless steel appliances, and ample storage. Major improvements include a 2-year-old HVAC system, furnace, and water heater, providing peace of mind for years to come. The HOA covers exterior maintenance, landscaping, roof shingles, garbage service, and maintenance of common areas, making for low-maintenance living. Conveniently located near shopping, dining, schools, and major highways.
Key facts
- Private fenced patio
- Updated flooring
- Updated cabinetry
Tags
Property features AI
Finance
- HOA & community: Homeowners association; Monthly association fee of $290
Exterior
- Parking: Parking lot with 1 total parking space
- Utilities: Public water; Public sewer; Electricity available; Water available; Sewer available
- Home design: Condominium; Two levels; Resale property
- Construction: Cement siding; Composition roof; Slab foundation; Built as part of a single-unit community
- Exterior features: Patio; Paved road frontage on a state road
Interior
- Kitchen: Laminate counters; Open view to family room; Dishwasher; Electric range
- Bedrooms: 2 upper-level bedrooms; Split bedroom plan
- Flooring: Carpet; Other
- Bathrooms: 1 full bathroom; 1 half bathroom; Master bath with double vanity and tub/shower combo; Main level half bath
- Heating & cooling: Central heating; Central air; Ceiling fan(s)
- Interior features: Disappearing attic stairs; High-speed internet; Walk-in closet(s); 1 fireplace in family room; 2+ common walls
- Laundry & utility: Laundry on upper level
Neighborhood map
What this means for you Summary
Snapshot
- This is a 2-bed/1.5-bath condo listed at $125k.
Deal economics
- At list price, monthly cash flow is $206 ($2k/yr) — positive.
- The deal already cash-flows at list — no discount required.
- Meets the 1% rule at list price ($2k rent vs $125k).
- Cap rate 8.3% vs local median 5.4% in Union City — top-decile yield for the area; either an underpriced asset or a hidden risk that comps aren't pricing in. Stress-test before assuming the spread holds.
Location & tenants
- Location reads 58/100 on livability (#443 in GA) — a working-class tenant base; expect higher turnover. Strengths: cost of living A+, housing A+; Watch: crime D+, amenities F, commute F.
- Fulton County (suburban): math 49% / reading 53% proficiency, ranked #12 of 174 in GA (top 7%) — acceptable for families but not a draw, mixed tenant base, ~2y average lease.
- Zoned schools: Gullatt Elementary School (math 12% / reading 17%, grade F, #996 of 1,228 statewide, top 83%, 747 students, 100% FRL); Camp Creek Middle School (math 17% / reading 32%, grade F, #301 of 470 statewide, top 66%, 644 students, 100% FRL); Langston Hughes High School (math 8% / reading 17%, grade F, #336 of 424 statewide, top 80%, 1,964 students, 65% FRL) — zoned schools average 88% FRL vs 41% district-wide (47 pts higher); higher-poverty schools than district average — tighter screening recommended.
- Zoned-school proficiency averages 17% at this address vs 51% district-wide (-34 pts) — the specific schools serving this property underperform the Fulton County average; the district grade overstates school quality for this exact location.
- Market conditions: Rents rising (+2.2%/yr); 167 active listings in the ZIP; 23 comparable units currently listed for rent nearby; rentals at typical pace (median 24d on market — plan ~3-4 weeks tenant-placement turnaround); 48% of comp listings sitting > 30 days — soft ceiling on asking rent; 11,565 units permitted in Fulton County in 2024 (8,159 in 5+ unit buildings).
Forward outlook
- In year one you build about $13k of equity ($864 loan paydown + $12k appreciation (10.0% local appreciation)).
- Fulton County population projected at +38% by 2050 — long-run rental-demand tailwind backs the buy-and-hold thesis.
- At projected returns (10.0% appreciation + 2.2% rent growth), your $35k cash investment doubles in ~3 years — after that, you're playing with house money.
- By year 3, paydown + projected appreciation supports a ~$34k cash-out refi (75% LTV) — recoverable capital for the next deal without selling this one.
Negotiation context
- Only 14 days on market — expect competitive offers; lowballing is unlikely to land.
- 20 sale attempts since 6y ago with the ask held roughly flat each time — persistent listings suggest the price (not the market) is what's stuck; bring a comps-based counter.
- Current owner paid $100k; 25% above their basis — modest negotiation headroom, anchor on the comps not their cost.
Risks & watch-outs
- Climate carrying-cost: major wind risk, 27% chance of damaging wind over 30y; extreme-heat days projected 7→20/yr by 2055 (HVAC capex compounding) — expect insurance premiums to compound above CPI over the hold.
Questions for the listing agent
- Built in 1972 — when were the roof, HVAC, electrical panel, plumbing, and water heater last replaced?
- What does the HOA fee cover, when was the last increase, and are there any pending special assessments or reserve-fund shortfalls?
- Any open or pending special assessments — roof, HVAC, plumbing, elevator, façade? What's the per-unit balance and payoff schedule, and is the seller paying it off at close or rolling it to the buyer?
- Is there a deadline driving the sale (1031 exchange, divorce, estate, relocation)? That informs how much negotiation room exists.
- Schools are F-rated, which usually means shorter tenancies and higher turnover. Who's the typical renter profile here, and what's been the actual vacancy rate?
- Crime grade is D in this area — have there been break-ins, vandalism, or insurance claims at this property in the last 3 years? What carrier currently insures it and at what premium?
- What's the average days-on-market for RENTAL listings here right now (not sales)? A rising rental-DOM trend means longer vacancies and softer asking-rent achievability than the comps imply.
- What's the recent tenant-quality profile in this submarket — average credit score on applications, eviction rate, late-payment / NSF rate, and stable-employment percentage? A property-management company in the area should have these aggregated.
- How much new apartment / multifamily construction is in the pipeline within 1–3 miles? Heavy new supply (>2% of stock underway) typically softens rents 12–24 months out; light construction supports rent growth.
Investment metrics
- 1% rule
- 1.29% ✓
- Cap rate
- 8.27%
- Cash-on-cash
- 7.05%
- DSCR
- 1.31
- GRM
- 6.4
CMA / ARV
No comps found within radius.
Projected returns pro-forma
10.0% appreciation · 2.2% rent growth · sell at horizon
- IRR
- 29.1%
- Equity multiple
- 3.29×
- Total profit
- $79,980
- Equity at exit
- $112,520
- IRR
- 25.0%
- Equity multiple
- 7.38×
- Total profit
- $222,998
- Equity at exit
- $242,653
Cash invested: $34,972 (down + closing). Projections, not guarantees.
Landlord ↔ Tenant lean methodology
- Overall (STATE)
- 90 Strongly Landlord-Friendly
- State Georgia
- 90 Strongly Landlord-Friendly · R+3
- County
- — inherits STATE
- City
- — inherits STATE
ZIP-level market 30291
- Home prices YoY
- 11.1%
- Rents YoY
- 2.2%
- Active inventory
- 167
- Price-to-rent
- 6.4×
Monthly cashflow live
- Estimated rent
- $1,616 high interval (Pro) →
- Mortgage (P&I)
- −$655
- Tax from tax record
- −$74 /mo · $887/yr
- Insurance
- −$52
- HOA
- −$290
- Vacancy / Maint / Mgmt
- −$339
- Net cashflow
- $206
Break-even live
UW: 25.0% down · 7.5% · 30yr · 1.5% tax · 5.0% vac · 8.0% maint · 8.0% mgmt
Financing live
Cash to close
- Down payment
- $31,225
- Closing costs
- $3,747
- Reserves months
- —
- Total cash needed
- —
Loan-product check · same deal, 3 products live
Conventional
25% down · 7.5% · 30yr
- Down + closing
- —
- Monthly P&I
- —
- Monthly cashflow
- —
- DSCR
- —
- Eligible?
- —
Personal DTI + credit; lowest rate.
DSCR
20% down · 8.5% · 30yr
- Down + closing
- —
- Monthly P&I
- —
- Monthly cashflow
- —
- DSCR
- —
- Eligible?
- —
No personal income docs; deal must DSCR.
Hard money
10% down · 12.0% · 12mo
- Down + closing
- —
- Monthly P&I
- —
- Monthly cashflow
- —
- DSCR
- —
- Eligible?
- —
Short-term bridge; refi at stabilization.
Rent comps 23 comps
| Address | Beds | Baths | Sqft | Rent | $/sqft | DOM | Units | Dist |
|---|---|---|---|---|---|---|---|---|
| 4701 Flat Shoals Rd Union City, GA | 3.0 | 2.5–3.0 | 1600 | $1,775 | $1.11 | 2d | 1 | 0.15mi |
| 4483 Flat Shoals Rd Union City, GA | 1.0–2.0 | 1.0–2.5 | 957 | $1,495 | $1.56 | 43d | 1 | 0.47mi |
| 5400 Oakley Commons Blvd Union City, GA | 2.0 | 2.0 | 1258 | $1,257 | $1.00 | 43d | 1 | 0.47mi |
| 5201 Summer Brooke Ct Union City, GA | 3.0 | 2.5 | 1484 | $2,000 | $1.35 | 1d | 1 | 0.58mi |
| 5150 Oakley Commons Blvd Union City, GA | 3.0 | 2.5 | 1375 | $1,675 | $1.22 | 24d | 1 | 0.65mi |
| 3285 Oakley Pl Union City, GA | 3.0 | 2.5 | 1350 | $1,500 | $1.11 | 43d | 1 | 0.74mi |
| 6425 Oakley Rd Union City, GA | 1.0–3.0 | 1.0–2.0 | 1037 | $1,324 | $1.28 | 4d | 18 | 0.76mi |
| 5205 Alexander St Union City, GA | 3.0 | 2.0 | 1326 | $1,681 | $1.27 | 43d | 1 | 0.77mi |
| 5200 Alexander St Union City, GA | 3.0 | 2.0 | 1221 | $1,695 | $1.39 | 43d | 1 | 0.79mi |
| 6350 Oakley Rd Union City, GA | 3.0 | 2.0–2.5 | 1472 | $1,796 | $1.22 | 1d | 4 | 0.81mi |
| 4312 Smithgall Ct Union City, GA | 3.0 | 2.5 | 1433 | $2,000 | $1.40 | 18d | 1 | 0.82mi |
| 5140 Highpoint Rd Apt 27 Union City, GA | 2.0 | 2.5 | 1290 | $1,295 | $1.00 | 12d | 1 | 0.93mi |
| 6341 Raymond Ter Union City, GA | 2.0 | 1.0 | 798 | $1,250 | $1.57 | 5d | 1 | 1.00mi |
| 5950 Stonewall Dr Unit 4 Union City, GA | 3.0 | 1.0 | 1320 | $1,445 | $1.09 | 2d | 1 | 1.01mi |
| 5950 Stonewall Dr Unit 2 Union City, GA | 3.0 | 1.5 | 1320 | $1,495 | $1.13 | 15d | 1 | 1.01mi |
| 6410 Raymond Ter Union City, GA | 2.0 | 1.0 | 783 | $1,000 | $1.28 | 43d | 1 | 1.04mi |
| 5058 Jonesboro Rd Union City, GA | 2.0 | 1.0–1.5 | 997 | $1,395 | $1.40 | 20d | 1 | 1.13mi |
| 5058 Jonesboro Rd Unit E37 Union City, GA | 2.0 | 1.5 | 997 | $1,395 | $1.40 | 4d | 1 | 1.13mi |
| 4128 Flat Trl Union City, GA | 3.0 | 2.5 | 1450 | $1,700 | $1.17 | 43d | 1 | 1.20mi |
| 6510 Lower Dixie Lake Rd Union City, GA | 2.0 | 1.0 | 800 | $1,050 | $1.31 | 44d | 1 | 1.23mi |
| 7000 Goodson Rd #69 Union City, GA | 3.0 | 2.0 | 960 | $1,400 | $1.46 | 43d | 1 | 1.38mi |
| 5480 Sierra Trl Atlanta, GA | 3.0 | 2.5 | 1400 | $1,845 | $1.32 | 43d | 1 | 1.40mi |
| 5616 Union Pointe Dr Union City, GA | 2.0 | 2.5 | 1387 | $1,545 | $1.11 | 43d | 1 | 1.46mi |
HOA detail condo
- Monthly dues
- $290 · $3,480/yr
- Likely covers
- watertrashlandscapingexterior maint.
- Assessments
- None detected in remarks — confirm with the listing agent.
Listing history 9 events
-
2026-06-18days on market $124,900 Active 14 DOM
-
2026-06-17days on market $124,900 Active 13 DOM
-
2026-06-16days on market $124,900 Active 12 DOM
-
2026-06-15days on market $124,900 Active 11 DOM
-
2026-06-13days on market $124,900 Active 9 DOM
-
2026-06-09days on market $124,900 Active 5 DOM
-
2026-06-08days on market $124,900 Active 4 DOM
-
2026-06-07remarks 699-char remark
-
2026-06-07$124,900 Active 3 DOM
ⓘ Source: listings_history table (triggers on properties + properties_extension) + one-shot
backfill from property_details.listing_events for pre-trigger history.
Tax reassessment forecast GA · Resets to sale price
- Current annual tax
- $887 · $74/mo
- Projected year-2 tax
- $1,149 · $96/mo
- Expected delta
- +$262/yr (+$22/mo · 29.5%)
ⓘ Screening estimate from a state-policy table — verify with the county assessor before closing.
Climate risk First Street
- Flood 1/10 Low FEMA zone X (unshaded) · 0% chance over 30 yrs
- Wildfire 3/10 Moderate
- Heat 6/10 Major 7 d/yr ≥104°F today · 20 d/yr by 30 yrs out
- Wind 6/10 Major 27% chance of damaging wind over 30 yrs
- Air quality 4/10 Moderate 4 unhealthy d/yr today · 6 by 30 yrs out
Nearby sold comps map
Loading sold comps map…
Walkable amenities ~0.75 mi
Loading nearby amenities…
Taxation est. · year 1
- Rental income
- $19,391
- − Mortgage interest
- −$6,996
- − Property taxes
- −$887
- − Insurance
- −$624
- − Repairs & maintenance
- −$1,551
- − Management
- −$1,551
- − HOA
- −$3,480
- − Depreciation
- −$3,633
- Taxable income
- $667
- Est. tax owed @ 24.0%
- −$160
- After-tax cash flow
- $2,307/yr
For passive investors: Depreciation is non-cash, so a rental often shows a tax loss while cash-flowing — sheltering income. Rental losses are passive: they offset passive income freely, and up to $25,000/yr can offset ordinary (W-2) income if you actively participate and your MAGI is under $100k (phasing out to $0 by $150k); unused losses carry forward. On sale, claimed depreciation is recaptured at up to 25%, and gains may owe capital-gains tax (a 1031 exchange can defer both). Figures are a year-1 estimate at your 24.0% rate — not tax advice; consult a CPA.
Schools (NCES district)
- District
- Fulton County
- NCES district ID
- 1302280
- Math proficiency
- 49% ▼ -2.00%
- Reading proficiency
- 53% ▬ 0.00%
- Median HH income
- $68,035
- Composite
- 45.33/100
- National rank
- #2640
- State rank
- #12 of 174 in GA
Livability — Union City
- Score
- 58/100
- State rank
- #443
- US rank
- #21281
Category grades
Schools grade is shown separately in the Schools card above.
Census & demographics
- Census place
- Union City, GA
- County
- Fulton County · 1,094,430 people
- City population
- 25,130
- Metro
- Atlanta-Sandy Springs-Alpharetta, GA
- Population (ZIP)
- 25,130
- Household income
- $48,184
- Rent vs Own
- Severe rent burden
- 1778.0
Population outlook (Fulton County) Hauer SSP2
- Today (2025)
- 1,203,707 people
- By 2030
- 1,299,706 · +8.0%
- By 2040
- 1,488,256 · +23.6%
- By 2050
- 1,664,580 · +38.3%
- By 2075
- 2,036,072 · +69.2%
- By 2100
- 2,222,402 · +84.6%
Race, ethnicity, and origin ACS 2023
- Neighborhood character
- Predominantly Black (86%)
- Race & ethnicity
- Black 86% Hispanic / Latino 7% Two or more races 6% White 3%
- Hispanic origin (detail)
- Mexican 4%
- Common ancestry
- Italian 1%
- Foreign-born
- 5% · Canada
- Languages at home
- 92% English-only · Spanish 6%
Political lean MEDSL · Fulton
- 2024 margin
- Solid D (+44.9) · D 71.9% · R 27.0% · Other 1.1%
- 2008→2024 swing
- +9.8pp toward D · 2008: 35.0pp · 2024: 44.9pp
- All cycles
- 2024: D+44.9 2020: D+46.4 2016: D+42.1 2012: D+29.6 2008: D+35.0
Not yet ingested
- Civics
- —
Market trends
- HPI YoY
- ▲ 23.98%
- Current HPI
- 239.3471
- Rent YoY
- ▲ 2.20%
- Metro
- Atlanta-Sandy Springs-Alpharetta, GA
- State GDP YoY
- ▲ 2.66%
- F500 in state
- 28
Industry mix (Fortune 500 HQ in GA)
| Industry | F500 HQs | Revenue |
|---|---|---|
| Paper / Packaging | 2 | $29B |
|
||
| Retail | 1 | $160B |
|
||
| Transportation / Logistics | 1 | $91B |
|
||
| Airlines | 1 | $62B |
|
||
| Consumer Goods | 1 | $47B |
|
||
| Utilities | 1 | $25B |
|
||
Price history
+137.9% since first listed73 events — show timeline
- 2026-06-04 Listed $124,900 FMLS
- 2026-06-04 Listed $124,900 GAMLS
- 2024-08-19 Sold (Public Records) $100,000 Public Records
- 2024-07-30 Sold (MLS) $100,000 FMLS
- 2024-07-30 Sold (MLS) $100,000 GAMLS
- 2024-06-28 Pending — FMLS
- 2024-06-19 Contingent — FMLS
- 2024-06-19 Pending — GAMLS
- 2024-06-10 Price Changed $100,000 FMLS
- 2024-06-10 Price Changed $100,000 GAMLS
- 2024-06-02 Price Changed $105,000 FMLS
- 2024-05-23 Relisted — FMLS
- 2024-05-21 Relisted — GAMLS
- 2024-05-21 Price Changed $105,000 GAMLS
- 2024-05-20 Contingent — GAMLS
- 2024-05-13 Relisted — GAMLS
- 2024-04-25 Pending — FMLS
- 2024-03-15 Pending — GAMLS
- 2024-03-15 Contingent — FMLS
- 2024-03-05 Price Changed $110,000 GAMLS
- 2024-03-05 Price Changed $110,000 FMLS
- 2024-02-26 Price Changed $115,000 GAMLS
- 2024-02-26 Price Changed $115,000 FMLS
- 2024-02-18 Price Changed $125,000 GAMLS
- 2024-02-18 Price Changed $125,000 FMLS
- 2024-02-01 Price Changed $126,000 GAMLS
- 2024-02-01 Price Changed $126,000 FMLS
- 2024-01-19 Listed $130,000 FMLS
- 2024-01-19 Listed $130,000 GAMLS
- 2024-01-12 Sold (Public Records) $78,900 Public Records
- 2024-01-10 Sold (MLS) $78,900 GAMLS
- 2024-01-10 Sold (MLS) $78,900 FMLS
- 2023-12-22 Pending — GAMLS
- 2023-12-22 Pending — FMLS
- 2023-12-14 Relisted — GAMLS
- 2023-12-14 Relisted — FMLS
- 2023-12-05 Pending — GAMLS
- 2023-12-05 Pending — FMLS
- 2023-11-30 Price Changed $107,000 GAMLS
- 2023-11-30 Price Changed $107,000 FMLS
- 2023-10-26 Price Changed $127,000 GAMLS
- 2023-10-26 Price Changed $127,000 FMLS
- 2023-10-06 Listed $147,900 GAMLS
- 2023-10-06 Listed $147,900 FMLS
- 2021-02-18 Sold (Public Records) $52,000 Public Records
- 2021-02-16 Sold (MLS) $52,000 GAMLS
- 2021-02-16 Sold (MLS) $52,000 FMLS
- 2021-01-26 Pending — FMLS
- 2021-01-19 Pending — GAMLS
- 2021-01-19 Contingent — FMLS
- 2020-12-28 Relisted — GAMLS
- 2020-12-28 Relisted — FMLS
- 2020-12-02 Pending — FMLS
- 2020-12-01 Pending — GAMLS
- 2020-12-01 Contingent — FMLS
- 2020-09-25 Relisted — GAMLS
- 2020-09-25 Relisted — FMLS
- 2020-09-23 Pending — FMLS
- 2020-09-16 Pending — GAMLS
- 2020-09-16 Contingent — FMLS
- 2020-09-11 Listing Removed — GAMLS
- 2020-09-11 Listed $60,000 GAMLS
- 2020-09-11 Listed $60,000 FMLS
- 2020-08-05 Relisted — GAMLS
- 2020-07-31 Pending — GAMLS
- 2020-07-09 Listed $60,000 GAMLS
- 2020-06-22 Listing Removed — GAMLS
- 2020-05-26 Listed $55,000 GAMLS
- 2018-05-29 Sold (Public Records) $33,900 Public Records
- 2018-05-23 Sold (MLS) $33,900 GAMLS
- 2018-05-23 Sold (MLS) $33,900 FMLS
- 2007-03-05 Sold (Public Records) $66,000 Public Records
- 2002-10-02 Sold (Public Records) $52,500 Public Records
Property tax history
+2.1%/yrLatest (2025): $887 · +5.1% YoY. Source: county tax records.
Cash-flow waterfall
monthlySold comps — $/sqft
last 12 mo · ≤1 miLoading sold comps…