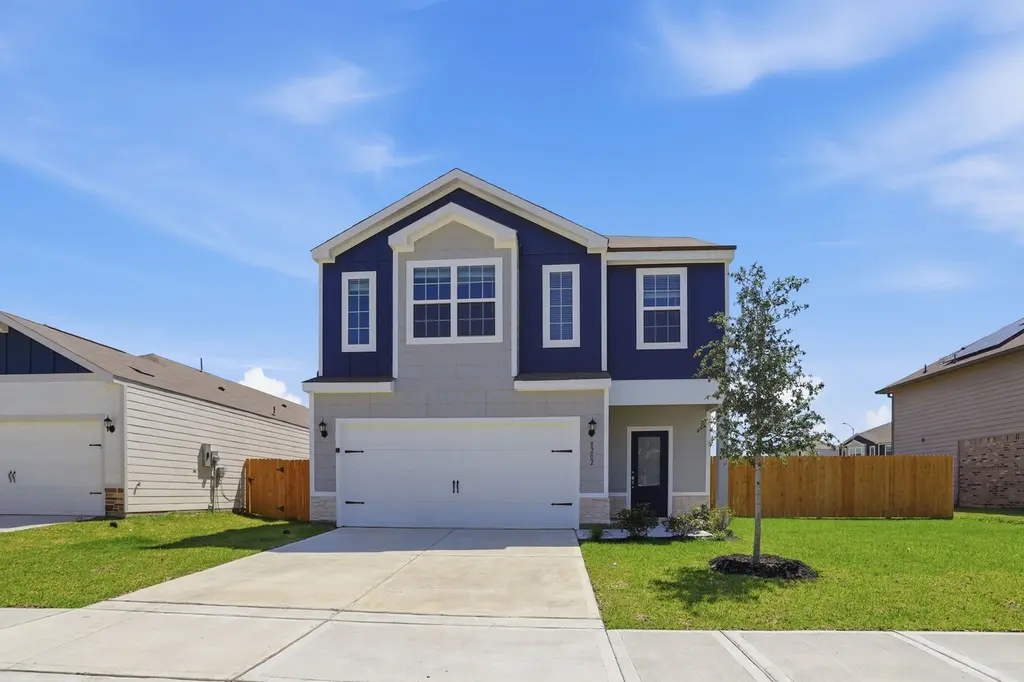
8202 Blooming Meadow Ln · Houston, TX
Flood risk 8/10 · Major
- FEMA flood zone
- X (unshaded)
- Chance of flooding over 30 yrs
- 0.99%
- Est. flood insurance / yr
- $507 – $1,088
Fire risk 3/10 · Minor
- Est. fire insurance / yr
- $1,222 – $2,270
Heat risk 9/10 · Severe
- Hot days now (above 110°F)
- 7 days/yr
- Hot days in 30 yrs
- 25 days/yr
Wind risk 9/10 · Severe
- Chance of severe wind over 30 yrs
- 99.0%
Air-quality risk 3/10 · Minor
- Unhealthy air days now
- 3 days/yr
- Unhealthy air days in 30 yrs
- 3 days/yr
Risk factors via First Street. Map © Google.
Why this score? — see what drove the B grade
The composite is a weighted blend of 9 inputs, each scored 0–100. Each bar is that input's sub-score; the figure is the points it added to the 100-point composite (weight × sub-score).
- Cash flow +23.5/30.0
- ARV discount +15.0/15.0
- Appreciation +9.3/10.0
- DSCR +7.5/10.0
- 1% rule +6.4/10.0
- Livability +3.7/5.0
- Schools +2.7/10.0
- Rent growth +2.6/5.0
- Condition / age +2.2/5.0
$175,000
🖨 Deal sheet 📄 Offer letter ✓ Due diligence
Listing remarks MLS
The Osage plan by LGI Homes in Wayside Village offers a true retreat for the entire family, with four bedrooms, two and a half bathrooms, and a game room upstairs. The spacious kitchen with adjacent dining area features granite countertops, a full suite of Whirlpool brand appliances, and a walk-in pantry. The owner’s retreat includes a huge walk-in closet and large en-suite bathroom with a separate soaker tub and step-in shower. A covered front porch extended back patio, front yard landscaping and a fenced back yard add to the curb appeal of this incredible home.
Key facts
- Accessible location
- Functional layout
- 8,041 sq ft lot
Tags
Property features AI
Finance
- HOA & community: Part of Wayside Homeowners Association; Association fee $432 annually
Exterior
- Parking: Attached 2-car garage
- Home design: Residential property; Two-story layout (main living areas on first floor, bedrooms on second floor)
- Construction: Built in 2025; Composition roof; Slab foundation
- Exterior features: Lot is approximately 0.1846 acres; Lot features: Other
Interior
- Kitchen: Kitchen on the first floor (10 x 12)
- Bedrooms: Three bedrooms on the second floor (10 x 12; 12 x 10; 12 x 12); Primary bedroom on the second floor (19 x 16)
- Bathrooms: 2 full bathrooms; 1 half bathroom
- Interior features: 6 total rooms
Neighborhood map
What this means for you Summary
Snapshot
- This is a 4-bed/2.5-bath single-family listed at $175k. Condition is rated fair.
Deal economics
- At list price, monthly cash flow is $259 ($3k/yr) — positive.
- The deal already cash-flows at list — no discount required.
- Meets the 1% rule at list price ($2k rent vs $175k).
- Recommended offer: $172k (1.5% below list) — sets the bar for market timing.
Location & tenants
- Location reads 74/100 on livability (#184 in TX, #4,771 nationally) — a middle-class / working-renter tenant base. Strengths: amenities A+, cost of living A+, housing A+; Watch: crime F.
- Houston ISD (urban): math 27% / reading 35% proficiency, ranked #593 of 826 in TX (top 72%) — families likely to look elsewhere, expect single-tenant / working-renter base with shorter leases; 71% free/reduced lunch — lower-income household profile, screen leases tightly.
- Zoned schools: Forest Brook Middle (math 12% / reading 14%, grade F, #1,609 of 1,662 statewide, top 97%, 613 students, 98% FRL); North Forest H S (math 13% / reading 18%, grade F, #1,505 of 1,632 statewide, top 92%, 974 students, 97% FRL) — zoned schools average 98% FRL vs 71% district-wide (27 pts higher); higher-poverty schools than district average — tighter screening recommended.
- Zoned-school proficiency averages 14% at this address vs 31% district-wide (-17 pts) — the specific schools serving this property underperform the Houston ISD average; the district grade overstates school quality for this exact location.
- Market conditions: Rents flat; 372 active listings in the ZIP; 7 comparable units currently listed for rent nearby; rentals leasing fast (median 8d on market — plan ~1-2 weeks tenant-placement turnaround); 29,883 units permitted in Harris County in 2024 (8,621 in 5+ unit buildings).
Forward outlook
- In year one you build about $16k of equity ($1k loan paydown + $15k appreciation (8.7% local appreciation)).
- Harris County population projected at +47% by 2050 — long-run rental-demand tailwind backs the buy-and-hold thesis.
- At projected returns (8.7% appreciation + 0.4% rent growth), your $49k cash investment doubles in ~3 years — after that, you're playing with house money.
- By year 3, paydown + projected appreciation supports a ~$41k cash-out refi (75% LTV) — recoverable capital for the next deal without selling this one.
Negotiation context
- It's been on market 15 days — a 2% lower offer ($172k) is reasonable based on typical stale-listing flexibility.
- 5 sale attempts with the ask held roughly flat each time — persistent listings suggest the price (not the market) is what's stuck; bring a comps-based counter.
Risks & watch-outs
- Watch-outs: flood insurance adds $66/mo.
- Climate carrying-cost: severe flood risk; severe wind risk, 99% chance of damaging wind over 30y; extreme-heat days projected 7→25/yr by 2055 (HVAC capex compounding) — expect insurance premiums to compound above CPI over the hold.
Questions for the listing agent
- Have any recent inspections been done? Can we get a copy of the seller's disclosures and any deferred-maintenance estimates?
- What's the actual annual flood-insurance premium (NFIP or private), and is the property in a SFHA with mandatory coverage?
- What does the HOA fee cover, when was the last increase, and are there any pending special assessments or reserve-fund shortfalls?
- Is there a deadline driving the sale (1031 exchange, divorce, estate, relocation)? That informs how much negotiation room exists.
- Schools are D-rated, which usually means shorter tenancies and higher turnover. Who's the typical renter profile here, and what's been the actual vacancy rate?
- Crime grade is F in this area — have there been break-ins, vandalism, or insurance claims at this property in the last 3 years? What carrier currently insures it and at what premium?
- What's the average days-on-market for RENTAL listings here right now (not sales)? A rising rental-DOM trend means longer vacancies and softer asking-rent achievability than the comps imply.
- What's the recent tenant-quality profile in this submarket — average credit score on applications, eviction rate, late-payment / NSF rate, and stable-employment percentage? A property-management company in the area should have these aggregated.
- How much new for-sale + rental construction is in the pipeline within 1–3 miles? Heavy new supply typically softens prices + rents 12–24 months out; constrained supply supports both.
Investment metrics
- 1% rule
- 1.14% ✓
- Cap rate
- 8.53%
- Cash-on-cash
- 7.98%
- DSCR
- 1.35
- GRM
- 7.3
CMA / ARV
- ARV (median comp)
- $304,150
- List price
- $175,000
- Delta
- -42.46%
- Verdict
- UNDERPRICED
- Comps
- 20 within 1.0 mi
Show comp detail 12 sales within ~0.75 mi
| Address | Dist | Beds/Ba | Sqft | Sold | Price | $/sf | Match |
|---|---|---|---|---|---|---|---|
| 8116 Burnt Orchid Dr | 0.06mi | 4/2.5 | 2,316 (+1%) | 1mo | $323,900 | $140 | 96 |
| 8224 Sunberry Shadow Dr | 0.07mi | 4/2.5 | 2,316 (+1%) | 1mo | $323,900 | $140 | 95 |
| 7915 Elowen Grove Dr | 0.25mi | 4/2.5 | 2,260 (-2%) | 1mo | $320,540 | $142 | 85 |
| 7912 Elowen Grove Dr | 0.27mi | 4/2.5 | 2,260 (-2%) | 1mo | $320,290 | $142 | 84 |
| 7924 Cassie Pine Dr | 0.29mi | 4/2.5 | 2,260 (-2%) | 0mo | $324,290 | $143 | 83 |
| 7904 Elowen Grove Dr | 0.30mi | 4/2.5 | 2,260 (-2%) | 1mo | $320,540 | $142 | 82 |
| 10336 Vinca Minor Ln | 0.28mi | 4/3.0 | 2,260 (-2%) | 2mo | $316,740 | $140 | 81 |
| 10323 Vinca Minor Ln | 0.32mi | 4/3.0 | 2,260 (-2%) | 2mo | $322,040 | $142 | 79 |
| 10307 Vinca Minor Ln | 0.34mi | 4/3.0 | 2,260 (-2%) | 1mo | $319,040 | $141 | 79 |
| 7917 Elowen Grove Dr | 0.24mi | 4/2.5 | 2,121 (-8%) | 1mo | $309,290 | $146 | 75 |
| 7905 Elowen Grove Dr | 0.29mi | 4/2.5 | 2,121 (-8%) | 1mo | $306,040 | $144 | 72 |
| 10309 Vinca Minor Ln | 0.33mi | 4/2.5 | 2,121 (-8%) | 2mo | $306,290 | $144 | 70 |
Match score weights: distance 35% · size 25% · config 20% · recency 20%. Top-matched comps best support the ARV.
Projected returns pro-forma
8.65% appreciation · 0.44% rent growth · sell at horizon
- IRR
- 25.1%
- Equity multiple
- 2.86×
- Total profit
- $91,031
- Equity at exit
- $140,748
- IRR
- 21.6%
- Equity multiple
- 5.97×
- Total profit
- $243,302
- Equity at exit
- $287,166
Cash invested: $49,000 (down + closing). Projections, not guarantees.
Landlord ↔ Tenant lean methodology
- Overall (STATE)
- 87 Strongly Landlord-Friendly
- State Texas
- 87 Strongly Landlord-Friendly · R+5
- County
- — inherits STATE
- City
- — inherits STATE
ZIP-level market 77016
- Home prices YoY
- 2.8%
- Rents YoY
- 0.4%
- Active inventory
- 372
- Price-to-rent
- 7.3×
Monthly cashflow live
- Estimated rent
- $1,989 high interval (Pro) →
- Mortgage (P&I)
- −$918
- Tax est. 1.5%
- −$219 /mo · $2,625/yr
- Insurance
- −$73
- Flood insurance flood zone
- −$66 /mo · $798/yr
- HOA
- −$36
- Vacancy / Maint / Mgmt
- −$418
- Net cashflow
- $259
Break-even live
UW: 25.0% down · 7.5% · 30yr · 1.5% tax · 5.0% vac · 8.0% maint · 8.0% mgmt
Financing live
Cash to close
- Down payment
- $43,750
- Closing costs
- $5,250
- Reserves months
- —
- Total cash needed
- —
Loan-product check · same deal, 3 products live
Conventional
25% down · 7.5% · 30yr
- Down + closing
- —
- Monthly P&I
- —
- Monthly cashflow
- —
- DSCR
- —
- Eligible?
- —
Personal DTI + credit; lowest rate.
DSCR
20% down · 8.5% · 30yr
- Down + closing
- —
- Monthly P&I
- —
- Monthly cashflow
- —
- DSCR
- —
- Eligible?
- —
No personal income docs; deal must DSCR.
Hard money
10% down · 12.0% · 12mo
- Down + closing
- —
- Monthly P&I
- —
- Monthly cashflow
- —
- DSCR
- —
- Eligible?
- —
Short-term bridge; refi at stabilization.
Rent comps 7 comps
| Address | Beds | Baths | Sqft | Rent | $/sqft | DOM | Units | Dist |
|---|---|---|---|---|---|---|---|---|
| 8214 Parker Rd Unit B Houston, TX | 3.0 | 2.0 | 1608 | $1,560 | $0.97 | 7d | 1 | 0.30mi |
| 8003 Alpine Bearberry Dr Houston, TX | 3.0–4.0 | 2.0–2.5 | 1696 | $2,520 | $1.49 | 7d | 1 | 0.35mi |
| 8314 Madera Rd Unit B Houston, TX | 3.0 | 2.5 | 1608 | $1,495 | $0.93 | 24d | 1 | 0.49mi |
| 8235 Locksley Rd Unit A Houston, TX | 3.0 | 2.5 | 1608 | $1,525 | $0.95 | 7d | 1 | 0.80mi |
| 9702 Hillis St Houston, TX | 3.0 | 2.0 | 1612 | $1,550 | $0.96 | 43d | 1 | 0.97mi |
| 7426 Bigwood St Houston, TX | 4.0 | 2.0 | 1997 | $1,850 | $0.93 | 13d | 1 | 1.08mi |
| 9218 Nyssa St Unit B Houston, TX | 3.0 | 2.5 | 1608 | $1,490 | $0.93 | 1d | 1 | 1.46mi |
HOA detail
- Monthly dues
- $36 · $432/yr
- Likely covers
- landscapingpool
Listing history 11 events
-
2026-05-14$175,000 Active 473-char remark
-
2026-02-24historical $2,449
-
2026-01-27$2,449
-
2025-12-19soldstatus Closed 575-char remark
Show marketing remark (575 chars)
The Osage plan by LGI Homes in Wayside Village offers a true retreat for the entire family, with four bedrooms, two and a half bathrooms, and a game room upstairs. The spacious kitchen with adjacent dining area features granite countertops, a full suite of Whirlpool brand appliances, and a walk-in pantry. The owner’s retreat includes a huge walk-in closet and large en-suite bathroom with a separate soaker tub and step-in shower. A covered front porch extended back patio, front yard landscaping and a fenced back yard add to the curb appeal of this incredible home.
-
2025-09-19status Pending 575-char remark
Show marketing remark (575 chars)
The Osage plan by LGI Homes in Wayside Village offers a true retreat for the entire family, with four bedrooms, two and a half bathrooms, and a game room upstairs. The spacious kitchen with adjacent dining area features granite countertops, a full suite of Whirlpool brand appliances, and a walk-in pantry. The owner’s retreat includes a huge walk-in closet and large en-suite bathroom with a separate soaker tub and step-in shower. A covered front porch extended back patio, front yard landscaping and a fenced back yard add to the curb appeal of this incredible home.
-
2025-09-05$332,900 Active 575-char remark
Show marketing remark (575 chars)
The Osage plan by LGI Homes in Wayside Village offers a true retreat for the entire family, with four bedrooms, two and a half bathrooms, and a game room upstairs. The spacious kitchen with adjacent dining area features granite countertops, a full suite of Whirlpool brand appliances, and a walk-in pantry. The owner’s retreat includes a huge walk-in closet and large en-suite bathroom with a separate soaker tub and step-in shower. A covered front porch extended back patio, front yard landscaping and a fenced back yard add to the curb appeal of this incredible home.
-
2025-08-29historical
-
2025-08-11status Active
-
2025-07-15status Pending
-
2025-07-02price $332,900
-
2025-06-26$333,900 Active
ⓘ Source: listings_history table (triggers on properties + properties_extension) + one-shot
backfill from property_details.listing_events for pre-trigger history.
Climate risk First Street
- Flood 8/10 Severe FEMA zone X (unshaded) · 99% chance over 30 yrs
- Wildfire 3/10 Moderate
- Heat 9/10 Extreme 7 d/yr ≥110°F today · 25 d/yr by 30 yrs out
- Wind 9/10 Extreme 99% chance of damaging wind over 30 yrs
- Air quality 3/10 Moderate 3 unhealthy d/yr today · 3 by 30 yrs out
Nearby sold comps map
Loading sold comps map…
Walkable amenities ~0.75 mi
Loading nearby amenities…
Taxation est. · year 1
- Rental income
- $23,865
- − Mortgage interest
- −$9,803
- − Property taxes
- −$2,625
- − Insurance
- −$1,672
- − Repairs & maintenance
- −$1,909
- − Management
- −$1,909
- − HOA
- −$432
- − Depreciation
- −$5,091
- Taxable income
- $424
- Est. tax owed @ 24.0%
- −$102
- After-tax cash flow
- $3,010/yr
For passive investors: Depreciation is non-cash, so a rental often shows a tax loss while cash-flowing — sheltering income. Rental losses are passive: they offset passive income freely, and up to $25,000/yr can offset ordinary (W-2) income if you actively participate and your MAGI is under $100k (phasing out to $0 by $150k); unused losses carry forward. On sale, claimed depreciation is recaptured at up to 25%, and gains may owe capital-gains tax (a 1031 exchange can defer both). Figures are a year-1 estimate at your 24.0% rate — not tax advice; consult a CPA.
Condition & rehab AI · 1 photo
This single-family home requires moderate renovations, focusing on exterior and interior painting, to significantly enhance its resale and rental value.
Repairs flagged
- Major exterior siding — Significant wear and tear
- Major interior walls and paint — Paint appears chipped and worn
Value-add opportunities
- Both paint exterior — Enhances curb appeal and resale value
- Both paint interior walls — Improves interior appearance and rental appeal
Renovation cost estimate screening
| Repair item | Severity | Est. cost |
|---|---|---|
| exterior siding · Significant wear and tear | Major | $15,000–50,000 |
| interior walls and paint · Paint appears chipped and worn | Major | $15,000–50,000 |
| Total estimated repair cost · 2 items | $30,000–100,000 |
Value-add ROI direction
- Both paint exterior — Enhances curb appeal and resale value ↑
- Both paint interior walls — Improves interior appearance and rental appeal ↑
ⓘ Cost ranges are severity-bucket heuristics (US national rule-of-thumb). Get contractor quotes + a written scope before underwriting a rehab budget.
Schools (NCES district)
- District
- Houston ISD
- NCES district ID
- 4823640
- Math proficiency
- 27% ▼ -18.00%
- Reading proficiency
- 35% ▼ -6.00%
- Median HH income
- $46,054
- Composite
- 26.63/100
- National rank
- #7173
- State rank
- #593 of 826 in TX
Livability — Houston
- Score
- 74/100
- State rank
- #184
- US rank
- #4771
Category grades
Schools grade is shown separately in the Schools card above.
Census & demographics
- Census place
- Houston, TX
- County
- Harris County · 4,702,590 people
- City population
- 3,226,434
- Metro
- Houston-The Woodlands-Sugar Land, TX
- Population (ZIP)
- 29,841
- Household income
- $47,677
- Rent vs Own
- Severe rent burden
- 1297.0
Population outlook (Harris County) Hauer SSP2
- Today (2025)
- 5,571,493 people
- By 2030
- 6,089,821 · +9.3%
- By 2040
- 7,142,806 · +28.2%
- By 2050
- 8,185,864 · +46.9%
- By 2075
- 10,574,329 · +89.8%
- By 2100
- 12,109,958 · +117.4%
Race, ethnicity, and origin ACS 2023
- Neighborhood character
- Majority Black (56%)
- Race & ethnicity
- Black 56% Hispanic / Latino 42% Two or more races 28%
- Hispanic origin (detail)
- Mexican 34%
- Foreign-born
- 18% · Canada
- Languages at home
- 61% English-only · Spanish 37%
Political lean MEDSL · Harris
- 2024 margin
- Lean D (+5.5) · D 52.0% · R 46.4% · Other 1.6%
- 2008→2024 swing
- +3.9pp toward D · 2008: 1.6pp · 2024: 5.5pp
- All cycles
- 2024: D+5.5 2020: D+13.3 2016: D+12.4 2012: D+0.1 2008: D+1.6
Not yet ingested
- Civics
- —
Market trends
- HPI YoY
- ▲ 8.65%
- Current HPI
- 315.6765
- Rent YoY
- ▲ 0.44%
- Metro
- Houston-The Woodlands-Sugar Land, TX
- State GDP YoY
- ▲ 3.95%
- F500 in state
- 110
Industry mix (Fortune 500 HQ in TX)
| Industry | F500 HQs | Revenue |
|---|---|---|
| Energy | 16 | $1,198B |
|
||
| Technology | 5 | $198B |
|
||
| Engineering / Construction | 4 | $72B |
|
||
| Energy Services | 3 | $60B |
|
||
| Utilities | 3 | $41B |
|
||
| Healthcare | 2 | $330B |
|
||
Price history
-47.6% since first listed14 events — show timeline
- 2026-06-16 Sold (MLS) — HARMLS
- 2026-05-30 Pending — HARMLS
- 2026-05-21 Pending — HARMLS
- 2026-05-14 Listed $175,000 HARMLS
- 2026-02-24 Rental Removed $2,449 HARMLS
- 2026-01-27 Listed for Rent $2,449 HARMLS
- 2025-12-19 Sold (MLS) — HARMLS
- 2025-09-19 Pending — HARMLS
- 2025-09-05 Listed $332,900 HARMLS
- 2025-08-29 Listing Removed — HARMLS
- 2025-08-11 Relisted — HARMLS
- 2025-07-15 Pending — HARMLS
- 2025-07-02 Price Changed $332,900 HARMLS
- 2025-06-26 Listed $333,900 HARMLS
Cash-flow waterfall
monthlySold comps — $/sqft
last 12 mo · ≤1 miLoading sold comps…