 Multi-family
544 E Rue Royale · Covina, CA
Flood risk No data
- FEMA flood zone
- —
- Chance of flooding over 30 yrs
- —
- Est. flood insurance / yr
- —
Fire risk No data
- Est. fire insurance / yr
- —
Heat risk No data
- Hot days now (above threshold)
- —
- Hot days in 30 yrs
- —
Wind risk No data
- Chance of severe wind over 30 yrs
- —
Air-quality risk No data
- Unhealthy air days now
- —
- Unhealthy air days in 30 yrs
- —
Risk factors via First Street. Map © Google.
Why this score? — see what drove the C+ grade
The composite is a weighted blend of 9 inputs, each scored 0–100. Each bar is that input's sub-score; the figure is the points it added to the 100-point composite (weight × sub-score).
- Cash flow +26.9/30.0
- DSCR +9.3/10.0
- ARV discount +7.5/15.0
- 1% rule +7.2/10.0
- Schools +4.4/10.0
- Rent growth +4.3/5.0
- Livability +3.6/5.0
- Condition / age +1.0/5.0
- Appreciation +0.0/10.0
$2,388,000
🖨 Deal sheet (PDF) 📄 Offer letter ✓ Due diligence
Multi-family units
County records classify this as Multi-Family (5+ Unit). Listing-text estimate: 1 unit. estimate disagrees with records
5+ unit building — per-unit beds/baths from public records are typically unavailable; the breakdown below (if shown) is an estimate from the listing text.
Listing remarks MLS
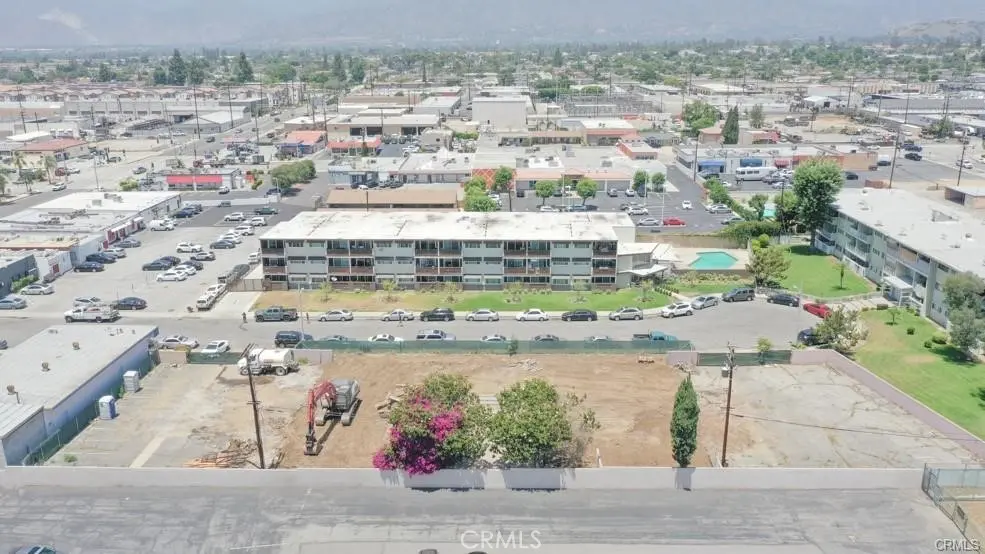
Prime Opportunity in the Heart of Covina, minutes away from downtown. 10 & 210 Freeways, school and hospital located conveniently nearby. Zoned for high density housing, this parcel of land expands a 26,605 square foot lot. The previous structure has already been completely removed and is ready for new construction. Rue Royale offers the setting for visionary developers looking for an investment opportunity with great potential, ideal for developing 13 townhomes. Instead of buying an old apartment building, build your own brand new one. Don't miss out on your chance!
Key facts
- 26
- 605 square foot lot
- 0.61 acre lot
Tags
Neighborhood map
What this means for you Summary
Snapshot
- This is a multifamily listed at $2.39M. Condition is rated poor.
Deal economics
- At list price, monthly cash flow is $7k ($79k/yr) — positive.
- The deal already cash-flows at list — no discount required.
- Meets the 1% rule at list price ($29k rent vs $2.39M).
- Recommended offer: $2.10M (12.0% below list) — sets the bar for market timing.
- Cap rate 9.6% vs local median 2.3% in Covina — top-decile yield for the area; either an underpriced asset or a hidden risk that comps aren't pricing in. Stress-test before assuming the spread holds.
Location & tenants
- Location reads 72/100 on livability (#181 in CA) — a middle-class / working-renter tenant base. Strengths: amenities A+, commute A+, employment A+; Watch: crime C-, health & safety C-, cost of living F.
- Covina-Valley Unified (suburban): math 39% / reading 55% proficiency, ranked #462 of 1,400 in CA (top 33%) — families likely to look elsewhere, expect single-tenant / working-renter base with shorter leases.
- Zoned schools: Ben Lomond Elementary (420 students, 70% FRL); Sierra Vista Middle (770 students, 64% FRL); South Hills High (1,640 students, 53% FRL).
- Market conditions: Rents rising fast (+7.2%/yr); 31 active listings in the ZIP; 40 comparable units currently listed for rent nearby; rentals at typical pace (median 19d on market — plan ~3-4 weeks tenant-placement turnaround); solid renter incomes; 19,697 units permitted in Los Angeles County in 2024 (9,426 in 5+ unit buildings).
- At $29,247/mo this rent would consume 373% of the median local household income ($94k/yr) (locally 792% of renters already pay >50% of income on rent) — very limited rent-growth headroom before tenants either downsize or default.
Forward outlook
- Local home prices are declining (-3.0%/yr); year-one equity from $17k of loan paydown is wiped out by about $72k of value loss. Plan a longer hold.
- Los Angeles County population projected at +9% by 2050 — modest demand growth; plan on rents tracking national, not racing it.
- At projected returns (-3.0% appreciation + 7.2% rent growth), your $669k cash investment doubles in ~7 years — after that, you're playing with house money.
Negotiation context
- It's been on market 187 days — a 12% lower offer ($2.10M) is reasonable based on typical stale-listing flexibility.
- 3 sale attempts with the ask held roughly flat each time — persistent listings suggest the price (not the market) is what's stuck; bring a comps-based counter.
- Current owner paid $675k; list at $2.39M implies a 254% gain — meaningful room to come down on a strong offer.
Questions for the listing agent
- It's been on market 187 days. Have you received any prior offers? Is the seller open to a 12% concession, seller financing, or rate buy-down credit?
- Have any recent inspections been done? Can we get a copy of the seller's disclosures and any deferred-maintenance estimates?
- Why hasn't it sold? Are there any deal-killer items the seller is aware of (foundation, flood, title, zoning, code violations)?
- Is there a deadline driving the sale (1031 exchange, divorce, estate, relocation)? That informs how much negotiation room exists.
- What's the average days-on-market for RENTAL listings here right now (not sales)? A rising rental-DOM trend means longer vacancies and softer asking-rent achievability than the comps imply.
- What's the recent tenant-quality profile in this submarket — average credit score on applications, eviction rate, late-payment / NSF rate, and stable-employment percentage? A property-management company in the area should have these aggregated.
- How much new apartment / multifamily construction is in the pipeline within 1–3 miles? Heavy new supply (>2% of stock underway) typically softens rents 12–24 months out; light construction supports rent growth.
Investment metrics
- 1% rule
- 1.22% ✓
- Cap rate
- 9.61%
- Cash-on-cash
- 11.85%
- DSCR
- 1.53
- GRM
- 6.8
CMA / ARV
- ARV (median comp)
- $4,383,778,034
- List price
- $2,388,000
- Delta
- -99.95%
- Verdict
- UNDERPRICED
- Comps
- 2 within 2.0 mi
Show comp detail 12 sales within ~0.75 mi
| Address | Dist | Beds/Ba | Sqft | Sold | Price | $/sf | Match |
|---|---|---|---|---|---|---|---|
| 206 N Grandview | 0.16mi | 8/4.0 | 3,072 | 0mo | $1,020,000 | $332 | 80 |
| 316 E School | 0.30mi | 10/4.0 | 1,796 | 4mo | $870,000 | $484 | 70 |
| 554 E Hurst St | 0.32mi | 8/4.0 | 3,464 | 7mo | $1,050,000 | $303 | 66 |
| 540 N Howard St | 0.39mi | 4/2.0 | 1,450 | 7mo | $725,000 | $500 | 64 |
| 270 E Badillo St | 0.42mi | 13/12.0 | 8,673 | 10mo | $3,150,000 | $363 | 60 |
| 251 E Center St | 0.47mi | 6/5.0 | 2,910 | 7mo | $1,400,000 | $481 | 60 |
| 331 E Puente | 0.52mi | 8/4.0 | 3,719 | 5mo | $1,350,000 | $363 | 59 |
| 456 E Puente St | 0.50mi | 6/5.0 | 3,564 | 10mo | $1,130,000 | $317 | 56 |
| 500 S 1st Ave | 0.67mi | 10/8.0 | 4,798 | 2mo | $1,820,000 | $379 | 54 |
| 316 E Puente St | 0.57mi | 4/2.0 | 1,848 | 8mo | $885,000 | $479 | 54 |
| 305 E Navilla Pl | 0.64mi | 8/6.0 | 3,672 | 8mo | $1,475,000 | $402 | 51 |
| 215 E Navilla Pl | 0.69mi | 7/6.0 | 4,130 | 9mo | $1,200,000 | $291 | 48 |
Match score weights: distance 35% · size 25% · config 20% · recency 20%. Top-matched comps best support the ARV.
Projected returns pro-forma
-3.0% appreciation · 7.23% rent growth · sell at horizon
- IRR
- 6.0%
- Equity multiple
- 1.24×
- Total profit
- $163,754
- Equity at exit
- $356,059
- IRR
- 18.9%
- Equity multiple
- 2.89×
- Total profit
- $1,266,987
- Equity at exit
- $206,471
Cash invested: $668,640 (down + closing). Projections, not guarantees.
Landlord ↔ Tenant lean methodology
- Overall (STATE)
- 18 Strongly Tenant-Friendly
- State California
- 18 Strongly Tenant-Friendly · D+13
- County
- — inherits STATE
- City
- — inherits STATE
ZIP-level market 91723
- Rents YoY
- 7.2%
- Active inventory
- 31
- Price-to-rent
- 88.5×
Monthly cashflow live
- Estimated rent
- $29,247 high interval (Pro) →
- Mortgage (P&I)
- −$12,523
- Tax est. 1.5%
- −$2,985 /mo · $35,820/yr
- Insurance
- −$995
- HOA
- −$0
- Vacancy / Maint / Mgmt
- −$6,142
- Net cashflow
- $6,602
Break-even live
Sensitivity live
| Price | -10% $8,252 | -5% $7,427 | +0% $6,602 | +5% $5,777 | +10% $4,952 |
|---|---|---|---|---|---|
| Rent | -10% $4,292 | -5% $5,447 | +0% $6,602 | +5% $7,757 | +10% $8,913 |
| Rate | -1.0pp $7,805 | -0.5pp $7,210 | base $6,602 | +0.5pp $5,983 | +1.0pp $5,354 |
13-unit breakdown (identical units grouped — click to expand)
| Units | Beds | Baths | Est. rent |
|---|---|---|---|
| 13× units | 2 | 1 | $29,250 |
| #1 | 2 | 1 | $2,250 |
| #2 | 2 | 1 | $2,250 |
| #3 | 2 | 1 | $2,250 |
| #4 | 2 | 1 | $2,250 |
| #5 | 2 | 1 | $2,250 |
| #6 | 2 | 1 | $2,250 |
| #7 | 2 | 1 | $2,250 |
| #8 | 2 | 1 | $2,250 |
| #9 | 2 | 1 | $2,250 |
| #10 | 2 | 1 | $2,250 |
| #11 | 2 | 1 | $2,250 |
| #12 | 2 | 1 | $2,250 |
| #13 | 2 | 1 | $2,250 |
| Total (13 units) | $29,247 | ||
UW: 25.0% down · 7.5% · 30yr · 1.5% tax · 5.0% vac · 8.0% maint · 8.0% mgmt
Financing live
Cash to close
- Down payment
- $597,000
- Closing costs
- $71,640
- Reserves months
- —
- Total cash needed
- —
Loan-product check · same deal, 3 products live
Conventional
25% down · 7.5% · 30yr
- Down + closing
- —
- Monthly P&I
- —
- Monthly cashflow
- —
- DSCR
- —
- Eligible?
- —
Personal DTI + credit; lowest rate.
DSCR
20% down · 8.5% · 30yr
- Down + closing
- —
- Monthly P&I
- —
- Monthly cashflow
- —
- DSCR
- —
- Eligible?
- —
No personal income docs; deal must DSCR.
Hard money
10% down · 12.0% · 12mo
- Down + closing
- —
- Monthly P&I
- —
- Monthly cashflow
- —
- DSCR
- —
- Eligible?
- —
Short-term bridge; refi at stabilization.
Rent comps 40 comps
| Address | Beds | Baths | Sqft | Rent | $/sqft | DOM | Units | Dist |
|---|---|---|---|---|---|---|---|---|
| 545 E Rue Royale St Apt 20 Covina, CA | 2.0 | 1.5 | — | $2,400 | — | 20d | 1 | 0.06mi |
| 367 N Prospero Dr Covina, CA | 2.0 | 2.0 | 1000 | $1,950 | $1.95 | 9d | 1 | 0.08mi |
| 628 E Italia St Unit 3 Covina, CA | 2.0 | 1.5 | 900 | $1,850 | $2.06 | 9d | 1 | 0.11mi |
| 417 E Badillo St Covina, CA | 2.0 | 1.5 | 1150 | $2,550 | $2.22 | 21d | 1 | 0.24mi |
| 111 S Barranca Ave Covina, CA | 1.0 | 1.0 | 687 | $2,195 | $3.20 | 5d | 1 | 0.24mi |
| 111 S Barranca Ave Covina, CA | 2.0 | 1.0 | 957 | $2,445 | $2.55 | 14d | 1 | 0.24mi |
| 111 S Barranca Ave Covina, CA | 1.0 | 1.0 | 687 | $2,035 | $2.96 | 17d | 1 | 0.24mi |
| 111 S Barranca Ave Covina, CA | 1.0 | 1.0 | 687 | $2,035 | $2.96 | 45d | 1 | 0.24mi |
| 345 E College St Covina, CA | 2.0 | 2.0 | 1300 | $2,795 | $2.15 | 26d | 1 | 0.28mi |
| 461 E Algrove St Unit Algrove Covina, CA | 2.0 | 1.0 | — | $1,975 | — | 0d | 1 | 0.29mi |
| 364 E Badillo St Unit 368 1/2 Covina, CA | 1.0 | 1.0 | 592 | $1,725 | $2.91 | 3d | 1 | 0.32mi |
| 364 E Badillo St Unit 372 Covina, CA | 1.0 | 1.0 | 592 | $1,750 | $2.96 | 14d | 1 | 0.32mi |
| 554 E Hurst St Unit 2 Covina, CA | 2.0 | 1.0 | 866 | $2,650 | $3.06 | 6d | 1 | 0.35mi |
| 749 Marmalade Pl Covina, CA | 3.0 | 2.0 | 1620 | $3,600 | $2.22 | 3d | 1 | 0.36mi |
| 501 E Hurst St Unit 2 Covina, CA | 2.0 | 1.0 | 866 | $1,900 | $2.19 | 4d | 1 | 0.38mi |
| 826 N Barranca Ave Unit 13 Covina, CA | 1.0 | 1.0 | — | $1,900 | — | 26d | 1 | 0.41mi |
| 826 N Barranca Ave Covina, CA | 1.0–2.0 | 1.0–2.0 | 762 | $2,295 | $3.01 | 45d | 2 | 0.41mi |
| 826 N Barranca Ave Apt A Covina, CA | 1.0 | 1.0 | — | $1,900 | — | 45d | 1 | 0.41mi |
| 514 E Cypress St Covina, CA | 1.0 | 1.0 | — | $1,900 | — | 45d | 1 | 0.44mi |
| 514 E Cypress St Covina, CA | 1.0 | 1.0 | — | $1,900 | — | 26d | 1 | 0.44mi |
| 321 S San Jose Ave Covina, CA | 2.0 | 1.5 | 990 | $2,595 | $2.62 | 0d | 2 | 0.44mi |
| 445 E Puente St Covina, CA | 2.0 | 1.0 | 992 | $2,900 | $2.92 | 22d | 1 | 0.45mi |
| 255 E Center St Covina, CA | 1.0 | 1.0 | 625 | $2,195 | $3.51 | 9d | 1 | 0.45mi |
| 530 E Cypress St Unit 08 Covina, CA | 2.0 | 1.0 | — | $2,149 | — | 26d | 1 | 0.47mi |
| 409 E Puente St Covina, CA | 3.0 | 2.0 | 1600 | $3,095 | $1.93 | 26d | 1 | 0.47mi |
| 253 E Center St Covina, CA | 1.0 | 1.0 | 625 | $2,295 | $3.67 | 9d | 1 | 0.47mi |
| 320 S 1st Ave Covina, CA | 2.0 | 2.0 | 1090 | $2,595 | $2.38 | 19d | 1 | 0.50mi |
| 959 E Edgecomb St Covina, CA | 3.0 | 2.0 | 1335 | $5,000 | $3.75 | 4d | 1 | 0.53mi |
| 316 Orange Blossom Covina, CA | 3.0 | 4.0 | 1610 | $3,650 | $2.27 | 0d | 1 | 0.55mi |
| 216 S Grand Ave Covina, CA | 2.0 | 2.0 | — | $2,275 | — | 4d | 1 | 0.59mi |
| 370 E Navilla Pl Unit 370-10 Covina, CA | 1.0 | 1.0 | — | $1,750 | — | 45d | 1 | 0.60mi |
| 228 E Puente St Unit 230 Covina, CA | 2.0 | 1.0 | 1080 | $2,550 | $2.36 | 18d | 1 | 0.61mi |
| 707 N Park Ave Covina, CA | 2.0 | 2.0 | 900 | $2,900 | $3.22 | 45d | 1 | 0.62mi |
| 265 E Navilla Pl Unit 206 Covina, CA | 1.0 | 1.0 | 750 | $1,695 | $2.26 | 26d | 1 | 0.63mi |
| 306 1/2 E Navilla Pl Unit 306 Covina, CA | 1.0 | 1.0 | — | $1,785 | — | 45d | 1 | 0.64mi |
| 255 E Navilla Pl Unit 255-A Covina, CA | 2.0 | 1.0 | — | $2,100 | — | 4d | 1 | 0.64mi |
| 255 E Navilla Pl Unit 255-F Covina, CA | 1.0 | 1.0 | — | $1,650 | — | 5d | 1 | 0.64mi |
| 136 W Orange St Covina, CA | 1.0 | 1.0 | 650 | $2,200 | $3.38 | 26d | 1 | 0.65mi |
| 532 Stewart Dr Covina, CA | 2.0 | 1.0 | 800 | $2,600 | $3.25 | 9d | 1 | 0.67mi |
| 242 E Navilla Pl Unit 248 Covina, CA | 1.0 | 1.0 | 650 | $1,695 | $2.61 | 23d | 1 | 0.67mi |
Listing history 23 events
-
2026-06-21days on market $2,388,000 Active 187 DOM
-
2026-06-18days on market $2,388,000 Active 184 DOM
-
2026-06-17days on market $2,388,000 Active 183 DOM
-
2026-06-16days on market $2,388,000 Active 182 DOM
-
2026-06-15days on market $2,388,000 Active 181 DOM
-
2026-06-13days on market $2,388,000 Active 179 DOM
-
2026-06-13days on market $2,388,000 Active 178 DOM
-
2026-06-09days on market $2,388,000 Active 175 DOM
-
2026-06-08days on market $2,388,000 Active 174 DOM
-
2026-06-07days on market $2,388,000 Active 173 DOM
-
2026-06-04days on market $2,388,000 Active 170 DOM
-
2026-06-03days on market $2,388,000 Active 169 DOM
-
2026-06-02days on market $2,388,000 Active 168 DOM
-
2026-06-01days on market $2,388,000 Active 167 DOM
-
2026-05-31days on market $2,388,000 Active 166 DOM
-
2025-12-16$2,388,000 Active 579-char remark
Show marketing remark (579 chars)
Prime Opportunity in the Heart of Covina, minutes away from downtown. 10 & 210 Freeways, school and hospital located conveniently nearby. Zoned for high density housing, this parcel of land expands a 26,605 square foot lot. The previous structure has already been completely removed and is ready for new construction. Rue Royale offers the setting for visionary developers looking for an investment opportunity with great potential, ideal for developing 13 townhomes. Instead of buying an old apartment building, build your own brand new one. Don't miss out on your chance!
-
2025-09-17historical
-
2025-08-13$2,980,000 Active
-
2025-05-07soldstatus $675,000 Closed Sale
-
2025-02-12status Pending Sale
-
2025-02-01historical Active Under Contract
-
2025-02-01price $650,000
-
2025-01-26$200,000 Active
ⓘ Source: listings_history table (triggers on properties + properties_extension) + one-shot
backfill from property_details.listing_events for pre-trigger history.
Nearby sold comps map
Loading sold comps map…
Walkable amenities ~0.75 mi
Loading nearby amenities…
Taxation est. · year 1
- Rental income
- $350,964
- − Mortgage interest
- −$133,765
- − Property taxes
- −$35,820
- − Insurance
- −$11,940
- − Repairs & maintenance
- −$28,077
- − Management
- −$28,077
- − Depreciation
- −$69,469
- Taxable income
- $43,816
- Est. tax owed @ 24.0%
- −$10,516
- After-tax cash flow
- $68,711/yr
For passive investors: Depreciation is non-cash, so a rental often shows a tax loss while cash-flowing — sheltering income. Rental losses are passive: they offset passive income freely, and up to $25,000/yr can offset ordinary (W-2) income if you actively participate and your MAGI is under $100k (phasing out to $0 by $150k); unused losses carry forward. On sale, claimed depreciation is recaptured at up to 25%, and gains may owe capital-gains tax (a 1031 exchange can defer both). Figures are a year-1 estimate at your 24.0% rate — not tax advice; consult a CPA.
Condition & rehab AI · 4 photos
This property is in a state of complete disrepair and requires extensive renovation. It offers a unique opportunity for developers to build 13 townhomes on a 26,605 square foot lot.
Repairs flagged
- Major roof — No visible roof
- Major exterior siding — No visible exterior siding
- Major interior walls — No visible interior walls
Value-add opportunities
- Both New construction of 13 townhomes — High potential for development and increased property value
- Both Landscaping and curb appeal improvements — Enhances visual appeal and property value
Renovation cost estimate screening
| Repair item | Severity | Est. cost |
|---|---|---|
| roof · No visible roof | Major | $15,000–50,000 |
| exterior siding · No visible exterior siding | Major | $15,000–50,000 |
| interior walls · No visible interior walls | Major | $15,000–50,000 |
| Total estimated repair cost · 3 items | $45,000–150,000 |
Value-add ROI direction
- Both New construction of 13 townhomes — High potential for development and increased property value ↑
- Both Landscaping and curb appeal improvements — Enhances visual appeal and property value ↑
ⓘ Cost ranges are severity-bucket heuristics (US national rule-of-thumb). Get contractor quotes + a written scope before underwriting a rehab budget.
Schools (NCES district)
- District
- Covina-Valley Unified
- NCES district ID
- 0610050
- Math proficiency
- 39% ▲ 2.00%
- Reading proficiency
- 55% ▲ 2.00%
- Median HH income
- $65,808
- Composite
- 43.91/100
- National rank
- #6290
- State rank
- #462 of 1400 in CA
Livability — Covina
- Score
- 72/100
- State rank
- #181
- US rank
- #5811
Category grades
Schools grade is shown separately in the Schools card above.
Census & demographics
- Census place
- Covina, CA
- County
- Los Angeles County · 9,444,647 people
- City population
- 81,184
- Metro
- Los Angeles-Long Beach-Anaheim, CA
- Population (ZIP)
- 17,733
- Household income
- $94,167
- Rent vs Own
- Severe rent burden
- 792.0
Population outlook (Los Angeles County) Hauer SSP2
- Today (2025)
- 10,940,515 people
- By 2030
- 11,256,481 · +2.9%
- By 2040
- 11,729,929 · +7.2%
- By 2050
- 11,948,407 · +9.2%
- By 2075
- 11,818,114 · +8.0%
- By 2100
- 10,842,928 · -0.9%
Race, ethnicity, and origin ACS 2023
- Neighborhood character
- Diverse neighborhood (Simpson 0.55)
- Race & ethnicity
- Hispanic / Latino 63% Two or more races 22% White 19% Asian 11% Black 4% Native American 1%
- Hispanic origin (detail)
- Mexican 52% Cuban 1%
- Common ancestry
- Lithuanian 1% Russian 1% Iranian 1%
- Foreign-born
- 22% · Canada, China, Vietnam
- Languages at home
- 56% English-only · Spanish 33% Chinese 3% Tagalog/Filipino 2%
Political lean MEDSL · Los Angeles
- 2024 margin
- Solid D (+32.9) · D 64.8% · R 31.9% · Other 3.3%
- 2008→2024 swing
- -7.4pp toward R · 2008: 40.4pp · 2024: 32.9pp
- All cycles
- 2024: D+32.9 2020: D+44.2 2016: D+48.0 2012: D+40.0 2008: D+40.4
Not yet ingested
- Civics
- —
Market trends
- HPI YoY
- ▼ -540.18%
- Current HPI
- 426.3313
- Rent YoY
- ▲ 7.23%
- Metro
- Los Angeles-Long Beach-Anaheim, CA
- State GDP YoY
- ▲ 3.21%
- F500 in state
- 116
Industry mix (Fortune 500 HQ in CA)
| Industry | F500 HQs | Revenue |
|---|---|---|
| Technology | 27 | $1,492B |
|
||
| Financial Services | 3 | $174B |
|
||
| Retail | 3 | $44B |
|
||
| Insurance | 3 | $26B |
|
||
| Media / Entertainment | 2 | $115B |
|
||
| Pharmaceuticals / Biotech | 2 | $62B |
|
||
Price history
+1094.0% since first listed8 events — show timeline
- 2025-12-16 Listed $2,388,000 CRMLS
- 2025-09-17 Listing Removed — CRMLS
- 2025-08-13 Listed $2,980,000 CRMLS
- 2025-05-07 Sold (MLS) $675,000 CRMLS
- 2025-02-12 Pending — CRMLS
- 2025-02-01 Contingent — CRMLS
- 2025-02-01 Price Changed $650,000 CRMLS
- 2025-01-26 Listed $200,000 CRMLS
Cash-flow waterfall
monthlySold comps — $/sqft
last 12 mo · ≤1 miLoading sold comps…