 Multi-family
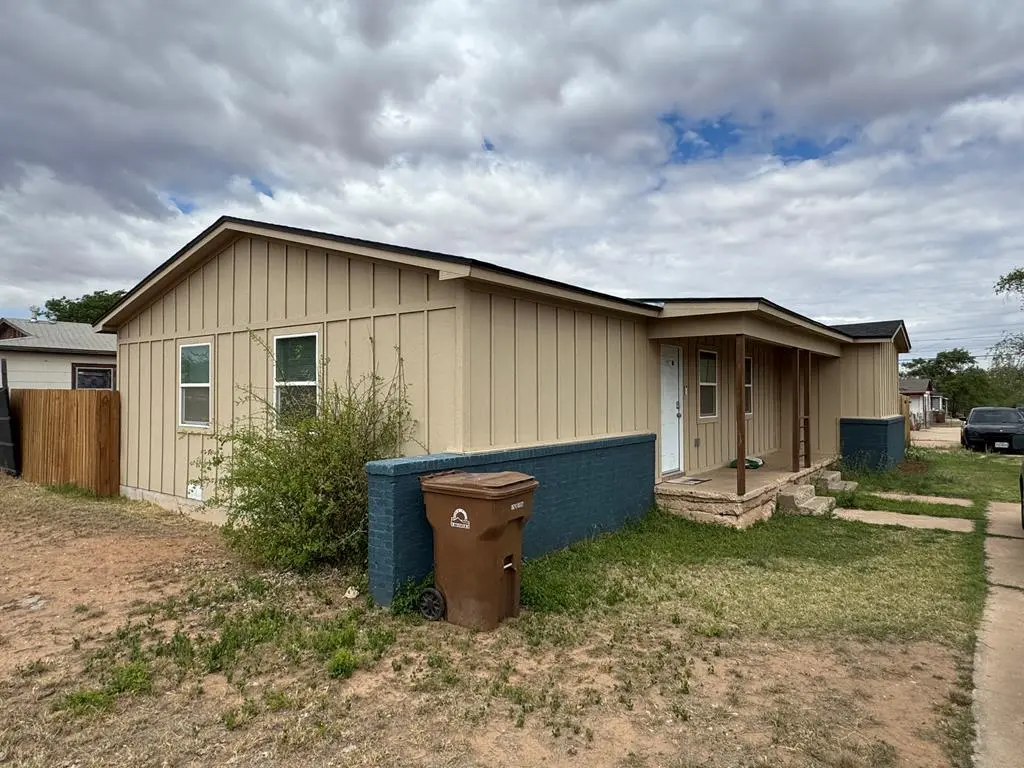
1511 Wood St · Big Spring, TX
Flood risk 1/10 · Minimal
- FEMA flood zone
- X (unshaded)
- Chance of flooding over 30 yrs
- 0.0%
- Est. flood insurance / yr
- $507 – $1,088
Fire risk 9/10 · Severe
- Est. fire insurance / yr
- $1,222 – $2,270
Heat risk 6/10 · Moderate
- Hot days now (above 102°F)
- 7 days/yr
- Hot days in 30 yrs
- 22 days/yr
Wind risk 2/10 · Minimal
- Chance of severe wind over 30 yrs
- 3.0%
Air-quality risk 1/10 · Minimal
- Unhealthy air days now
- 0 days/yr
- Unhealthy air days in 30 yrs
- 0 days/yr
Risk factors via First Street. Map © Google.
Why this score? — see what drove the B- grade
The composite is a weighted blend of 9 inputs, each scored 0–100. Each bar is that input's sub-score; the figure is the points it added to the 100-point composite (weight × sub-score).
- Cash flow +30.0/30.0
- 1% rule +10.0/10.0
- DSCR +10.0/10.0
- ARV discount +7.5/15.0
- Livability +3.1/5.0
- Rent growth +2.5/5.0
- Schools +2.5/10.0
- Condition / age +2.5/5.0
- Appreciation +0.0/10.0
$175,000
🖨 Deal sheet 📄 Offer letter ✓ Due diligence
Multi-family units
County records classify this as Multi-Family (2-4 Unit). Listing-text estimate: 1 unit. estimate disagrees with records
Listing remarks MLS
Taken down to the studs and completely rebuilt, this 3 bed, 2 bath home at 1511 Wood St offers 1,277 sq ft of beautifully updated space. With brand-new electrical and plumbing run all the way to city connections, no detail was overlooked. Enjoy a clean, modern interior that's truly move-in ready. A fantastic opportunity to own a like-new home with all the upgrades already done!
Key facts
- Modern interior
- Move-in ready
- New plumbing
Tags
Neighborhood map
What this means for you Summary
Snapshot
- This is a 3-bed/2.0-bath multifamily listed at $175k.
Deal economics
- At list price, monthly cash flow is $865 ($10k/yr) — positive.
- The deal already cash-flows at list — no discount required.
- Meets the 1% rule at list price ($3k rent vs $175k).
- Recommended offer: $170k (3.0% below list) — sets the bar for market timing.
Location & tenants
- Location reads 62/100 on livability (#948 in TX) — a middle-class / working-renter tenant base. Strengths: cost of living A+, housing A+, health & safety A+; Watch: employment C-, schools F, crime F.
- Big Spring ISD (town): math 29% / reading 30% proficiency, ranked #641 of 826 in TX (top 78%) — low school quality limits family demand, transient renter base, plan for 1-2y turnover; 63% free/reduced lunch — lower-income household profile, screen leases tightly.
- Market conditions: 266 active listings in the ZIP; 9 comparable units currently listed for rent nearby; rentals at typical pace (median 25d on market — plan ~3-4 weeks tenant-placement turnaround); 69 units permitted in Howard County in 2024 (5 in 5+ unit buildings).
- At $2,653/mo this rent would consume 46% of the median local household income ($69k/yr) (locally 638% of renters already pay >50% of income on rent) — very limited rent-growth headroom before tenants either downsize or default.
Forward outlook
- Local home prices are declining (-3.0%/yr); year-one equity from $1k of loan paydown is wiped out by about $5k of value loss. Plan a longer hold.
- Howard County population projected at +42% by 2050 — long-run rental-demand tailwind backs the buy-and-hold thesis.
- At projected returns (-3.0% appreciation + 3.0% rent growth), your $49k cash investment doubles in ~6 years — after that, you're playing with house money.
Negotiation context
- It's been on market 60 days — a 3% lower offer ($170k) is reasonable based on typical stale-listing flexibility.
Risks & watch-outs
- Watch-outs: built in 1950 — expect roof / HVAC / electrical / plumbing capex.
- Climate carrying-cost: severe wildfire risk; extreme-heat days projected 7→22/yr by 2055 (HVAC capex compounding) — expect insurance premiums to compound above CPI over the hold.
Questions for the listing agent
- It's been on market 60 days. Have you received any prior offers? Is the seller open to a 3% concession, seller financing, or rate buy-down credit?
- Built in 1950 — when were the roof, HVAC, electrical panel, plumbing, and water heater last replaced?
- Is there a deadline driving the sale (1031 exchange, divorce, estate, relocation)? That informs how much negotiation room exists.
- Schools are F-rated, which usually means shorter tenancies and higher turnover. Who's the typical renter profile here, and what's been the actual vacancy rate?
- Crime grade is F in this area — have there been break-ins, vandalism, or insurance claims at this property in the last 3 years? What carrier currently insures it and at what premium?
- What's the average days-on-market for RENTAL listings here right now (not sales)? A rising rental-DOM trend means longer vacancies and softer asking-rent achievability than the comps imply.
- What's the recent tenant-quality profile in this submarket — average credit score on applications, eviction rate, late-payment / NSF rate, and stable-employment percentage? A property-management company in the area should have these aggregated.
- How much new apartment / multifamily construction is in the pipeline within 1–3 miles? Heavy new supply (>2% of stock underway) typically softens rents 12–24 months out; light construction supports rent growth.
Investment metrics
- 1% rule
- 1.52% ✓
- Cap rate
- 12.23%
- Cash-on-cash
- 21.19%
- DSCR
- 1.94
- GRM
- 5.5
CMA / ARV
- ARV (median comp)
- $53,050
- List price
- $175,000
- Delta
- 229.87%
- Verdict
- OVERPRICED
- Comps
- 3 within 1.0 mi
Projected returns pro-forma
-3.0% appreciation · 3.0% rent growth · sell at horizon
- IRR
- 13.7%
- Equity multiple
- 1.55×
- Total profit
- $26,815
- Equity at exit
- $26,093
- IRR
- 22.5%
- Equity multiple
- 2.93×
- Total profit
- $94,540
- Equity at exit
- $15,131
Cash invested: $49,000 (down + closing). Projections, not guarantees.
Landlord ↔ Tenant lean methodology
- Overall (STATE)
- 87 Strongly Landlord-Friendly
- State Texas
- 87 Strongly Landlord-Friendly · R+5
- County
- — inherits STATE
- City
- — inherits STATE
ZIP-level market 79720
- Active inventory
- 266
- Price-to-rent
- 11.0×
Monthly cashflow live
- Estimated rent
- $2,653 medium interval (Pro) →
- Mortgage (P&I)
- −$918
- Tax from tax record
- −$240 /mo · $2,878/yr
- Insurance
- −$73
- HOA
- −$0
- Vacancy / Maint / Mgmt
- −$557
- Net cashflow
- $865
Break-even live
2-unit breakdown (identical units grouped — click to expand)
| Units | Beds | Baths | Est. rent |
|---|---|---|---|
| 2× units | 3 | 2 | $2,652 |
| #1 | 3 | 2 | $1,326 |
| #2 | 3 | 2 | $1,326 |
| Total (2 units) | $2,653 | ||
UW: 25.0% down · 7.5% · 30yr · 1.5% tax · 5.0% vac · 8.0% maint · 8.0% mgmt
Financing live
Cash to close
- Down payment
- $43,750
- Closing costs
- $5,250
- Reserves months
- —
- Total cash needed
- —
Loan-product check · same deal, 3 products live
Conventional
25% down · 7.5% · 30yr
- Down + closing
- —
- Monthly P&I
- —
- Monthly cashflow
- —
- DSCR
- —
- Eligible?
- —
Personal DTI + credit; lowest rate.
DSCR
20% down · 8.5% · 30yr
- Down + closing
- —
- Monthly P&I
- —
- Monthly cashflow
- —
- DSCR
- —
- Eligible?
- —
No personal income docs; deal must DSCR.
Hard money
10% down · 12.0% · 12mo
- Down + closing
- —
- Monthly P&I
- —
- Monthly cashflow
- —
- DSCR
- —
- Eligible?
- —
Short-term bridge; refi at stabilization.
Rent comps 9 comps
| Address | Beds | Baths | Sqft | Rent | $/sqft | DOM | Units | Dist |
|---|---|---|---|---|---|---|---|---|
| 1404 Wood St Big Spring, TX | 3.0 | 1.0 | 964 | $2,500 | $2.59 | 24d | 1 | 0.16mi |
| 1206 E 11th Pl Big Spring, TX | 3.0 | 2.0 | 1674 | $1,700 | $1.02 | 24d | 1 | 0.31mi |
| 1009 E 15th St Big Spring, TX | 2.0 | 2.0 | 1486 | $1,350 | $0.91 | 24d | 1 | 0.57mi |
| 614 Ridgelea Dr Big Spring, TX | 3.0 | 1.0 | 1100 | $1,280 | $1.16 | 5d | 1 | 0.66mi |
| 3214 Drexel Ave Big Spring, TX | 3.0 | 1.0 | 1366 | $1,700 | $1.24 | 13d | 1 | 0.92mi |
| 406 Goliad St Big Spring, TX | 3.0 | 1.0 | 1092 | $2,500 | $2.29 | 24d | 1 | 1.07mi |
| 902 Scurry St Unit F Big Spring, TX | 3.0 | 1.0 | 975 | $1,000 | $1.03 | 21d | 1 | 1.25mi |
| 2111 Runnels St Unit 1 Big Spring, TX | 3.0 | 1.0 | 1216 | $1,400 | $1.15 | 44d | 1 | 1.35mi |
| 2111 Runnels St Unit 1 Big Spring, TX | 3.0 | 1.0 | 1216 | $1,300 | $1.07 | 13d | 1 | 1.35mi |
Listing history 17 events
-
2026-06-19days on market $175,000 Active 60 DOM
-
2026-06-18days on market $175,000 Active 59 DOM
-
2026-06-17days on market $175,000 Active 58 DOM
-
2026-06-16days on market $175,000 Active 57 DOM
-
2026-06-15days on market $175,000 Active 56 DOM
-
2026-06-14days on market $175,000 Active 54 DOM
-
2026-06-12days on market $175,000 Active 53 DOM
-
2026-06-09days on market $175,000 Active 50 DOM
-
2026-06-08days on market $175,000 Active 49 DOM
-
2026-06-07days on market $175,000 Active 48 DOM
-
2026-06-05days on market $175,000 Active 45 DOM
-
2026-06-02days on market $175,000 Active 43 DOM
-
2026-06-01days on market $175,000 Active 42 DOM
-
2026-05-31days on market $175,000 Active 41 DOM
-
2026-05-30days on market $175,000 Active 40 DOM
-
2026-05-05price $175,000 380-char remark
Show marketing remark (380 chars)
Taken down to the studs and completely rebuilt, this 3 bed, 2 bath home at 1511 Wood St offers 1,277 sq ft of beautifully updated space. With brand-new electrical and plumbing run all the way to city connections, no detail was overlooked. Enjoy a clean, modern interior that's truly move-in ready. A fantastic opportunity to own a like-new home with all the upgrades already done!
-
2026-04-20$190,000 Active 380-char remark
Show marketing remark (380 chars)
Taken down to the studs and completely rebuilt, this 3 bed, 2 bath home at 1511 Wood St offers 1,277 sq ft of beautifully updated space. With brand-new electrical and plumbing run all the way to city connections, no detail was overlooked. Enjoy a clean, modern interior that's truly move-in ready. A fantastic opportunity to own a like-new home with all the upgrades already done!
ⓘ Source: listings_history table (triggers on properties + properties_extension) + one-shot
backfill from property_details.listing_events for pre-trigger history.
Tax reassessment forecast TX · Resets to sale price
- Current annual tax
- $2,878 · $240/mo
- Projected year-2 tax
- $3,202 · $267/mo
- Expected delta
- +$325/yr (+$27/mo · 11.3%)
ⓘ Screening estimate from a state-policy table — verify with the county assessor before closing.
Climate risk First Street
- Flood 1/10 Low FEMA zone X (unshaded) · 0% chance over 30 yrs
- Wildfire 9/10 Extreme
- Heat 6/10 Major 7 d/yr ≥102°F today · 22 d/yr by 30 yrs out
- Wind 2/10 Low 3% chance of damaging wind over 30 yrs
- Air quality 1/10 Low 0 unhealthy d/yr today · 0 by 30 yrs out
Nearby sold comps map
Loading sold comps map…
Walkable amenities ~0.75 mi
Loading nearby amenities…
Taxation est. · year 1
- Rental income
- $31,836
- − Mortgage interest
- −$9,803
- − Property taxes
- −$2,878
- − Insurance
- −$875
- − Repairs & maintenance
- −$2,547
- − Management
- −$2,547
- − Depreciation
- −$5,091
- Taxable income
- $8,096
- Est. tax owed @ 24.0%
- −$1,943
- After-tax cash flow
- $8,442/yr
For passive investors: Depreciation is non-cash, so a rental often shows a tax loss while cash-flowing — sheltering income. Rental losses are passive: they offset passive income freely, and up to $25,000/yr can offset ordinary (W-2) income if you actively participate and your MAGI is under $100k (phasing out to $0 by $150k); unused losses carry forward. On sale, claimed depreciation is recaptured at up to 25%, and gains may owe capital-gains tax (a 1031 exchange can defer both). Figures are a year-1 estimate at your 24.0% rate — not tax advice; consult a CPA.
Schools (NCES district)
- District
- Big Spring ISD
- NCES district ID
- 4810200
- Math proficiency
- 29% ▼ -1.00%
- Reading proficiency
- 30% ▲ 4.00%
- Median HH income
- $42,916
- Composite
- 25.11/100
- National rank
- #7529
- State rank
- #641 of 826 in TX
Livability — Big Spring
- Score
- 62/100
- State rank
- #948
- US rank
- #16886
Category grades
Schools grade is shown separately in the Schools card above.
Census & demographics
- Census place
- Big Spring, TX
- County
- Howard County · 29,936 people
- City population
- 29,936
- Metro
- Big Spring, TX
- Population (ZIP)
- 29,936
- Household income
- $68,785
- Rent vs Own
- Severe rent burden
- 638.0
Population outlook (Howard County) Hauer SSP2
- Today (2025)
- 43,396 people
- By 2030
- 46,792 · +7.8%
- By 2040
- 54,096 · +24.7%
- By 2050
- 61,707 · +42.2%
- By 2075
- 79,809 · +83.9%
- By 2100
- 87,385 · +101.4%
Race, ethnicity, and origin ACS 2023
- Neighborhood character
- Diverse neighborhood (Simpson 0.59)
- Race & ethnicity
- Hispanic / Latino 45% White 45% Two or more races 17% Black 5% Asian 1%
- Hispanic origin (detail)
- Mexican 37%
- Common ancestry
- Slovak 1% Italian 1% Lithuanian 1%
- Foreign-born
- 10% · Canada
- Languages at home
- 71% English-only · Spanish 28%
Political lean MEDSL · Howard
- 2024 margin
- Solid R (+62.8) · D 18.2% · R 81.1%
- 2008→2024 swing
- -16.6pp toward R · 2008: -46.3pp · 2024: -62.8pp
- All cycles
- 2024: R+62.8 2020: R+58.4 2016: R+56.0 2012: R+58.2 2008: R+46.3
Not yet ingested
- Civics
- —
Market trends
- HPI YoY
- ▼ -207.13%
- Current HPI
- 140.8159
- Rent YoY
- —
- Metro
- Big Spring, TX
- State GDP YoY
- ▲ 3.95%
- F500 in state
- 110
Industry mix (Fortune 500 HQ in TX)
| Industry | F500 HQs | Revenue |
|---|---|---|
| Energy | 16 | $1,198B |
|
||
| Technology | 5 | $198B |
|
||
| Engineering / Construction | 4 | $72B |
|
||
| Energy Services | 3 | $60B |
|
||
| Utilities | 3 | $41B |
|
||
| Healthcare | 2 | $330B |
|
||
Price history
-7.9% since first listed2 events — show timeline
- 2026-05-05 Price Changed $175,000 PBBOR
- 2026-04-20 Listed $190,000 PBBOR
Property tax history
+19.1%/yrLatest (2025): $2,878 · +235.4% YoY. Source: county tax records.
Cash-flow waterfall
monthlySold comps — $/sqft
last 12 mo · ≤1 miLoading sold comps…