4957 Wind Spg NE #22 · Salem, OR
Flood risk 1/10 · Minimal
- FEMA flood zone
- X (unshaded)
- Chance of flooding over 30 yrs
- 0.0%
- Est. flood insurance / yr
- $507 – $1,088
Fire risk 2/10 · Minimal
- Est. fire insurance / yr
- $498 – $926
Heat risk 4/10 · Minor
- Hot days now (above 92°F)
- 7 days/yr
- Hot days in 30 yrs
- 14 days/yr
Wind risk 1/10 · Minimal
- Chance of severe wind over 30 yrs
- —
Air-quality risk 9/10 · Severe
- Unhealthy air days now
- 12 days/yr
- Unhealthy air days in 30 yrs
- 13 days/yr
Risk factors via First Street. Map © Google.
Why this score? — see what drove the C+ grade
The composite is a weighted blend of 9 inputs, each scored 0–100. Each bar is that input's sub-score; the figure is the points it added to the 100-point composite (weight × sub-score).
- Cash flow +30.0/30.0
- DSCR +10.0/10.0
- 1% rule +9.8/10.0
- Livability +4.0/5.0
- Schools +3.7/10.0
- Condition / age +2.5/5.0
- Rent growth +2.3/5.0
- ARV discount +0.0/15.0
- Appreciation +0.0/10.0
$134,500
🖨 Deal sheet (PDF) 📄 Offer letter ✓ Due diligence
Listing remarks MLS
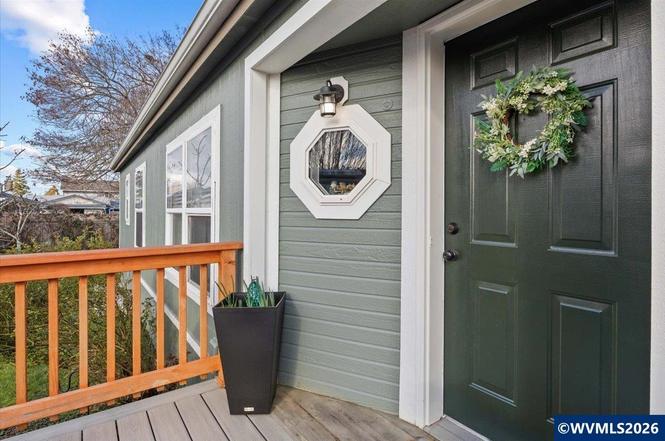
DONT MISS this all age park country style home waiting for you! Updated flooring throughout, newly painted cabinets, and wood accent walls are just a few of the updates! House has a large private backyard filled with many fruit trees including Asian pear, yellow plum, apple, cherry, grapevines, and raised garden beds that make you feel like you're in the country. Open living area to the kitchen and separate primary.
Key facts
- Grapevines
- Private backyard
- Raised garden beds
Tags
Property features AI
Finance
- Other: No home warranty; No assessments/liens reported; Accepted offer with contingencies (status noted in remarks)
- HOA & community: Park name: Windstone Village; Not an adult park; Park rent includes: see remarks
Exterior
- Parking: Carport; 2-car garage spaces
- Utilities: City water; City sewer; Electric water heater
- Home design: Double-wide mobile home; Exterior painted green; Front door description noted
- Construction: Built in 1997; Wood siding (lap style); Composition roof; Pier foundation; Fleetwood Woodland Par model
- Exterior features: Fenced yard; Deck; Landscaped yard; Raised garden beds; Fruit trees (Asian pear, apple, plum, cherry), grapevines and blackberries; Shed (outbuilding)
Interior
- Kitchen: Dishwasher; Electric range; Newer stainless steel appliances; Open shelving; Skylight
- Bedrooms: Breakfast room/nook (bonus room); Dining area (combination)
- Flooring: Vinyl; Laminate
- Bathrooms: Included (number not shown)
- Heating & cooling: Electric heating; Forced air; Zonal heating; Window AC unit; Other (refer to remarks)
- Interior features: Electric fireplace in the living room; High-speed internet available; Disposal
- Laundry & utility: Washer/dryer excluded from sale
Neighborhood map
What this means for you Summary
Snapshot
- This is a 3-bed/2.0-bath manufactured listed at $134k.
Deal economics
- At list price, monthly cash flow is $728 ($9k/yr) — positive.
- The deal already cash-flows at list — no discount required.
- Meets the 1% rule at list price ($2k rent vs $134k).
- Recommended offer: $126k (6.0% below list) — sets the bar for market timing.
- Cap rate 12.8% vs local median 2.9% in Salem — top-decile yield for the area; either an underpriced asset or a hidden risk that comps aren't pricing in. Stress-test before assuming the spread holds.
Location & tenants
- Location reads 79/100 on livability (#59 in OR, #2,084 nationally) — a middle-class / working-renter tenant base. Strengths: amenities A+, commute A+, housing A+; Watch: crime F.
- Salem-Keizer SD 24J (urban): math 34% / reading 47% proficiency, ranked #103 of 183 in OR (top 56%) — families likely to look elsewhere, expect single-tenant / working-renter base with shorter leases.
- Zoned schools: Auburn Elementary School (542 students, 71% FRL); Houck Middle School (949 students, 74% FRL); North Salem High School (2,239 students, 74% FRL) — zoned schools average 73% FRL vs 53% district-wide (20 pts higher); higher-poverty schools than district average — tighter screening recommended.
- Market conditions: Rents soft (-0.7%/yr); 280 active listings in the ZIP; 22 comparable units currently listed for rent nearby; rentals at typical pace (median 25d on market — plan ~3-4 weeks tenant-placement turnaround); 1,591 units permitted in Marion County in 2024 (716 in 5+ unit buildings).
- This rent runs 40% of the median local income ($60k/yr) — at the standard rent-burdened threshold; future hikes will face affordability resistance.
Forward outlook
- Local home prices are declining (-3.0%/yr); year-one equity from $930 of loan paydown is wiped out by about $4k of value loss. Plan a longer hold.
- Marion County population projected at +17% by 2050 — long-run rental-demand tailwind backs the buy-and-hold thesis.
- At projected returns (-3.0% appreciation + 0.0% rent growth), your $38k cash investment doubles in ~7 years — after that, you're playing with house money.
Negotiation context
- It's been on market 90 days — a 6% lower offer ($126k) is reasonable based on typical stale-listing flexibility.
- 6 sale attempts since 22y ago with the ask held roughly flat each time — persistent listings suggest the price (not the market) is what's stuck; bring a comps-based counter.
- Current owner paid $105k; 28% above their basis — modest negotiation headroom, anchor on the comps not their cost.
Questions for the listing agent
- It's been on market 90 days. Have you received any prior offers? Is the seller open to a 6% concession, seller financing, or rate buy-down credit?
- Why hasn't it sold? Are there any deal-killer items the seller is aware of (foundation, flood, title, zoning, code violations)?
- Is there a deadline driving the sale (1031 exchange, divorce, estate, relocation)? That informs how much negotiation room exists.
- Schools are D-rated, which usually means shorter tenancies and higher turnover. Who's the typical renter profile here, and what's been the actual vacancy rate?
- Crime grade is F in this area — have there been break-ins, vandalism, or insurance claims at this property in the last 3 years? What carrier currently insures it and at what premium?
- What's the average days-on-market for RENTAL listings here right now (not sales)? A rising rental-DOM trend means longer vacancies and softer asking-rent achievability than the comps imply.
- What's the recent tenant-quality profile in this submarket — average credit score on applications, eviction rate, late-payment / NSF rate, and stable-employment percentage? A property-management company in the area should have these aggregated.
- How much new for-sale + rental construction is in the pipeline within 1–3 miles? Heavy new supply typically softens prices + rents 12–24 months out; constrained supply supports both.
Investment metrics
- 1% rule
- 1.48% ✓
- Cap rate
- 12.79%
- Cash-on-cash
- 23.19%
- DSCR
- 2.03
- GRM
- 5.6
CMA / ARV
- ARV (on-the-fly)
- $94,608
- Comps found
- 12
Show comp detail 12 sales within ~0.75 mi
| Address | Dist | Beds/Ba | Sqft | Sold | Price | $/sf | Match |
|---|---|---|---|---|---|---|---|
| 857 Hoffman Rd | 0.10mi | 3/2.0 | 1,296 (0%) | 7mo | $110,000 | $85 | 90 |
| 857 Hoffman Rd NE #11 | 0.10mi | 3/2.0 | 1,296 (0%) | 7mo | $110,000 | $85 | 90 |
| 1500 NE Gabriela Ct #16 | 0.32mi | 3/2.0 | 1,350 (+4%) | 1mo | $98,000 | $73 | 78 |
| 1500 Gabriela Ct #20 | 0.32mi | 3/2.0 | 1,323 (+2%) | 5mo | $132,000 | $100 | 77 |
| 4915 Swegle Rd NE #3 | 0.54mi | 3/2.0 | 1,288 (-1%) | 4mo | $57,000 | $44 | 70 |
| 4915 Swegle Rd | 0.54mi | 3/2.0 | 1,288 (-1%) | 4mo | $57,000 | $44 | 70 |
| 4915 Swegle Rd #81 | 0.54mi | 2/2.0 (-1) | 1,248 (-4%) | 1mo | $29,900 | $24 | 63 |
| 1913 Cottontail Ct NE | 0.73mi | 3/2.0 | 1,296 (0%) | 7mo | $334,900 | $258 | 60 |
| 663 Royalty Cir NE | 0.43mi | 2/2.0 (-1) | 1,404 (+8%) | 4mo | $164,900 | $117 | 58 |
| 4915 NE Swegle Rd #76 | 0.54mi | 2/2.0 (-1) | 1,368 (+6%) | 5mo | $51,500 | $38 | 57 |
| 4915 Swegle Rd NE #15 | 0.54mi | 3/2.0 | 1,152 (-11%) | 2mo | $57,500 | $50 | 55 |
| 4915 Swegle Rd NE #30 | 0.54mi | 3/2.0 | 1,440 (+11%) | 6mo | $81,000 | $56 | 51 |
Match score weights: distance 35% · size 25% · config 20% · recency 20%. Top-matched comps best support the ARV.
Projected returns pro-forma
-3.0% appreciation · 0.0% rent growth · sell at horizon
- IRR
- 12.9%
- Equity multiple
- 1.50×
- Total profit
- $18,707
- Equity at exit
- $20,054
- IRR
- 19.5%
- Equity multiple
- 2.42×
- Total profit
- $53,342
- Equity at exit
- $11,629
Cash invested: $37,660 (down + closing). Projections, not guarantees.
Landlord ↔ Tenant lean methodology
- Overall (STATE)
- 28 Tenant-Leaning
- State Oregon
- 28 Tenant-Leaning · D+6
- County
- — inherits STATE
- City
- — inherits STATE
ZIP-level market 97301
- Rents YoY
- -0.7%
- Active inventory
- 280
- Price-to-rent
- 5.6×
Monthly cashflow live
- Estimated rent
- $1,992 high interval (Pro) →
- Mortgage (P&I)
- −$705
- Tax from tax record
- −$84 /mo · $1,009/yr
- Insurance
- −$56
- HOA
- −$0
- Vacancy / Maint / Mgmt
- −$418
- Net cashflow
- $728
Break-even live
Sensitivity live
| Price | -10% $804 | -5% $766 | +0% $728 | +5% $690 | +10% $652 |
|---|---|---|---|---|---|
| Rent | -10% $571 | -5% $649 | +0% $728 | +5% $807 | +10% $885 |
| Rate | -1.0pp $796 | -0.5pp $762 | base $728 | +0.5pp $693 | +1.0pp $658 |
UW: 25.0% down · 7.5% · 30yr · 1.5% tax · 5.0% vac · 8.0% maint · 8.0% mgmt
Financing live
Cash to close
- Down payment
- $33,625
- Closing costs
- $4,035
- Reserves months
- —
- Total cash needed
- —
Loan-product check · same deal, 3 products live
Conventional
25% down · 7.5% · 30yr
- Down + closing
- —
- Monthly P&I
- —
- Monthly cashflow
- —
- DSCR
- —
- Eligible?
- —
Personal DTI + credit; lowest rate.
DSCR
20% down · 8.5% · 30yr
- Down + closing
- —
- Monthly P&I
- —
- Monthly cashflow
- —
- DSCR
- —
- Eligible?
- —
No personal income docs; deal must DSCR.
Hard money
10% down · 12.0% · 12mo
- Down + closing
- —
- Monthly P&I
- —
- Monthly cashflow
- —
- DSCR
- —
- Eligible?
- —
Short-term bridge; refi at stabilization.
Rent comps 22 comps
| Address | Beds | Baths | Sqft | Rent | $/sqft | DOM | Units | Dist |
|---|---|---|---|---|---|---|---|---|
| 434 Greencrest St NE Salem, OR | 3.0 | 2.0 | 1637 | $3,900 | $2.38 | 25d | 1 | 0.62mi |
| 412 Lost Lake St NE Salem, OR | 4.0 | 3.0 | 1662 | $2,495 | $1.50 | 25d | 1 | 0.62mi |
| 4833 Thyme Ave NE Salem, OR | 3.0 | 2.5 | 1681 | $2,545 | $1.51 | 15d | 1 | 0.85mi |
| 102 Greencrest St NE Salem, OR | 3.0 | 1.0–2.0 | 914 | $2,205 | $2.41 | 15d | 25 | 0.91mi |
| 4485 Monroe Ave NE Salem, OR | 4.0 | 2.0 | 1200 | $2,195 | $1.83 | 45d | 1 | 0.91mi |
| 1973 45th Ave NE Salem, OR | 2.0 | 1.0–2.0 | 1043 | $1,360 | $1.30 | 15d | 2 | 0.94mi |
| 4768 El Cedro Loop NE Salem, OR | 3.0 | 2.0 | 1344 | $1,895 | $1.41 | 45d | 1 | 1.08mi |
| 4098 Market St NE Unit MT21 Salem, OR | 2.0 | 1.0 | 900 | $1,275 | $1.42 | 25d | 1 | 1.08mi |
| 4200 Sunnyview Rd NE Salem, OR | 2.0 | 1.0–2.0 | 880 | $1,445 | $1.64 | 25d | 1 | 1.10mi |
| 143 Connecticut Ave SE Unit 145 Salem, OR | 3.0 | 1.0 | 1207 | $1,595 | $1.32 | 15d | 1 | 1.16mi |
| 435 Fountain Valley Way NE Salem, OR | 1.0–2.0 | 1.0–2.0 | 939 | $1,559 | $1.66 | 23d | 5 | 1.17mi |
| 4154 Sunnyview Rd NE Salem, OR | 1.0–2.0 | 1.0 | 806 | $1,375 | $1.71 | 15d | 6 | 1.19mi |
| 4836 Tanglewood Ct SE Salem, OR | 3.0 | 2.0 | 1316 | $2,150 | $1.63 | 25d | 1 | 1.24mi |
| 124 Stafford Ln NE Unit 124-203 Salem, OR | 3.0 | 2.0 | 1052 | $1,595 | $1.52 | 45d | 1 | 1.25mi |
| 4433 Mahrt Ave SE Unit 4437-206 Salem, OR | 2.0 | 2.0 | 932 | $1,525 | $1.64 | 45d | 1 | 1.31mi |
| 4433 Mahrt Ave SE Unit 4435-201 Salem, OR | 2.0 | 2.0 | 888 | $1,525 | $1.72 | 25d | 1 | 1.31mi |
| 3695 D St NE Salem, OR | 1.0–2.0 | 1.0–2.0 | 1037 | $1,650 | $1.59 | 45d | 3 | 1.35mi |
| 4359 Rodeo Dr NE Salem, OR | 3.0 | 2.0 | 1170 | $2,245 | $1.92 | 23d | 1 | 1.35mi |
| 430 Brittany Way NE Unit 369-421 Salem, OR | 2.0 | 2.0 | 920 | $1,400 | $1.52 | 45d | 1 | 1.37mi |
| 4889 Saunter Loop NE Salem, OR | 3.0 | 1.5 | 1186 | $1,925 | $1.62 | 45d | 1 | 1.38mi |
| 3910-3930 Sunnyview Rd NE Salem, OR | 3.0 | 2.5 | 1300 | $1,845 | $1.42 | 15d | 6 | 1.38mi |
| 295 Colt Ln NE Salem, OR | 3.0 | 2.0 | 1052 | $1,575 | $1.50 | 15d | 1 | 1.49mi |
Listing history 26 events
-
2026-06-10status $134,500 Pending 90 DOM
-
2026-06-09days on market $134,500 Active under Contract 90 DOM
-
2026-06-08days on market $134,500 Active under Contract 89 DOM
-
2026-06-07days on market $134,500 Active under Contract 88 DOM
-
2026-06-03days on market $134,500 Active under Contract 84 DOM
-
2026-06-02days on market $134,500 Active under Contract 83 DOM
-
2026-06-01days on market $134,500 Active under Contract 82 DOM
-
2026-05-31days on market $134,500 Active under Contract 81 DOM
-
2026-05-30days on market $134,500 Active under Contract 80 DOM
-
2026-04-21historical Active under Contract
-
2026-03-11$134,500 Active
-
2023-11-22soldstatus $105,000 Sold 419-char remark
Show marketing remark (419 chars)
DONT MISS this all age park country style home waiting for you! Updated flooring throughout, newly painted cabinets, and wood accent walls are just a few of the updates! House has a large private backyard filled with many fruit trees including Asian pear, yellow plum, apple, cherry, grapevines, and raised garden beds that make you feel like you're in the country. Open living area to the kitchen and separate primary.
-
2023-10-02historical Active under Contract 419-char remark
Show marketing remark (419 chars)
DONT MISS this all age park country style home waiting for you! Updated flooring throughout, newly painted cabinets, and wood accent walls are just a few of the updates! House has a large private backyard filled with many fruit trees including Asian pear, yellow plum, apple, cherry, grapevines, and raised garden beds that make you feel like you're in the country. Open living area to the kitchen and separate primary.
-
2023-09-18status Active 419-char remark
Show marketing remark (419 chars)
DONT MISS this all age park country style home waiting for you! Updated flooring throughout, newly painted cabinets, and wood accent walls are just a few of the updates! House has a large private backyard filled with many fruit trees including Asian pear, yellow plum, apple, cherry, grapevines, and raised garden beds that make you feel like you're in the country. Open living area to the kitchen and separate primary.
-
2023-09-14price $105,000 419-char remark
Show marketing remark (419 chars)
DONT MISS this all age park country style home waiting for you! Updated flooring throughout, newly painted cabinets, and wood accent walls are just a few of the updates! House has a large private backyard filled with many fruit trees including Asian pear, yellow plum, apple, cherry, grapevines, and raised garden beds that make you feel like you're in the country. Open living area to the kitchen and separate primary.
-
2023-08-18historical Active under Contract 419-char remark
Show marketing remark (419 chars)
DONT MISS this all age park country style home waiting for you! Updated flooring throughout, newly painted cabinets, and wood accent walls are just a few of the updates! House has a large private backyard filled with many fruit trees including Asian pear, yellow plum, apple, cherry, grapevines, and raised garden beds that make you feel like you're in the country. Open living area to the kitchen and separate primary.
-
2023-08-08price $119,900 419-char remark
Show marketing remark (419 chars)
DONT MISS this all age park country style home waiting for you! Updated flooring throughout, newly painted cabinets, and wood accent walls are just a few of the updates! House has a large private backyard filled with many fruit trees including Asian pear, yellow plum, apple, cherry, grapevines, and raised garden beds that make you feel like you're in the country. Open living area to the kitchen and separate primary.
-
2023-07-20$129,900 Active 419-char remark
Show marketing remark (419 chars)
DONT MISS this all age park country style home waiting for you! Updated flooring throughout, newly painted cabinets, and wood accent walls are just a few of the updates! House has a large private backyard filled with many fruit trees including Asian pear, yellow plum, apple, cherry, grapevines, and raised garden beds that make you feel like you're in the country. Open living area to the kitchen and separate primary.
-
2023-07-18historical
-
2023-06-02price $129,900
-
2023-05-19price $134,900
-
2023-04-20$144,000 Active
-
2014-09-25historical
-
2006-07-11$35,900
-
2005-07-21historical
-
2004-07-27$39,999
ⓘ Source: listings_history table (triggers on properties + properties_extension) + one-shot
backfill from property_details.listing_events for pre-trigger history.
Tax reassessment forecast OR · Resets to sale price
- Current annual tax
- $1,009 · $84/mo
- Projected year-2 tax
- $1,305 · $109/mo
- Expected delta
- +$296/yr (+$25/mo · 29.3%)
ⓘ Screening estimate from a state-policy table — verify with the county assessor before closing.
Climate risk First Street
- Flood 1/10 Low FEMA zone X (unshaded) · 0% chance over 30 yrs
- Wildfire 2/10 Low
- Heat 4/10 Moderate 7 d/yr ≥92°F today · 14 d/yr by 30 yrs out
- Wind 1/10 Low
- Air quality 9/10 Extreme 12 unhealthy d/yr today · 13 by 30 yrs out
Nearby sold comps map
Loading sold comps map…
Walkable amenities ~0.75 mi
Loading nearby amenities…
Taxation est. · year 1
- Rental income
- $23,899
- − Mortgage interest
- −$7,534
- − Property taxes
- −$1,009
- − Insurance
- −$672
- − Repairs & maintenance
- −$1,912
- − Management
- −$1,912
- − Depreciation
- −$3,913
- Taxable income
- $6,947
- Est. tax owed @ 24.0%
- −$1,667
- After-tax cash flow
- $7,068/yr
For passive investors: Depreciation is non-cash, so a rental often shows a tax loss while cash-flowing — sheltering income. Rental losses are passive: they offset passive income freely, and up to $25,000/yr can offset ordinary (W-2) income if you actively participate and your MAGI is under $100k (phasing out to $0 by $150k); unused losses carry forward. On sale, claimed depreciation is recaptured at up to 25%, and gains may owe capital-gains tax (a 1031 exchange can defer both). Figures are a year-1 estimate at your 24.0% rate — not tax advice; consult a CPA.
Schools (NCES district)
- District
- Salem-Keizer SD 24J
- NCES district ID
- 4110820
- Math proficiency
- 34% ▼ -1.00%
- Reading proficiency
- 47% ▼ -2.00%
- Median HH income
- $48,632
- Composite
- 37.16/100
- National rank
- #9017
- State rank
- #103 of 183 in OR
Livability — Salem
- Score
- 79/100
- State rank
- #59
- US rank
- #2084
Category grades
Schools grade is shown separately in the Schools card above.
Census & demographics
- Census place
- Salem, OR
- County
- Marion County · 258,219 people
- City population
- 193,601
- Metro
- Salem, OR
- Population (ZIP)
- 57,574
- Household income
- $60,422
- Rent vs Own
- Severe rent burden
- 3089.0
Population outlook (Marion County) Hauer SSP2
- Today (2025)
- 360,940 people
- By 2030
- 375,178 · +3.9%
- By 2040
- 400,914 · +11.1%
- By 2050
- 422,187 · +17.0%
- By 2075
- 460,305 · +27.5%
- By 2100
- 464,025 · +28.6%
Race, ethnicity, and origin ACS 2023
- Neighborhood character
- Diverse neighborhood (Simpson 0.58)
- Race & ethnicity
- White 55% Hispanic / Latino 35% Two or more races 19% Asian 2% Black 2% Native American 1% Pacific Islander 1%
- Hispanic origin (detail)
- Mexican 31%
- Common ancestry
- Italian 4% Portuguese 2% Lithuanian 2%
- Foreign-born
- 17% · Canada, China, Philippines
- Languages at home
- 68% English-only · Spanish 27% Other Asian/Pacific 1% Russian/Polish/Slavic 1%
Political lean MEDSL · Marion
- 2024 margin
- Toss-up / Even · D 47.5% · R 49.5% · Other 3.0%
- 2008→2024 swing
- -4.2pp toward R · 2008: 2.2pp · 2024: -2.0pp
- All cycles
- 2024: R+2.0 2020: D+1.1 2016: R+5.0 2012: R+3.5 2008: D+2.2
Not yet ingested
- Civics
- —
Market trends
- HPI YoY
- ▼ -548.17%
- Current HPI
- 335.8199
- Rent YoY
- ▼ -0.70%
- Metro
- Salem, OR
- State GDP YoY
- ▲ 2.05%
- F500 in state
- 2
Industry mix (Fortune 500 HQ in OR)
| Industry | F500 HQs | Revenue |
|---|---|---|
| Consumer Goods | 1 | $51B |
|
||
Price history
+236.3% since first listed17 events — show timeline
- 2026-04-21 Contingent — WVMLS
- 2026-03-11 Listed $134,500 WVMLS
- 2023-11-22 Sold (MLS) $105,000 WVMLS
- 2023-10-02 Contingent — WVMLS
- 2023-09-18 Relisted — WVMLS
- 2023-09-14 Price Changed $105,000 WVMLS
- 2023-08-18 Contingent — WVMLS
- 2023-08-08 Price Changed $119,900 WVMLS
- 2023-07-20 Listed $129,900 WVMLS
- 2023-07-18 Listing Removed — WVMLS
- 2023-06-02 Price Changed $129,900 WVMLS
- 2023-05-19 Price Changed $134,900 WVMLS
- 2023-04-20 Listed $144,000 WVMLS
- 2014-09-25 Listing Removed — WVMLS
- 2006-07-11 Listed $35,900 WVMLS
- 2005-07-21 Listing Removed — WVMLS
- 2004-07-27 Listed $39,999 WVMLS
Property tax history
+2.3%/yrLatest (2025): $1,009 · +7.7% YoY. Source: county tax records.
Cash-flow waterfall
monthlySold comps — $/sqft
last 12 mo · ≤1 miLoading sold comps…