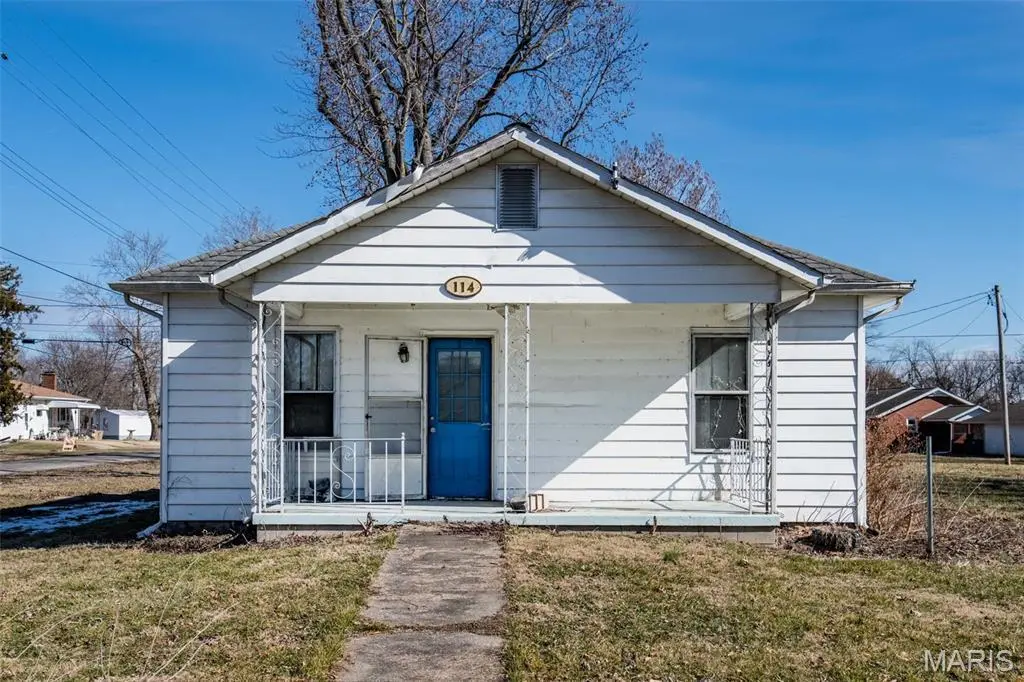
114 N West · Elkville, IL
Flood risk 1/10 · Minimal
- FEMA flood zone
- X (unshaded)
- Chance of flooding over 30 yrs
- 0.0%
- Est. flood insurance / yr
- $473 – $860
Fire risk 1/10 · Minimal
- Est. fire insurance / yr
- $804 – $1,492
Heat risk 5/10 · Moderate
- Hot days now (above 107°F)
- 7 days/yr
- Hot days in 30 yrs
- 21 days/yr
Wind risk 2/10 · Minimal
- Chance of severe wind over 30 yrs
- 3.0%
Air-quality risk 1/10 · Minimal
- Unhealthy air days now
- 0 days/yr
- Unhealthy air days in 30 yrs
- 0 days/yr
Risk factors via First Street. Map © Google.
Why this score? — see what drove the A- grade
The composite is a weighted blend of 9 inputs, each scored 0–100. Each bar is that input's sub-score; the figure is the points it added to the 100-point composite (weight × sub-score).
- Cash flow +30.0/30.0
- ARV discount +15.0/15.0
- 1% rule +10.0/10.0
- DSCR +10.0/10.0
- Appreciation +5.3/10.0
- Schools +3.2/10.0
- Livability +2.9/5.0
- Rent growth +2.5/5.0
- Condition / age +2.5/5.0
$35,000
🖨 Deal sheet 📄 Offer letter ✓ Due diligence
Listing remarks MLS
Want a DIY project? This cute 2-bed, 1-bath home is ready for someone with vision to roll up their sleeves and make it their own. Whether you're looking for your first home, an investment property, or a renovation project, this place offers a great starting point with plenty of potential. With a little creativity and elbow grease, you can transform this house into something truly special.
Key facts
- 0.73 acre lot
- 2 garage spots
- Built 1937
Neighborhood map
What this means for you Summary
Snapshot
- This is a 2-bed/1.0-bath other listed at $35k.
Deal economics
- At list price, monthly cash flow is $396 ($5k/yr) — positive.
- The deal already cash-flows at list — no discount required.
- Meets the 1% rule at list price ($892 rent vs $35k).
- Recommended offer: $32k (9.0% below list) — sets the bar for market timing.
Location & tenants
- Location reads 58/100 on livability (#1,123 in IL) — a working-class tenant base; expect higher turnover. Strengths: cost of living A+, housing A+; Watch: employment D, schools F, crime D-.
- Elverado CUSD 196 (rural): math 25% / reading 45% proficiency, ranked #418 of 919 in IL (top 46%) — families likely to look elsewhere, expect single-tenant / working-renter base with shorter leases.
- Market conditions: 12 active listings in the ZIP; 5 units permitted in Jackson County in 2024 (0 in 5+ unit buildings).
Forward outlook
- In year one you build about $426 of equity ($242 loan paydown + $184 appreciation (0.5% local appreciation)).
- At projected returns (0.5% appreciation + 3.0% rent growth), your $10k cash investment doubles in ~2 years — after that, you're playing with house money.
Negotiation context
- It's been on market 120 days — a 9% lower offer ($32k) is reasonable based on typical stale-listing flexibility.
- 2 sale attempts; this cycle's ask has dropped $8k (20%) from the opening price — seller is motivated, your offer sets the floor, not the list.
Risks & watch-outs
- Watch-outs: property tax is 3.8% of price; built in 1937 — expect roof / HVAC / electrical / plumbing capex.
- Climate carrying-cost: extreme-heat days projected 7→21/yr by 2055 (HVAC capex compounding) — expect insurance premiums to compound above CPI over the hold.
Questions for the listing agent
- It's been on market 120 days. Have you received any prior offers? Is the seller open to a 9% concession, seller financing, or rate buy-down credit?
- Built in 1937 — when were the roof, HVAC, electrical panel, plumbing, and water heater last replaced?
- Property tax is high relative to price — has the assessment been appealed recently, and will the sale trigger a re-assessment?
- Why hasn't it sold? Are there any deal-killer items the seller is aware of (foundation, flood, title, zoning, code violations)?
- Is there a deadline driving the sale (1031 exchange, divorce, estate, relocation)? That informs how much negotiation room exists.
- Schools are F-rated, which usually means shorter tenancies and higher turnover. Who's the typical renter profile here, and what's been the actual vacancy rate?
- Crime grade is D in this area — have there been break-ins, vandalism, or insurance claims at this property in the last 3 years? What carrier currently insures it and at what premium?
- What's the average days-on-market for RENTAL listings here right now (not sales)? A rising rental-DOM trend means longer vacancies and softer asking-rent achievability than the comps imply.
- What's the recent tenant-quality profile in this submarket — average credit score on applications, eviction rate, late-payment / NSF rate, and stable-employment percentage? A property-management company in the area should have these aggregated.
- How much new for-sale + rental construction is in the pipeline within 1–3 miles? Heavy new supply typically softens prices + rents 12–24 months out; constrained supply supports both.
Investment metrics
- 1% rule
- 2.55% ✓
- Cap rate
- 19.88%
- Cash-on-cash
- 48.53%
- DSCR
- 3.16
- GRM
- 3.3
CMA / ARV
- ARV (median comp)
- $53,854
- List price
- $35,000
- Delta
- -35.01%
- Verdict
- UNDERPRICED
- Comps
- 15 within 1.0 mi
Projected returns pro-forma
0.53% appreciation · 3.0% rent growth · sell at horizon
- IRR
- 50.7%
- Equity multiple
- 3.57×
- Total profit
- $25,145
- Equity at exit
- $11,092
- IRR
- 52.7%
- Equity multiple
- 7.14×
- Total profit
- $60,220
- Equity at exit
- $14,099
Cash invested: $9,800 (down + closing). Projections, not guarantees.
Landlord ↔ Tenant lean methodology
- Overall (STATE)
- 43 Moderately Tenant-Leaning
- State Illinois
- 43 Moderately Tenant-Leaning · D+7
- County
- — inherits STATE
- City
- — inherits STATE
ZIP-level market 62932
- Home prices YoY
- 0.6%
- Active inventory
- 12
- Price-to-rent
- 3.3×
Monthly cashflow live
- Estimated rent
- $892 medium interval (Pro) →
- Mortgage (P&I)
- −$184
- Tax from tax record
- −$110 /mo · $1,320/yr
- Insurance
- −$15
- HOA
- −$0
- Vacancy / Maint / Mgmt
- −$187
- Net cashflow
- $396
Break-even live
UW: 25.0% down · 7.5% · 30yr · 1.5% tax · 5.0% vac · 8.0% maint · 8.0% mgmt
Financing live
Cash to close
- Down payment
- $8,750
- Closing costs
- $1,050
- Reserves months
- —
- Total cash needed
- —
Loan-product check · same deal, 3 products live
Conventional
25% down · 7.5% · 30yr
- Down + closing
- —
- Monthly P&I
- —
- Monthly cashflow
- —
- DSCR
- —
- Eligible?
- —
Personal DTI + credit; lowest rate.
DSCR
20% down · 8.5% · 30yr
- Down + closing
- —
- Monthly P&I
- —
- Monthly cashflow
- —
- DSCR
- —
- Eligible?
- —
No personal income docs; deal must DSCR.
Hard money
10% down · 12.0% · 12mo
- Down + closing
- —
- Monthly P&I
- —
- Monthly cashflow
- —
- DSCR
- —
- Eligible?
- —
Short-term bridge; refi at stabilization.
Listing history 19 events
-
2026-06-18days on market $35,000 Active 120 DOM
-
2026-06-17days on market $35,000 Active 119 DOM
-
2026-06-16days on market $35,000 Active 118 DOM
-
2026-06-15days on market $35,000 Active 117 DOM
-
2026-06-13days on market $35,000 Active 115 DOM
-
2026-06-12pricedays on market $35,000 Active 114 DOM
-
2026-06-09days on market $43,500 Active 111 DOM
-
2026-06-08days on market $43,500 Active 110 DOM
-
2026-06-07days on market $43,500 Active 109 DOM
-
2026-06-05days on market $43,500 Active 107 DOM
-
2026-06-04days on market $43,500 Active 105 DOM
-
2026-06-02days on market $43,500 Active 104 DOM
-
2026-06-01days on market $43,500 Active 103 DOM
-
2026-05-31days on market $43,500 Active 102 DOM
-
2026-05-31days on market $43,500 Active 101 DOM
-
2026-02-19$43,500 Active 393-char remark
Show marketing remark (393 chars)
Want a DIY project? This cute 2-bed, 1-bath home is ready for someone with vision to roll up their sleeves and make it their own. Whether you're looking for your first home, an investment property, or a renovation project, this place offers a great starting point with plenty of potential. With a little creativity and elbow grease, you can transform this house into something truly special.
-
2026-02-18$43,500 Active 393-char remark
Show marketing remark (393 chars)
Want a DIY project? This cute 2-bed, 1-bath home is ready for someone with vision to roll up their sleeves and make it their own. Whether you're looking for your first home, an investment property, or a renovation project, this place offers a great starting point with plenty of potential. With a little creativity and elbow grease, you can transform this house into something truly special.
-
2021-08-06historical
-
2011-10-19historical
ⓘ Source: listings_history table (triggers on properties + properties_extension) + one-shot
backfill from property_details.listing_events for pre-trigger history.
Tax reassessment forecast IL · Partial reset (capped growth)
- Current annual tax
- $1,320 · $110/mo
- Projected year-2 tax
- $1,320 · $110/mo
- Expected delta
- $0/yr ($0/mo · 0.0%)
ⓘ Screening estimate from a state-policy table — verify with the county assessor before closing.
Climate risk First Street
- Flood 1/10 Low FEMA zone X (unshaded) · 0% chance over 30 yrs
- Wildfire 1/10 Low
- Heat 5/10 Major 7 d/yr ≥107°F today · 21 d/yr by 30 yrs out
- Wind 2/10 Low 3% chance of damaging wind over 30 yrs
- Air quality 1/10 Low 0 unhealthy d/yr today · 0 by 30 yrs out
Nearby sold comps map
Loading sold comps map…
Walkable amenities ~0.75 mi
Loading nearby amenities…
Taxation est. · year 1
- Rental income
- $10,701
- − Mortgage interest
- −$1,961
- − Property taxes
- −$1,320
- − Insurance
- −$175
- − Repairs & maintenance
- −$856
- − Management
- −$856
- − Depreciation
- −$1,018
- Taxable income
- $4,515
- Est. tax owed @ 24.0%
- −$1,084
- After-tax cash flow
- $3,672/yr
For passive investors: Depreciation is non-cash, so a rental often shows a tax loss while cash-flowing — sheltering income. Rental losses are passive: they offset passive income freely, and up to $25,000/yr can offset ordinary (W-2) income if you actively participate and your MAGI is under $100k (phasing out to $0 by $150k); unused losses carry forward. On sale, claimed depreciation is recaptured at up to 25%, and gains may owe capital-gains tax (a 1031 exchange can defer both). Figures are a year-1 estimate at your 24.0% rate — not tax advice; consult a CPA.
Schools (NCES district)
- District
- Elverado CUSD 196
- NCES district ID
- 1713860
- Math proficiency
- 25% ▲ 3.00%
- Reading proficiency
- 45% ▲ 8.00%
- Median HH income
- $42,241
- Composite
- 32.2/100
- National rank
- #10962
- State rank
- #418 of 919 in IL
Livability — Elkville
- Score
- 58/100
- State rank
- #1123
- US rank
- #21198
Category grades
Schools grade is shown separately in the Schools card above.
Census & demographics
- Census place
- Elkville, IL
- Population (ZIP)
- 1,178
Population outlook (Jackson County) Hauer SSP2
- Today (2025)
- 59,093 people
- By 2030
- 59,628 · +0.9%
- By 2040
- 59,495 · +0.7%
- By 2050
- 58,811 · -0.5%
- By 2075
- 57,683 · -2.4%
- By 2100
- 55,337 · -6.4%
Race, ethnicity, and origin ACS 2023
- Neighborhood character
- Predominantly White (85%)
- Race & ethnicity
- White 85% Hispanic / Latino 8% Two or more races 6%
- Hispanic origin (detail)
- Mexican 7%
- Common ancestry
- Italian 3% Lithuanian 2% Romanian 2%
- Foreign-born
- 3% · Canada
- Languages at home
- 92% English-only · Spanish 7% German/W. Germanic 1% Other Indo-European 1%
Political lean MEDSL · Jackson
- 2024 margin
- Toss-up / Even · D 51.0% · R 47.5% · Other 1.4%
- 2008→2024 swing
- -18.3pp toward R · 2008: 21.8pp · 2024: 3.5pp
- All cycles
- 2024: D+3.5 2020: D+1.3 2016: D+3.0 2012: D+10.3 2008: D+21.8
Not yet ingested
- Civics
- —
Market trends
- HPI YoY
- ▲ 0.53%
- Current HPI
- 96.1674
- Rent YoY
- —
- Metro
- —
- State GDP YoY
- ▲ 1.59%
- F500 in state
- 60
Industry mix (Fortune 500 HQ in IL)
| Industry | F500 HQs | Revenue |
|---|---|---|
| Insurance | 4 | $201B |
|
||
| Consumer Goods | 4 | $87B |
|
||
| Industrial Machinery | 3 | $64B |
|
||
| Healthcare | 2 | $55B |
|
||
| Retail / Pharmacy | 1 | $148B |
|
||
| Agriculture / Food | 1 | $86B |
|
||
Price history
+0.0% since first listed4 events — show timeline
- 2026-02-19 Listed $43,500 MARIS as Distributed by MLS Grid
- 2026-02-18 Listed $43,500 RMLSA as Distributed by MLS Grid
- 2021-08-06 Listing Removed — RMLSA as Distributed by MLS Grid
- 2011-10-19 Listing Removed — MRED as Distributed by MLS Grid
Property tax history
+0.7%/yrLatest (2024): $1,320 · +7.5% YoY. Source: county tax records.
Cash-flow waterfall
monthlySold comps — $/sqft
last 12 mo · ≤1 miLoading sold comps…