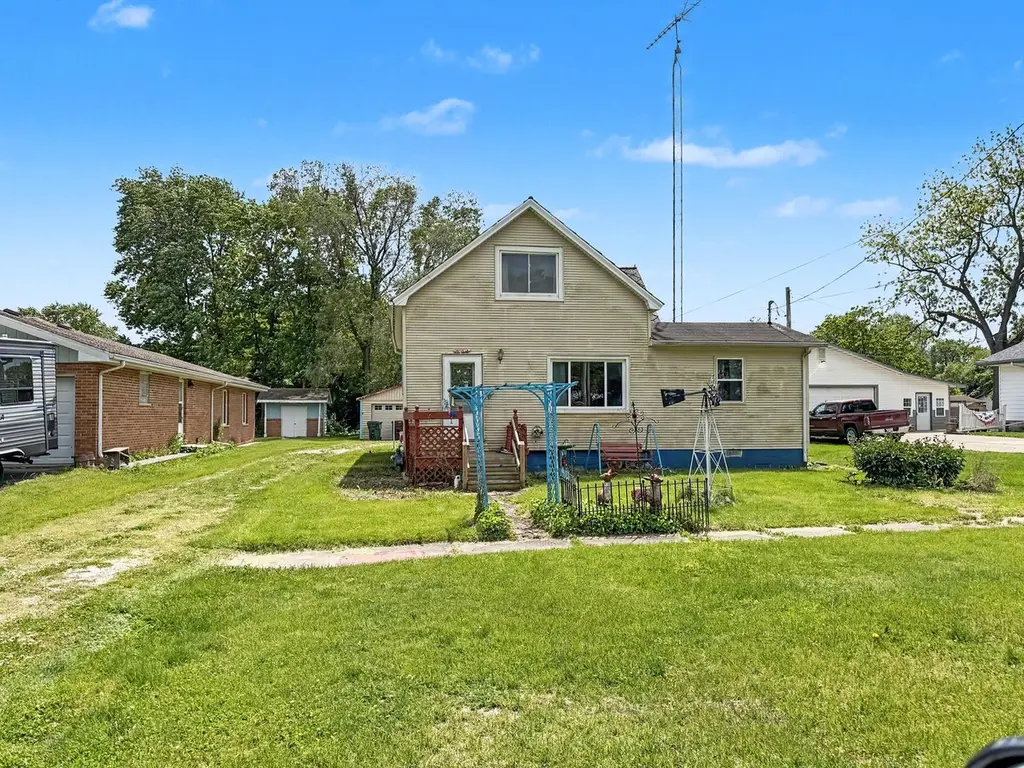
204 E Lake St · Ashkum, IL
Flood risk 1/10 · Minimal
- FEMA flood zone
- X (unshaded)
- Chance of flooding over 30 yrs
- 0.0%
- Est. flood insurance / yr
- $473 – $860
Fire risk 1/10 · Minimal
- Est. fire insurance / yr
- $804 – $1,492
Heat risk 3/10 · Minor
- Hot days now (above 103°F)
- 7 days/yr
- Hot days in 30 yrs
- 17 days/yr
Wind risk 2/10 · Minimal
- Chance of severe wind over 30 yrs
- 1.0%
Air-quality risk 2/10 · Minimal
- Unhealthy air days now
- 1 days/yr
- Unhealthy air days in 30 yrs
- 1 days/yr
Risk factors via First Street. Map © Google.
Why this score? — see what drove the B+ grade
The composite is a weighted blend of 9 inputs, each scored 0–100. Each bar is that input's sub-score; the figure is the points it added to the 100-point composite (weight × sub-score).
- Cash flow +30.0/30.0
- 1% rule +10.0/10.0
- DSCR +10.0/10.0
- Appreciation +7.7/10.0
- ARV discount +7.5/15.0
- Livability +3.3/5.0
- Rent growth +2.5/5.0
- Condition / age +2.5/5.0
- Schools +2.0/10.0
$70,000
🖨 Deal sheet (PDF) 📄 Offer letter ✓ Due diligence
Listing remarks
Lots of potential in this 3 bedroom home. The kitchen has plenty of cabinets and counter space and there is also a spacious dining room. Along with the living room, there is a den and bedroom on the first floor. Two more bedrooms are upstairs, a bonus room and a big open landing. Full basement. Two car garage and a nice yard. Quick access to I-57 for a fast commute either way. Central school district.
Key facts
- Spacious dining room
- Living room
- Bonus room
Tags
Property features AI
Finance
- Other: Property not currently leased; Possession at closing
- HOA & community: No master association required
Exterior
- Parking: Detached garage (owned) with 2 garage spaces; Additional parking for a total of 6 vehicles; Driveway; garage door opener
- Utilities: Public water; Septic tank sewer; Electric with circuit breakers
- Home design: Detached single-family home; 1.5-story layout; Fee simple ownership; Over 100 years old; Interstate access nearby
- Construction: Vinyl siding; Asphalt roof; Built before 1978
- Exterior features: Park nearby; Sidewalks; Paved street; Lot dimensions approx. 50 x 150; Less than 0.25 acre lot
Interior
- Kitchen: Range; Refrigerator
- Bedrooms: Master bedroom on main level (12 x 14); Bedroom 2 on second level (8 x 14); Bedroom 3 on second level (11 x 12)
- Flooring: Carpet in many rooms (living room, dining room, bedrooms, den, bonus room); Vinyl flooring in kitchen and laundry
- Bathrooms: 1 full bathroom
- Heating & cooling: Natural gas forced-air heating; Central air conditioning; Carbon monoxide detectors; Ceiling fan(s)
- Interior features: First-floor bedroom; First-floor full bath; Separate dining room; Full cellar basement; 8 total rooms
- Laundry & utility: Main-level laundry (in bathroom)
Neighborhood map
What this means for you Summary
Snapshot
- This is a 3-bed/1.0-bath single-family listed at $70k.
Deal economics
- At list price, monthly cash flow is $292 ($4k/yr) — positive.
- The deal already cash-flows at list — no discount required.
- Meets the 1% rule at list price ($1k rent vs $70k).
- Recommended offer: $68k (3.0% below list) — sets the bar for market timing.
Location & tenants
- Location reads 66/100 on livability (#541 in IL) — a middle-class / working-renter tenant base. Strengths: cost of living A+, housing A+, health & safety B; Watch: crime D+, schools D, amenities F.
- Central CUSD 4 (rural): math 20% / reading 23% proficiency, ranked #377 of 620 in IL (top 61%) — low school quality limits family demand, transient renter base, plan for 1-2y turnover.
- Market conditions: 9 active listings in the ZIP; 14 units permitted in Iroquois County in 2024 (0 in 5+ unit buildings).
Forward outlook
- In year one you build about $4k of equity ($484 loan paydown + $4k appreciation (5.5% local appreciation)).
- Iroquois County population projected at -20% by 2050 — secular population decline; favor cash flow + early exit over multi-decade hold.
- At projected returns (5.5% appreciation + 3.0% rent growth), your $20k cash investment doubles in ~3 years — after that, you're playing with house money.
- By year 8, paydown + projected appreciation supports a ~$33k cash-out refi (75% LTV) — recoverable capital for the next deal without selling this one.
Negotiation context
- It's been on market 33 days — a 3% lower offer ($68k) is reasonable based on typical stale-listing flexibility.
Risks & watch-outs
- Watch-outs: property tax is 3.1% of price; built in 1880 — expect roof / HVAC / electrical / plumbing capex.
Questions for the listing agent
- It's been on market 33 days. Have you received any prior offers? Is the seller open to a 3% concession, seller financing, or rate buy-down credit?
- Built in 1880 — when were the roof, HVAC, electrical panel, plumbing, and water heater last replaced?
- Property tax is high relative to price — has the assessment been appealed recently, and will the sale trigger a re-assessment?
- Is there a deadline driving the sale (1031 exchange, divorce, estate, relocation)? That informs how much negotiation room exists.
- Schools are D-rated, which usually means shorter tenancies and higher turnover. Who's the typical renter profile here, and what's been the actual vacancy rate?
- Crime grade is D in this area — have there been break-ins, vandalism, or insurance claims at this property in the last 3 years? What carrier currently insures it and at what premium?
- What's the average days-on-market for RENTAL listings here right now (not sales)? A rising rental-DOM trend means longer vacancies and softer asking-rent achievability than the comps imply.
- What's the recent tenant-quality profile in this submarket — average credit score on applications, eviction rate, late-payment / NSF rate, and stable-employment percentage? A property-management company in the area should have these aggregated.
- How much new for-sale + rental construction is in the pipeline within 1–3 miles? Heavy new supply typically softens prices + rents 12–24 months out; constrained supply supports both.
Investment metrics
- 1% rule
- 1.57% ✓
- Cap rate
- 11.30%
- Cash-on-cash
- 17.87%
- DSCR
- 1.80
- GRM
- 5.3
CMA / ARV
- ARV (on-the-fly)
- $201,133
- Comps found
- 6
Show comp detail 6 sales within ~0.75 mi
| Address | Dist | Beds/Ba | Sqft | Sold | Price | $/sf | Match |
|---|---|---|---|---|---|---|---|
| 309 S Third St | 0.10mi | 3/2.0 | 1,422 (-2%) | 10mo | $230,000 | $162 | 80 |
| 200 E Lake St | 0.04mi | 3/1.5 | 1,580 (+9%) | 8mo | $220,000 | $139 | 74 |
| 201 S Front St S | 0.13mi | 2/1.0 (-1) | 1,300 (-10%) | 13mo | $145,000 | $112 | 61 |
| 507 N Fifth St | 0.51mi | 3/2.0 | 1,400 (-3%) | 7mo | $163,000 | $116 | 61 |
| 505 E Main St | 0.31mi | 3/2.0 | 1,610 (+11%) | 8mo | $215,000 | $134 | 56 |
| 603 E Fine St | 0.44mi | 3/1.0 | 1,235 (-15%) | 19mo | $190,000 | $154 | 40 |
Match score weights: distance 35% · size 25% · config 20% · recency 20%. Top-matched comps best support the ARV.
Projected returns pro-forma
5.48% appreciation · 3.0% rent growth · sell at horizon
- IRR
- 29.4%
- Equity multiple
- 2.88×
- Total profit
- $36,751
- Equity at exit
- $41,744
- IRR
- 27.8%
- Equity multiple
- 5.81×
- Total profit
- $94,319
- Equity at exit
- $73,822
Cash invested: $19,600 (down + closing). Projections, not guarantees.
Landlord ↔ Tenant lean methodology
- Overall (STATE)
- 43 Moderately Tenant-Leaning
- State Illinois
- 43 Moderately Tenant-Leaning · D+7
- County
- — inherits STATE
- City
- — inherits STATE
ZIP-level market 60911
- Home prices YoY
- 3.4%
- Active inventory
- 9
- Price-to-rent
- 5.3×
Monthly cashflow live
- Estimated rent
- $1,099 medium interval (Pro) →
- Mortgage (P&I)
- −$367
- Tax from tax record
- −$180 /mo · $2,162/yr
- Insurance
- −$29
- HOA
- −$0
- Vacancy / Maint / Mgmt
- −$231
- Net cashflow
- $292
Break-even live
Sensitivity live
| Price | -10% $332 | -5% $312 | +0% $292 | +5% $272 | +10% $252 |
|---|---|---|---|---|---|
| Rent | -10% $205 | -5% $249 | +0% $292 | +5% $335 | +10% $379 |
| Rate | -1.0pp $327 | -0.5pp $310 | base $292 | +0.5pp $274 | +1.0pp $255 |
UW: 25.0% down · 7.5% · 30yr · 1.5% tax · 5.0% vac · 8.0% maint · 8.0% mgmt
Financing live
Cash to close
- Down payment
- $17,500
- Closing costs
- $2,100
- Reserves months
- —
- Total cash needed
- —
Loan-product check · same deal, 3 products live
Conventional
25% down · 7.5% · 30yr
- Down + closing
- —
- Monthly P&I
- —
- Monthly cashflow
- —
- DSCR
- —
- Eligible?
- —
Personal DTI + credit; lowest rate.
DSCR
20% down · 8.5% · 30yr
- Down + closing
- —
- Monthly P&I
- —
- Monthly cashflow
- —
- DSCR
- —
- Eligible?
- —
No personal income docs; deal must DSCR.
Hard money
10% down · 12.0% · 12mo
- Down + closing
- —
- Monthly P&I
- —
- Monthly cashflow
- —
- DSCR
- —
- Eligible?
- —
Short-term bridge; refi at stabilization.
Listing history 16 events
-
2026-06-19days on market $70,000 Active 33 DOM
-
2026-06-18days on market $70,000 Active 32 DOM
-
2026-06-17days on market $70,000 Active 31 DOM
-
2026-06-17days on market $70,000 Active 30 DOM
-
2026-06-15days on market $70,000 Active 29 DOM
-
2026-06-14days on market $70,000 Active 27 DOM
-
2026-06-13days on market $70,000 Active 26 DOM
-
2026-06-10days on market $70,000 Active 24 DOM
-
2026-06-09days on market $70,000 Active 23 DOM
-
2026-06-08days on market $70,000 Active 22 DOM
-
2026-06-07days on market $70,000 Active 21 DOM
-
2026-06-02days on market $70,000 Active 16 DOM
-
2026-06-01days on market $70,000 Active 15 DOM
-
2026-05-31days on market $70,000 Active 14 DOM
-
2026-05-30days on market $70,000 Active 13 DOM
-
2026-05-16$90,350 Active
ⓘ Source: listings_history table (triggers on properties + properties_extension) + one-shot
backfill from property_details.listing_events for pre-trigger history.
Tax reassessment forecast IL · Partial reset (capped growth)
- Current annual tax
- $2,162 · $180/mo
- Projected year-2 tax
- $2,162 · $180/mo
- Expected delta
- $0/yr ($0/mo · 0.0%)
ⓘ Screening estimate from a state-policy table — verify with the county assessor before closing.
Climate risk First Street
- Flood 1/10 Low FEMA zone X (unshaded) · 0% chance over 30 yrs
- Wildfire 1/10 Low
- Heat 3/10 Moderate 7 d/yr ≥103°F today · 17 d/yr by 30 yrs out
- Wind 2/10 Low 100% chance of damaging wind over 30 yrs
- Air quality 2/10 Low 1 unhealthy d/yr today · 1 by 30 yrs out
Nearby sold comps map
Loading sold comps map…
Walkable amenities ~0.75 mi
Loading nearby amenities…
Taxation est. · year 1
- Rental income
- $13,190
- − Mortgage interest
- −$3,921
- − Property taxes
- −$2,162
- − Insurance
- −$350
- − Repairs & maintenance
- −$1,055
- − Management
- −$1,055
- − Depreciation
- −$2,036
- Taxable income
- $2,610
- Est. tax owed @ 24.0%
- −$626
- After-tax cash flow
- $2,877/yr
For passive investors: Depreciation is non-cash, so a rental often shows a tax loss while cash-flowing — sheltering income. Rental losses are passive: they offset passive income freely, and up to $25,000/yr can offset ordinary (W-2) income if you actively participate and your MAGI is under $100k (phasing out to $0 by $150k); unused losses carry forward. On sale, claimed depreciation is recaptured at up to 25%, and gains may owe capital-gains tax (a 1031 exchange can defer both). Figures are a year-1 estimate at your 24.0% rate — not tax advice; consult a CPA.
Schools (NCES district)
- District
- Central CUSD 4
- NCES district ID
- 1710410
- Math proficiency
- 20% ▼ -10.00%
- Reading proficiency
- 23% ▼ -12.00%
- Median HH income
- $56,873
- Composite
- 19.81/100
- National rank
- #8700
- State rank
- #377 of 620 in IL
Livability — Ashkum
- Score
- 66/100
- State rank
- #541
- US rank
- #11217
Category grades
Schools grade is shown separately in the Schools card above.
Census & demographics
- Census place
- Ashkum, IL
- Population (ZIP)
- 1,215
Population outlook (Iroquois County) Hauer SSP2
- Today (2025)
- 26,826 people
- By 2030
- 25,771 · -3.9%
- By 2040
- 23,589 · -12.1%
- By 2050
- 21,523 · -19.8%
- By 2075
- 17,998 · -32.9%
- By 2100
- 14,979 · -44.2%
Race, ethnicity, and origin ACS 2023
- Neighborhood character
- Predominantly White (93%)
- Race & ethnicity
- White 93% Two or more races 5% Hispanic / Latino 3% Black 1%
- Common ancestry
- Lithuanian 4% Romanian 3% English 1%
Political lean MEDSL · Iroquois
- 2024 margin
- Solid R (+57.3) · D 20.6% · R 78.0% · Other 1.4%
- 2008→2024 swing
- -27.5pp toward R · 2008: -29.8pp · 2024: -57.3pp
- All cycles
- 2024: R+57.3 2020: R+56.7 2016: R+56.0 2012: R+44.7 2008: R+29.8
Not yet ingested
- Civics
- —
Market trends
- HPI YoY
- ▲ 5.48%
- Current HPI
- 165.6062
- Rent YoY
- —
- Metro
- —
- State GDP YoY
- ▲ 1.59%
- F500 in state
- 60
Industry mix (Fortune 500 HQ in IL)
| Industry | F500 HQs | Revenue |
|---|---|---|
| Insurance | 4 | $201B |
|
||
| Consumer Goods | 4 | $87B |
|
||
| Industrial Machinery | 3 | $64B |
|
||
| Healthcare | 2 | $55B |
|
||
| Retail / Pharmacy | 1 | $148B |
|
||
| Agriculture / Food | 1 | $86B |
|
||
Price history
1 event — show timeline
- 2026-05-16 Listed $90,350 MRED as Distributed by MLS Grid
Property tax history
+4.7%/yrLatest (2024): $2,162 · +14.6% YoY. Source: county tax records.
Cash-flow waterfall
monthlySold comps — $/sqft
last 12 mo · ≤1 miLoading sold comps…