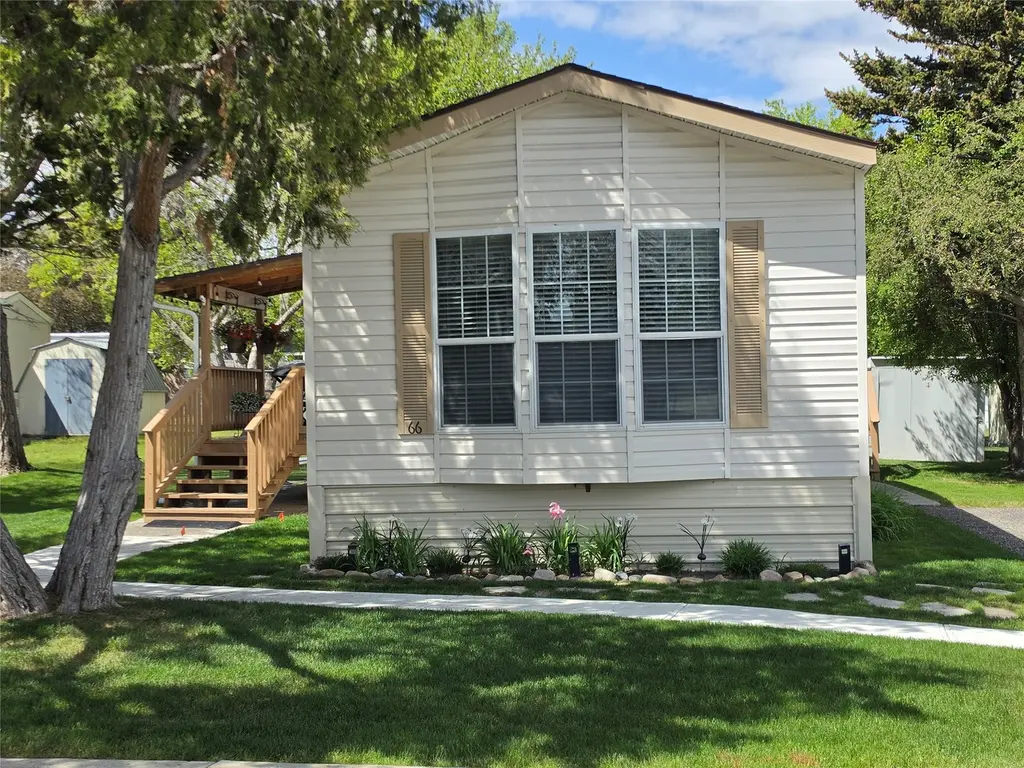
3000 Villard Ave #66 · Helena, MT
Flood risk 1/10 · Minimal
- FEMA flood zone
- X (unshaded)
- Chance of flooding over 30 yrs
- 0.0%
- Est. flood insurance / yr
- $507 – $1,088
Fire risk 6/10 · Moderate
- Est. fire insurance / yr
- $918 – $1,706
Heat risk 2/10 · Minimal
- Hot days now (above 91°F)
- 7 days/yr
- Hot days in 30 yrs
- 16 days/yr
Wind risk 1/10 · Minimal
- Chance of severe wind over 30 yrs
- —
Air-quality risk 7/10 · Major
- Unhealthy air days now
- 9 days/yr
- Unhealthy air days in 30 yrs
- 20 days/yr
Risk factors via First Street. Map © Google.
Why this score? — see what drove the B grade
The composite is a weighted blend of 9 inputs, each scored 0–100. Each bar is that input's sub-score; the figure is the points it added to the 100-point composite (weight × sub-score).
- Cash flow +29.8/30.0
- DSCR +10.0/10.0
- 1% rule +8.4/10.0
- ARV discount +7.5/15.0
- Livability +4.0/5.0
- Condition / age +4.0/5.0
- Schools +3.8/10.0
- Rent growth +2.9/5.0
- Appreciation +0.0/10.0
$124,900
🖨 Deal sheet 📄 Offer letter ✓ Due diligence
Key facts
- Updated appliances
- Soaking tub
- Updated painting
Tags
Property features AI
Finance
- Financial info: Annual taxes noted
- HOA & community: Land is leased (land lease)
Exterior
- Utilities: Public water; Public sewer
- Home design: Manufactured home (Single wide); Residential property
- Construction: Other foundation
Interior
- Kitchen: Dishwasher; Microwave; Range; Refrigerator
- Bathrooms: 2 full bathrooms
- Interior features: Dryer; Dishwasher; Microwave; Range; Refrigerator; Washer
- Laundry & utility: Washer; Dryer
Neighborhood map
What this means for you Summary
Snapshot
- This is a 2-bed/2.0-bath single-family listed at $125k. Condition is rated good.
Deal economics
- At list price, monthly cash flow is $459 ($6k/yr) — positive.
- The deal already cash-flows at list — no discount required.
- Meets the 1% rule at list price ($2k rent vs $125k).
- Cap rate 10.7% vs local median 2.6% in Helena — top-decile yield for the area; either an underpriced asset or a hidden risk that comps aren't pricing in. Stress-test before assuming the spread holds.
Location & tenants
- Location reads 81/100 on livability (#6 in MT, #1,389 nationally) — a professional / high-income tenant draw. Strengths: amenities A+, commute A+, housing A+; Watch: crime F.
- Helena H S (town): math 34% / reading 54% proficiency, ranked #42 of 116 in MT (top 36%) — families likely to look elsewhere, expect single-tenant / working-renter base with shorter leases.
- Market conditions: Rents rising (+1.5%/yr); 166 active listings in the ZIP; 456 units permitted in Lewis and Clark County in 2024 (207 in 5+ unit buildings).
Forward outlook
- Local home prices are declining (-3.0%/yr); year-one equity from $864 of loan paydown is wiped out by about $4k of value loss. Plan a longer hold.
- Lewis and Clark County population projected at +14% by 2050 — modest demand growth; plan on rents tracking national, not racing it.
- At projected returns (-3.0% appreciation + 1.5% rent growth), your $35k cash investment doubles in ~9 years — after that, you're playing with house money.
Negotiation context
- Only 10 days on market — expect competitive offers; lowballing is unlikely to land.
Risks & watch-outs
- Climate carrying-cost: major wildfire risk — expect insurance premiums to compound above CPI over the hold.
Questions for the listing agent
- Is there a deadline driving the sale (1031 exchange, divorce, estate, relocation)? That informs how much negotiation room exists.
- Schools are B-rated — typically a magnet for longer-tenancy family renters. What's the average tenant stay here, and is there a school-zone premium baked into asking?
- Crime grade is F in this area — have there been break-ins, vandalism, or insurance claims at this property in the last 3 years? What carrier currently insures it and at what premium?
- What's the average days-on-market for RENTAL listings here right now (not sales)? A rising rental-DOM trend means longer vacancies and softer asking-rent achievability than the comps imply.
- What's the recent tenant-quality profile in this submarket — average credit score on applications, eviction rate, late-payment / NSF rate, and stable-employment percentage? A property-management company in the area should have these aggregated.
- How much new for-sale + rental construction is in the pipeline within 1–3 miles? Heavy new supply typically softens prices + rents 12–24 months out; constrained supply supports both.
Investment metrics
- 1% rule
- 1.34% ✓
- Cap rate
- 10.71%
- Cash-on-cash
- 15.76%
- DSCR
- 1.70
- GRM
- 6.2
CMA / ARV
- ARV (on-the-fly)
- $311,296
- Comps found
- 6
Show comp detail 6 sales within ~0.75 mi
| Address | Dist | Beds/Ba | Sqft | Sold | Price | $/sf | Match |
|---|---|---|---|---|---|---|---|
| 3000 Villard Ave #159 | 0.00mi | 3/2.0 (+1) | 1,216 (0%) | 22mo | $119,500 | $98 | 76 |
| 816 Birch St | 0.24mi | 3/2.0 (+1) | 1,148 (-6%) | 9mo | $399,000 | $348 | 67 |
| 813 Cherry Ave | 0.33mi | 2/2.0 | 1,365 (+12%) | 0mo | $349,900 | $256 | 64 |
| 3000 Villard Ave #148 | 0.00mi | 3/2.0 (+1) | 1,064 (-12%) | 22mo | $85,000 | $80 | 56 |
| 2424 Teakwood Ln | 0.67mi | 3/2.0 (+1) | 1,092 (-10%) | 8mo | $439,900 | $403 | 40 |
| 703 Cedar St | 0.47mi | 2/1.0 | 1,072 (-12%) | 20mo | $239,900 | $224 | 38 |
Match score weights: distance 35% · size 25% · config 20% · recency 20%. Top-matched comps best support the ARV.
Projected returns pro-forma
-3.0% appreciation · 1.54% rent growth · sell at horizon
- IRR
- 5.0%
- Equity multiple
- 1.19×
- Total profit
- $6,611
- Equity at exit
- $18,623
- IRR
- 13.0%
- Equity multiple
- 1.97×
- Total profit
- $33,864
- Equity at exit
- $10,799
Cash invested: $34,972 (down + closing). Projections, not guarantees.
Landlord ↔ Tenant lean methodology
- Overall (STATE)
- 82 Strongly Landlord-Friendly
- State Montana
- 82 Strongly Landlord-Friendly · R+11
- County
- — inherits STATE
- City
- — inherits STATE
ZIP-level market 59601
- Rents YoY
- 1.5%
- Active inventory
- 166
- Price-to-rent
- 6.2×
Monthly cashflow live
- Estimated rent
- $1,674 medium interval (Pro) →
- Mortgage (P&I)
- −$655
- Tax est. 1.5%
- −$156 /mo · $1,874/yr
- Insurance
- −$52
- HOA
- −$0
- Vacancy / Maint / Mgmt
- −$352
- Net cashflow
- $459
Break-even live
UW: 25.0% down · 7.5% · 30yr · 1.5% tax · 5.0% vac · 8.0% maint · 8.0% mgmt
Financing live
Cash to close
- Down payment
- $31,225
- Closing costs
- $3,747
- Reserves months
- —
- Total cash needed
- —
Loan-product check · same deal, 3 products live
Conventional
25% down · 7.5% · 30yr
- Down + closing
- —
- Monthly P&I
- —
- Monthly cashflow
- —
- DSCR
- —
- Eligible?
- —
Personal DTI + credit; lowest rate.
DSCR
20% down · 8.5% · 30yr
- Down + closing
- —
- Monthly P&I
- —
- Monthly cashflow
- —
- DSCR
- —
- Eligible?
- —
No personal income docs; deal must DSCR.
Hard money
10% down · 12.0% · 12mo
- Down + closing
- —
- Monthly P&I
- —
- Monthly cashflow
- —
- DSCR
- —
- Eligible?
- —
Short-term bridge; refi at stabilization.
Listing history 8 events
-
2026-06-07statusdays on market $124,900 Pending 10 DOM
-
2026-06-05days on market $124,900 Active 9 DOM
-
2026-06-03days on market $124,900 Active 8 DOM
-
2026-06-02days on market $124,900 Active 7 DOM
-
2026-06-01days on market $124,900 Active 6 DOM
-
2026-05-31days on market $124,900 Active 5 DOM
-
2026-05-30days on market $124,900 Active 4 DOM
-
2026-05-26$124,900 Active
ⓘ Source: listings_history table (triggers on properties + properties_extension) + one-shot
backfill from property_details.listing_events for pre-trigger history.
Climate risk First Street
- Flood 1/10 Low FEMA zone X (unshaded) · 0% chance over 30 yrs
- Wildfire 6/10 Major
- Heat 2/10 Low 7 d/yr ≥91°F today · 16 d/yr by 30 yrs out
- Wind 1/10 Low
- Air quality 7/10 Severe 9 unhealthy d/yr today · 20 by 30 yrs out
Nearby sold comps map
Loading sold comps map…
Walkable amenities ~0.75 mi
Loading nearby amenities…
Taxation est. · year 1
- Rental income
- $20,087
- − Mortgage interest
- −$6,996
- − Property taxes
- −$1,874
- − Insurance
- −$624
- − Repairs & maintenance
- −$1,607
- − Management
- −$1,607
- − Depreciation
- −$3,633
- Taxable income
- $3,745
- Est. tax owed @ 24.0%
- −$899
- After-tax cash flow
- $4,612/yr
For passive investors: Depreciation is non-cash, so a rental often shows a tax loss while cash-flowing — sheltering income. Rental losses are passive: they offset passive income freely, and up to $25,000/yr can offset ordinary (W-2) income if you actively participate and your MAGI is under $100k (phasing out to $0 by $150k); unused losses carry forward. On sale, claimed depreciation is recaptured at up to 25%, and gains may owe capital-gains tax (a 1031 exchange can defer both). Figures are a year-1 estimate at your 24.0% rate — not tax advice; consult a CPA.
Condition & rehab AI · 13 photos
This mobile home is in good condition with minimal repairs needed. Painting the exterior siding and replacing outdoor light fixtures can significantly enhance its curb appeal and rental value.
Value-add opportunities
- Resale Paint exterior siding — Fresh paint can enhance curb appeal and property value
- Rental Replace outdoor light fixtures — Upgrading outdoor lighting can improve safety and attract tenants
Renovation cost estimate screening
Value-add ROI direction
- Resale Paint exterior siding — Fresh paint can enhance curb appeal and property value ↑
- Rental Replace outdoor light fixtures — Upgrading outdoor lighting can improve safety and attract tenants ↑
ⓘ Cost ranges are severity-bucket heuristics (US national rule-of-thumb). Get contractor quotes + a written scope before underwriting a rehab budget.
Schools (NCES district)
- District
- Helena H S
- NCES district ID
- 3013830
- Math proficiency
- 34% ▼ -6.00%
- Reading proficiency
- 54% ▼ -3.00%
- Median HH income
- $55,565
- Composite
- 38.26/100
- National rank
- #4238
- State rank
- #42 of 116 in MT
Livability — Helena
- Score
- 81/100
- State rank
- #6
- US rank
- #1389
Category grades
Schools grade is shown separately in the Schools card above.
Census & demographics
- Census place
- Helena, MT
- County
- Lewis and Clark County · 62,482 people
- City population
- 62,482
- Metro
- Helena, MT
- Population (ZIP)
- 31,728
- Household income
- $72,290
- Rent vs Own
- Severe rent burden
- 1080.0
Population outlook (Lewis and Clark County) Hauer SSP2
- Today (2025)
- 72,720 people
- By 2030
- 75,403 · +3.7%
- By 2040
- 79,496 · +9.3%
- By 2050
- 82,741 · +13.8%
- By 2075
- 90,296 · +24.2%
- By 2100
- 93,425 · +28.5%
Race, ethnicity, and origin ACS 2023
- Neighborhood character
- Predominantly White (88%)
- Race & ethnicity
- White 88% Two or more races 5% Hispanic / Latino 4% Native American 1%
- Common ancestry
- Portuguese 7% Lithuanian 4% Slovak 4%
- Foreign-born
- 1% · Canada, South Korea
- Languages at home
- 97% English-only · Spanish 1% Russian/Polish/Slavic 1%
Political lean MEDSL · Lewis and Clark
- 2024 margin
- Lean R (+5.7) · D 45.4% · R 51.1% · Other 3.5%
- 2008→2024 swing
- -12.2pp toward R · 2008: 6.5pp · 2024: -5.7pp
- All cycles
- 2024: R+5.7 2020: R+3.9 2016: R+6.9 2012: R+3.6 2008: D+6.5
Not yet ingested
- Civics
- —
Market trends
- HPI YoY
- ▼ -417.31%
- Current HPI
- 231.6233
- Rent YoY
- ▲ 1.54%
- Metro
- Helena, MT
- State GDP YoY
- ▲ 3.41%
- F500 in state
- 2
Industry mix (Fortune 500 HQ in MT)
| Industry | F500 HQs | Revenue |
|---|---|---|
| Technology / Analytics | 1 | $2B |
|
||
Price history
1 event — show timeline
- 2026-05-26 Listed $124,900 MRMLS
Cash-flow waterfall
monthlySold comps — $/sqft
last 12 mo · ≤1 miLoading sold comps…