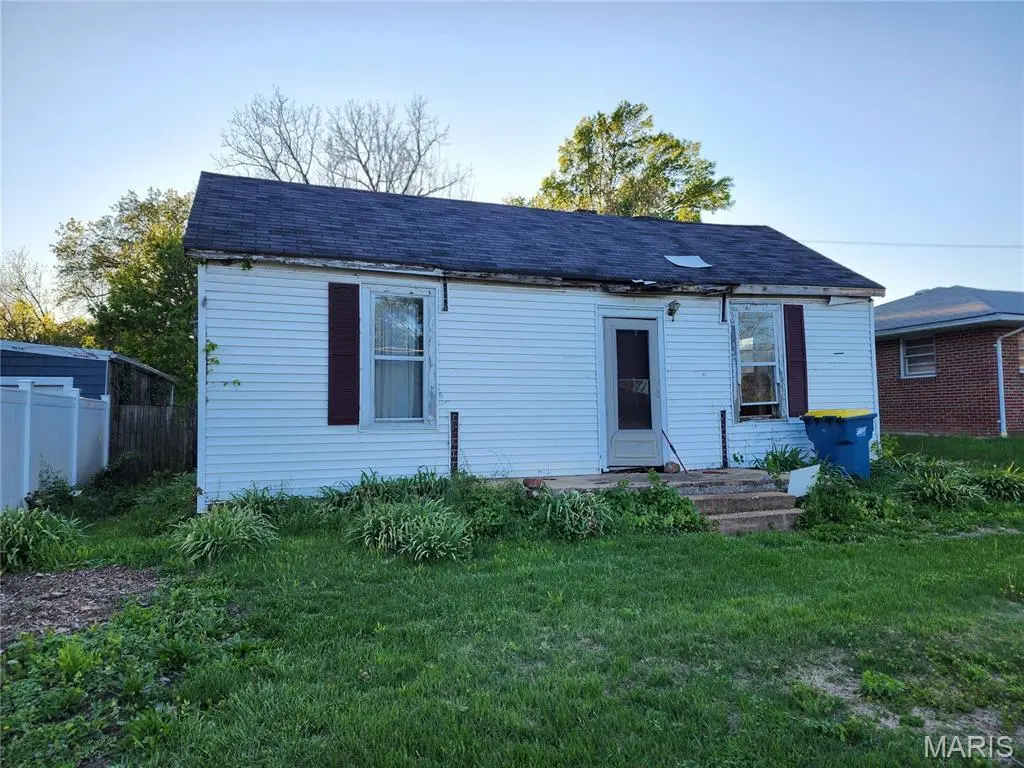
3212 Alby St · Alton, IL
Flood risk 1/10 · Minimal
- FEMA flood zone
- X
- Chance of flooding over 30 yrs
- 0.0%
- Est. flood insurance / yr
- $507 – $1,088
Fire risk 1/10 · Minimal
- Est. fire insurance / yr
- $804 – $1,492
Heat risk 4/10 · Minor
- Hot days now (above 106°F)
- 7 days/yr
- Hot days in 30 yrs
- 20 days/yr
Wind risk 2/10 · Minimal
- Chance of severe wind over 30 yrs
- 1.0%
Air-quality risk 3/10 · Minor
- Unhealthy air days now
- 2 days/yr
- Unhealthy air days in 30 yrs
- 4 days/yr
Risk factors via First Street. Map © Google.
Why this score? — see what drove the D grade
The composite is a weighted blend of 9 inputs, each scored 0–100. Each bar is that input's sub-score; the figure is the points it added to the 100-point composite (weight × sub-score).
- Cash flow +15.0/30.0
- ARV discount +7.5/15.0
- 1% rule +5.0/10.0
- DSCR +5.0/10.0
- Rent growth +4.6/5.0
- Livability +3.2/5.0
- Condition / age +2.5/5.0
- Schools +1.1/10.0
- Appreciation +0.0/10.0
$15,000
🖨 Deal sheet 📄 Offer letter ✓ Due diligence
Listing remarks MLS
Investor Opportunity – Full Renovation Project with Strong Upside. Endless potential awaits for the right buyer ready to bring vision, resources, and expertise. This property is in need of a complete renovation and is best suited for investors, rehabbers, or experienced buyers looking for their next project. The home offers a solid footprint and lot, providing a great starting point to reimagine and add value. With the right plan, this could be a rewarding investment opportunity. Important Notes: Property is being sold as-is. Seller will make no repairs and will not provide occupancy. Interior conditions are unknown. Hold harmless agreement must be signed prior to entry. This is not a cosmetic project—come prepared with a vision and a plan. A rare opportunity for those ready to take on a full rehab and unlock the potential. If you're ready to roll up your sleeves and transform a property into something special, this could be the one.
Key facts
- 7,514 sq ft lot
- Built 1891
- Listed 59 days
Neighborhood map
What this means for you Summary
Snapshot
- This is a 2-bed/1.0-bath single-family listed at $15k.
Deal economics
- At list price, monthly cash flow is $679 ($8k/yr) — positive.
- The deal already cash-flows at list — no discount required.
- Meets the 1% rule at list price ($1k rent vs $15k).
- Recommended offer: $15k (3.0% below list) — sets the bar for market timing.
- Cap rate 60.6% vs local median 6.4% in Alton — top-decile yield for the area; either an underpriced asset or a hidden risk that comps aren't pricing in. Stress-test before assuming the spread holds.
Location & tenants
- Location reads 64/100 on livability (#701 in IL) — a middle-class / working-renter tenant base. Strengths: cost of living A+, housing A; Watch: health & safety C-, schools F, crime F.
- Alton CUSD 11 (suburban): math 12% / reading 13% proficiency, ranked #544 of 620 in IL (top 88%) — low school quality limits family demand, transient renter base, plan for 1-2y turnover; 60% free/reduced lunch — lower-income household profile, screen leases tightly.
- Market conditions: Rents rising fast (+8.2%/yr); 169 active listings in the ZIP; 3 comparable units currently listed for rent nearby; rentals at typical pace (median 16d on market — plan ~3-4 weeks tenant-placement turnaround); 336 units permitted in Madison County in 2024 (0 in 5+ unit buildings).
Forward outlook
- Local home prices are declining (-3.0%/yr); year-one equity from $104 of loan paydown is wiped out by about $450 of value loss. Plan a longer hold.
- Madison County population projected at -18% by 2050 — secular population decline; favor cash flow + early exit over multi-decade hold.
- At projected returns (-3.0% appreciation + 8.0% rent growth), your $4k cash investment doubles in ~1 year — after that, you're playing with house money.
Negotiation context
- It's been on market 59 days — a 3% lower offer ($15k) is reasonable based on typical stale-listing flexibility.
- 2 sale attempts with the ask held roughly flat each time — persistent listings suggest the price (not the market) is what's stuck; bring a comps-based counter.
Risks & watch-outs
- Watch-outs: property tax is 4.5% of price; built in 1891 — expect roof / HVAC / electrical / plumbing capex.
Questions for the listing agent
- It's been on market 59 days. Have you received any prior offers? Is the seller open to a 3% concession, seller financing, or rate buy-down credit?
- Built in 1891 — when were the roof, HVAC, electrical panel, plumbing, and water heater last replaced?
- Property tax is high relative to price — has the assessment been appealed recently, and will the sale trigger a re-assessment?
- Is there a deadline driving the sale (1031 exchange, divorce, estate, relocation)? That informs how much negotiation room exists.
- Schools are F-rated, which usually means shorter tenancies and higher turnover. Who's the typical renter profile here, and what's been the actual vacancy rate?
- Crime grade is F in this area — have there been break-ins, vandalism, or insurance claims at this property in the last 3 years? What carrier currently insures it and at what premium?
- The area grade is low — what's the realistic commute time and amenity access for the typical tenant pool here? Any planned neighborhood developments (good or bad) we should know about?
- What's the average days-on-market for RENTAL listings here right now (not sales)? A rising rental-DOM trend means longer vacancies and softer asking-rent achievability than the comps imply.
- What's the recent tenant-quality profile in this submarket — average credit score on applications, eviction rate, late-payment / NSF rate, and stable-employment percentage? A property-management company in the area should have these aggregated.
- How much new for-sale + rental construction is in the pipeline within 1–3 miles? Heavy new supply typically softens prices + rents 12–24 months out; constrained supply supports both.
Investment metrics
- 1% rule
- 6.92% ✓
- Cap rate
- 60.60%
- Cash-on-cash
- 193.94%
- DSCR
- 9.63
- GRM
- 1.2
CMA / ARV
- ARV (median comp)
- $115,707
- List price
- $15,000
- Delta
- -87.04%
- Verdict
- UNDERPRICED
- Comps
- 20 within 1.0 mi
Show comp detail 12 sales within ~0.75 mi
| Address | Dist | Beds/Ba | Sqft | Sold | Price | $/sf | Match |
|---|---|---|---|---|---|---|---|
| 36 Marietta Pl | 0.06mi | 2/1.5 | 1,423 (-3%) | 12mo | $184,900 | $130 | 79 |
| 209 Brentwood Blvd | 0.19mi | 2/1.0 | 1,362 (-8%) | 4mo | $50,000 | $37 | 76 |
| 2318 Birch | 0.09mi | 3/3.0 (+1) | 1,385 (-6%) | 3mo | $110,000 | $79 | 71 |
| 2712 Gerson Ave | 0.46mi | 3/1.0 (+1) | 1,512 (+3%) | 3mo | $159,900 | $106 | 67 |
| 239 W Elm St | 0.56mi | 2/2.0 | 1,428 (-3%) | 1mo | $159,000 | $111 | 64 |
| 7 Hickerson Pl | 0.42mi | 3/2.5 (+1) | 1,454 (-1%) | 8mo | $130,000 | $89 | 61 |
| 3 E Elm St | 0.25mi | 2/1.5 | 1,672 (+14%) | 6mo | $125,000 | $75 | 58 |
| 3120 Hawthorne Blvd | 0.38mi | 3/1.5 (+1) | 1,372 (-7%) | 10mo | $140,000 | $102 | 56 |
| 203 W Elm St | 0.41mi | 3/2.5 (+1) | 1,445 (-2%) | 16mo | $160,000 | $111 | 53 |
| 401 Mildred St | 0.73mi | 3/2.0 (+1) | 1,363 (-7%) | 4mo | $145,000 | $106 | 41 |
| 2825 Gerson Ave | 0.62mi | 3/2.0 (+1) | 1,365 (-7%) | 10mo | $30,000 | $22 | 41 |
| 238 W Delmar Ave | 0.59mi | 3/2.0 (+1) | 1,692 (+15%) | 13mo | $198,900 | $118 | 28 |
Match score weights: distance 35% · size 25% · config 20% · recency 20%. Top-matched comps best support the ARV.
Projected returns pro-forma
-3.0% appreciation · 8.0% rent growth · sell at horizon
- IRR
- —
- Equity multiple
- 12.03×
- Total profit
- $46,328
- Equity at exit
- $2,237
- IRR
- —
- Equity multiple
- 29.84×
- Total profit
- $121,147
- Equity at exit
- $1,297
Cash invested: $4,200 (down + closing). Projections, not guarantees.
Landlord ↔ Tenant lean methodology
- Overall (STATE)
- 43 Moderately Tenant-Leaning
- State Illinois
- 43 Moderately Tenant-Leaning · D+7
- County
- — inherits STATE
- City
- — inherits STATE
ZIP-level market 62002
- Home prices YoY
- -33.6%
- Rents YoY
- 8.2%
- Active inventory
- 169
- Price-to-rent
- 1.2×
Monthly cashflow live
- Estimated rent
- $1,038 medium interval (Pro) →
- Mortgage (P&I)
- −$79
- Tax from tax record
- −$57 /mo · $680/yr
- Insurance
- −$6
- HOA
- −$0
- Vacancy / Maint / Mgmt
- −$218
- Net cashflow
- $679
Break-even live
UW: 25.0% down · 7.5% · 30yr · 1.5% tax · 5.0% vac · 8.0% maint · 8.0% mgmt
Financing live
Cash to close
- Down payment
- $3,750
- Closing costs
- $450
- Reserves months
- —
- Total cash needed
- —
Loan-product check · same deal, 3 products live
Conventional
25% down · 7.5% · 30yr
- Down + closing
- —
- Monthly P&I
- —
- Monthly cashflow
- —
- DSCR
- —
- Eligible?
- —
Personal DTI + credit; lowest rate.
DSCR
20% down · 8.5% · 30yr
- Down + closing
- —
- Monthly P&I
- —
- Monthly cashflow
- —
- DSCR
- —
- Eligible?
- —
No personal income docs; deal must DSCR.
Hard money
10% down · 12.0% · 12mo
- Down + closing
- —
- Monthly P&I
- —
- Monthly cashflow
- —
- DSCR
- —
- Eligible?
- —
Short-term bridge; refi at stabilization.
Rent comps 3 comps
| Address | Beds | Baths | Sqft | Rent | $/sqft | DOM | Units | Dist |
|---|---|---|---|---|---|---|---|---|
| 3108 Alby St Alton, IL | 2.0 | 1.0 | 900 | $1,000 | $1.11 | 43d | 1 | 0.03mi |
| 2016 Salu St Alton, IL | 3.0 | 1.0 | 1073 | $1,100 | $1.03 | 16d | 1 | 1.26mi |
| 1106 George St Unit 1106 Alton, IL | 3.0 | 1.5 | 1750 | $1,196 | $0.68 | 3d | 1 | 1.33mi |
Listing history 14 events
-
2026-06-18days on market $15,000 Active 59 DOM
-
2026-06-17days on market $15,000 Active 58 DOM
-
2026-06-16days on market $15,000 Active 57 DOM
-
2026-06-15days on market $15,000 Active 56 DOM
-
2026-06-13days on market $15,000 Active 54 DOM
-
2026-06-09days on market $15,000 Active 50 DOM
-
2026-06-08days on market $15,000 Active 49 DOM
-
2026-06-07days on market $15,000 Active 48 DOM
-
2026-06-03days on market $15,000 Active 44 DOM
-
2026-06-02days on market $15,000 Active 43 DOM
-
2026-06-01days on market $15,000 Active 42 DOM
-
2026-05-31days on market $15,000 Active 41 DOM
-
2026-04-20$15,000 Active 965-char remark
Show marketing remark (965 chars)
Investor Opportunity – Full Renovation Project with Strong Upside. Endless potential awaits for the right buyer ready to bring vision, resources, and expertise. This property is in need of a complete renovation and is best suited for investors, rehabbers, or experienced buyers looking for their next project. The home offers a solid footprint and lot, providing a great starting point to reimagine and add value. With the right plan, this could be a rewarding investment opportunity. Important Notes: Property is being sold as-is. Seller will make no repairs and will not provide occupancy. Interior conditions are unknown. Hold harmless agreement must be signed prior to entry. This is not a cosmetic project—come prepared with a vision and a plan. A rare opportunity for those ready to take on a full rehab and unlock the potential. If you're ready to roll up your sleeves and transform a property into something special, this could be the one.
-
2025-08-07$12,500 Active
ⓘ Source: listings_history table (triggers on properties + properties_extension) + one-shot
backfill from property_details.listing_events for pre-trigger history.
Tax reassessment forecast IL · Partial reset (capped growth)
- Current annual tax
- $680 · $57/mo
- Projected year-2 tax
- $680 · $57/mo
- Expected delta
- $0/yr ($0/mo · 0.0%)
ⓘ Screening estimate from a state-policy table — verify with the county assessor before closing.
Climate risk First Street
- Flood 1/10 Low FEMA zone X · 0% chance over 30 yrs
- Wildfire 1/10 Low
- Heat 4/10 Moderate 7 d/yr ≥106°F today · 20 d/yr by 30 yrs out
- Wind 2/10 Low 100% chance of damaging wind over 30 yrs
- Air quality 3/10 Moderate 2 unhealthy d/yr today · 4 by 30 yrs out
Nearby sold comps map
Loading sold comps map…
Walkable amenities ~0.75 mi
Loading nearby amenities…
Taxation est. · year 1
- Rental income
- $12,461
- − Mortgage interest
- −$840
- − Property taxes
- −$680
- − Insurance
- −$75
- − Repairs & maintenance
- −$997
- − Management
- −$997
- − Depreciation
- −$436
- Taxable income
- $8,436
- Est. tax owed @ 24.0%
- −$2,025
- After-tax cash flow
- $6,121/yr
For passive investors: Depreciation is non-cash, so a rental often shows a tax loss while cash-flowing — sheltering income. Rental losses are passive: they offset passive income freely, and up to $25,000/yr can offset ordinary (W-2) income if you actively participate and your MAGI is under $100k (phasing out to $0 by $150k); unused losses carry forward. On sale, claimed depreciation is recaptured at up to 25%, and gains may owe capital-gains tax (a 1031 exchange can defer both). Figures are a year-1 estimate at your 24.0% rate — not tax advice; consult a CPA.
Schools (NCES district)
- District
- Alton CUSD 11
- NCES district ID
- 1703600
- Math proficiency
- 12% ▼ -10.00%
- Reading proficiency
- 13% ▼ -10.00%
- Median HH income
- $46,257
- Composite
- 11.34/100
- National rank
- #9710
- State rank
- #544 of 620 in IL
Livability — Alton
- Score
- 64/100
- State rank
- #701
- US rank
- #14289
Category grades
Schools grade is shown separately in the Schools card above.
Census & demographics
- Census place
- Alton, IL
- County
- Madison County · 189,064 people
- City population
- 29,543
- Metro
- St. Louis, MO-IL
- Population (ZIP)
- 29,543
- Household income
- $61,414
- Rent vs Own
- Severe rent burden
- 960.0
Population outlook (Madison County) Hauer SSP2
- Today (2025)
- 258,371 people
- By 2030
- 251,523 · -2.7%
- By 2040
- 233,640 · -9.6%
- By 2050
- 213,042 · -17.5%
- By 2075
- 165,255 · -36.0%
- By 2100
- 123,953 · -52.0%
Race, ethnicity, and origin ACS 2023
- Neighborhood character
- Predominantly White (71%)
- Race & ethnicity
- White 71% Black 20% Two or more races 6% Hispanic / Latino 2% Asian 1%
- Common ancestry
- Romanian 2% Lithuanian 2% Slovak 1%
- Foreign-born
- 2% · Canada
- Languages at home
- 97% English-only · Spanish 1% Other Indo-European 1%
Political lean MEDSL · Madison
- 2024 margin
- R (+13.3) · D 42.5% · R 55.8% · Other 1.8%
- 2008→2024 swing
- -22.5pp toward R · 2008: 9.2pp · 2024: -13.3pp
- All cycles
- 2024: R+13.3 2020: R+13.2 2016: R+15.6 2012: R+1.4 2008: D+9.2
Not yet ingested
- Civics
- —
Market trends
- HPI YoY
- ▼ -98.43%
- Current HPI
- 194.7313
- Rent YoY
- ▲ 8.24%
- Metro
- St. Louis, MO-IL
- State GDP YoY
- ▲ 1.59%
- F500 in state
- 60
Industry mix (Fortune 500 HQ in IL)
| Industry | F500 HQs | Revenue |
|---|---|---|
| Insurance | 4 | $201B |
|
||
| Consumer Goods | 4 | $87B |
|
||
| Industrial Machinery | 3 | $64B |
|
||
| Healthcare | 2 | $55B |
|
||
| Retail / Pharmacy | 1 | $148B |
|
||
| Agriculture / Food | 1 | $86B |
|
||
Price history
+20.0% since first listed2 events — show timeline
- 2026-04-20 Listed $15,000 MARIS as Distributed by MLS Grid
- 2025-08-07 Listed $12,500 MARIS as Distributed by MLS Grid
Property tax history
+9.2%/yrLatest (2023): $680 · +15.9% YoY. Source: county tax records.
Cash-flow waterfall
monthlySold comps — $/sqft
last 12 mo · ≤1 miLoading sold comps…