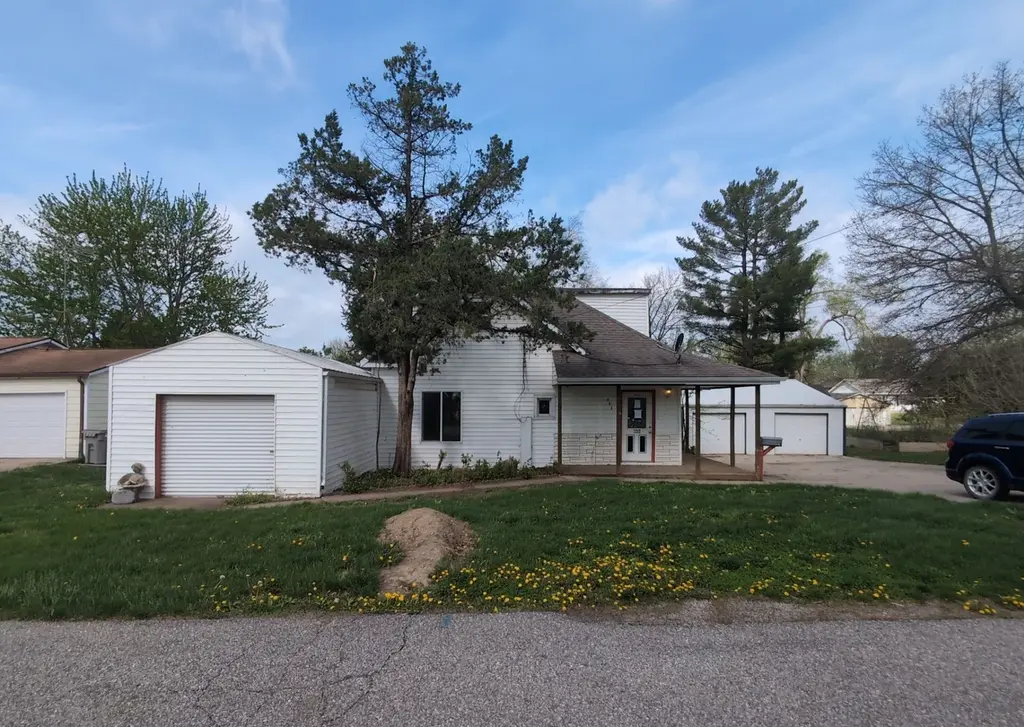
421 S 8th St · Albia, IA
Flood risk 1/10 · Minimal
- FEMA flood zone
- X (unshaded)
- Chance of flooding over 30 yrs
- 0.0%
- Est. flood insurance / yr
- $473 – $860
Fire risk 2/10 · Minimal
- Est. fire insurance / yr
- $902 – $1,676
Heat risk 3/10 · Minor
- Hot days now (above 104°F)
- 7 days/yr
- Hot days in 30 yrs
- 15 days/yr
Wind risk 2/10 · Minimal
- Chance of severe wind over 30 yrs
- —
Air-quality risk 2/10 · Minimal
- Unhealthy air days now
- 1 days/yr
- Unhealthy air days in 30 yrs
- 1 days/yr
Risk factors via First Street. Map © Google.
Why this score? — see what drove the A- grade
The composite is a weighted blend of 9 inputs, each scored 0–100. Each bar is that input's sub-score; the figure is the points it added to the 100-point composite (weight × sub-score).
- Cash flow +30.0/30.0
- 1% rule +10.0/10.0
- DSCR +10.0/10.0
- Appreciation +10.0/10.0
- ARV discount +7.5/15.0
- Schools +6.1/10.0
- Livability +3.7/5.0
- Rent growth +2.5/5.0
- Condition / age +2.5/5.0
$67,500
🖨 Deal sheet (PDF) 📄 Offer letter ✓ Due diligence
Listing remarks MLS
Spacious 4-bedroom, 1-bath home featuring a large detached garage and plenty of room to spread out. Enjoy generous living space inside and out, all just minutes from downtown, parks, and local amenities.
Key facts
- 0.49 acre lot
- 2 garage spots
- Built 1956
Neighborhood map
What this means for you Summary
Snapshot
- This is a 4-bed/1.0-bath other listed at $68k.
Deal economics
- At list price, monthly cash flow is $339 ($4k/yr) — positive.
- The deal already cash-flows at list — no discount required.
- Meets the 1% rule at list price ($1k rent vs $68k).
- Recommended offer: $63k (6.0% below list) — sets the bar for market timing.
Location & tenants
- Location reads 73/100 on livability (#265 in IA) — a middle-class / working-renter tenant base. Strengths: cost of living A+, housing A+, health & safety A+; Watch: crime D+, employment D+, amenities F.
- Albia Community School District (town): math 68% / reading 77% proficiency, ranked #117 of 289 in IA (top 40%) — strong family-tenant draw, lease renewals of 3-5y typical.
- Market conditions: 30 active listings in the ZIP; 13 units permitted in Monroe County in 2024 (0 in 5+ unit buildings).
Forward outlook
- In year one you build about $7k of equity ($467 loan paydown + $7k appreciation (10.0% local appreciation)).
- At projected returns (10.0% appreciation + 3.0% rent growth), your $19k cash investment doubles in ~2 years — after that, you're playing with house money.
- By year 5, paydown + projected appreciation supports a ~$34k cash-out refi (75% LTV) — recoverable capital for the next deal without selling this one.
Negotiation context
- It's been on market 65 days — a 6% lower offer ($63k) is reasonable based on typical stale-listing flexibility.
- 5 sale attempts since 17y ago; this cycle's ask has dropped $7k (10%) from the opening price — seller is motivated, your offer sets the floor, not the list.
Risks & watch-outs
- Watch-outs: property tax is 2.6% of price; built in 1956 — expect roof / HVAC / electrical / plumbing capex.
Questions for the listing agent
- It's been on market 65 days. Have you received any prior offers? Is the seller open to a 6% concession, seller financing, or rate buy-down credit?
- Built in 1956 — when were the roof, HVAC, electrical panel, plumbing, and water heater last replaced?
- Property tax is high relative to price — has the assessment been appealed recently, and will the sale trigger a re-assessment?
- Why hasn't it sold? Are there any deal-killer items the seller is aware of (foundation, flood, title, zoning, code violations)?
- Is there a deadline driving the sale (1031 exchange, divorce, estate, relocation)? That informs how much negotiation room exists.
- Schools are A-rated — typically a magnet for longer-tenancy family renters. What's the average tenant stay here, and is there a school-zone premium baked into asking?
- Crime grade is D in this area — have there been break-ins, vandalism, or insurance claims at this property in the last 3 years? What carrier currently insures it and at what premium?
- What's the average days-on-market for RENTAL listings here right now (not sales)? A rising rental-DOM trend means longer vacancies and softer asking-rent achievability than the comps imply.
- What's the recent tenant-quality profile in this submarket — average credit score on applications, eviction rate, late-payment / NSF rate, and stable-employment percentage? A property-management company in the area should have these aggregated.
- How much new for-sale + rental construction is in the pipeline within 1–3 miles? Heavy new supply typically softens prices + rents 12–24 months out; constrained supply supports both.
Investment metrics
- 1% rule
- 1.63% ✓
- Cap rate
- 12.31%
- Cash-on-cash
- 21.50%
- DSCR
- 1.96
- GRM
- 5.1
CMA / ARV
- ARV (median comp)
- $139,871
- List price
- $67,500
- Delta
- -51.74%
- Verdict
- UNDERPRICED
- Comps
- 20 within 1.0 mi
Projected returns pro-forma
10.0% appreciation · 3.0% rent growth · sell at horizon
- IRR
- 40.4%
- Equity multiple
- 4.09×
- Total profit
- $58,383
- Equity at exit
- $60,809
- IRR
- 34.8%
- Equity multiple
- 9.21×
- Total profit
- $155,080
- Equity at exit
- $131,138
Cash invested: $18,900 (down + closing). Projections, not guarantees.
Landlord ↔ Tenant lean methodology
- Overall (STATE)
- 83 Strongly Landlord-Friendly
- State Iowa
- 83 Strongly Landlord-Friendly · R+6
- County
- — inherits STATE
- City
- — inherits STATE
ZIP-level market 52531
- Home prices YoY
- 23.6%
- Active inventory
- 30
- Price-to-rent
- 5.1×
Monthly cashflow live
- Estimated rent
- $1,100 medium interval (Pro) →
- Mortgage (P&I)
- −$354
- Tax from tax record
- −$148 /mo · $1,782/yr
- Insurance
- −$28
- HOA
- −$0
- Vacancy / Maint / Mgmt
- −$231
- Net cashflow
- $339
Break-even live
Sensitivity live
| Price | -10% $377 | -5% $358 | +0% $339 | +5% $319 | +10% $300 |
|---|---|---|---|---|---|
| Rent | -10% $252 | -5% $295 | +0% $339 | +5% $382 | +10% $425 |
| Rate | -1.0pp $373 | -0.5pp $356 | base $339 | +0.5pp $321 | +1.0pp $303 |
UW: 25.0% down · 7.5% · 30yr · 1.5% tax · 5.0% vac · 8.0% maint · 8.0% mgmt
Financing live
Cash to close
- Down payment
- $16,875
- Closing costs
- $2,025
- Reserves months
- —
- Total cash needed
- —
Loan-product check · same deal, 3 products live
Conventional
25% down · 7.5% · 30yr
- Down + closing
- —
- Monthly P&I
- —
- Monthly cashflow
- —
- DSCR
- —
- Eligible?
- —
Personal DTI + credit; lowest rate.
DSCR
20% down · 8.5% · 30yr
- Down + closing
- —
- Monthly P&I
- —
- Monthly cashflow
- —
- DSCR
- —
- Eligible?
- —
No personal income docs; deal must DSCR.
Hard money
10% down · 12.0% · 12mo
- Down + closing
- —
- Monthly P&I
- —
- Monthly cashflow
- —
- DSCR
- —
- Eligible?
- —
Short-term bridge; refi at stabilization.
Listing history 30 events
-
2026-06-21days on market $67,500 Active 65 DOM
-
2026-06-21days on market $67,500 Active 64 DOM
-
2026-06-18days on market $67,500 Active 62 DOM
-
2026-06-17days on market $67,500 Active 61 DOM
-
2026-06-16days on market $67,500 Active 60 DOM
-
2026-06-15days on market $67,500 Active 59 DOM
-
2026-06-13days on market $67,500 Active 57 DOM
-
2026-06-12pricedays on market $67,500 Active 56 DOM
-
2026-06-09days on market $72,500 Active 53 DOM
-
2026-06-08days on market $72,500 Active 52 DOM
-
2026-06-07days on market $72,500 Active 51 DOM
-
2026-06-05days on market $72,500 Active 49 DOM
-
2026-06-04days on market $72,500 Active 47 DOM
-
2026-06-02days on market $72,500 Active 46 DOM
-
2026-06-01days on market $72,500 Active 45 DOM
-
2026-05-31days on market $72,500 Active 44 DOM
-
2026-05-31days on market $72,500 Active 43 DOM
-
2026-05-07price $72,500 203-char remark
Show marketing remark (203 chars)
Spacious 4-bedroom, 1-bath home featuring a large detached garage and plenty of room to spread out. Enjoy generous living space inside and out, all just minutes from downtown, parks, and local amenities.
-
2026-04-17$74,900 Active 203-char remark
Show marketing remark (203 chars)
Spacious 4-bedroom, 1-bath home featuring a large detached garage and plenty of room to spread out. Enjoy generous living space inside and out, all just minutes from downtown, parks, and local amenities.
-
2026-04-07price $74,900
-
2026-03-10price $79,900
-
2026-02-05price $82,500
-
2026-01-06$84,900 Active
-
2017-05-22soldstatus $69,875
-
2017-05-18soldstatus $70,000
-
2017-05-18soldstatus $70,000
-
2017-02-17$79,900
-
2017-02-17$79,900
-
2010-05-26soldstatus $35,000
-
2009-11-18$39,900
ⓘ Source: listings_history table (triggers on properties + properties_extension) + one-shot
backfill from property_details.listing_events for pre-trigger history.
Tax reassessment forecast IA · Partial reset (capped growth)
- Current annual tax
- $1,782 · $148/mo
- Projected year-2 tax
- $1,782 · $148/mo
- Expected delta
- $0/yr ($0/mo · 0.0%)
ⓘ Screening estimate from a state-policy table — verify with the county assessor before closing.
Climate risk First Street
- Flood 1/10 Low FEMA zone X (unshaded) · 0% chance over 30 yrs
- Wildfire 2/10 Low
- Heat 3/10 Moderate 7 d/yr ≥104°F today · 15 d/yr by 30 yrs out
- Wind 2/10 Low
- Air quality 2/10 Low 1 unhealthy d/yr today · 1 by 30 yrs out
Nearby sold comps map
Loading sold comps map…
Walkable amenities ~0.75 mi
Loading nearby amenities…
Taxation est. · year 1
- Rental income
- $13,203
- − Mortgage interest
- −$3,781
- − Property taxes
- −$1,782
- − Insurance
- −$338
- − Repairs & maintenance
- −$1,056
- − Management
- −$1,056
- − Depreciation
- −$1,964
- Taxable income
- $3,226
- Est. tax owed @ 24.0%
- −$774
- After-tax cash flow
- $3,289/yr
For passive investors: Depreciation is non-cash, so a rental often shows a tax loss while cash-flowing — sheltering income. Rental losses are passive: they offset passive income freely, and up to $25,000/yr can offset ordinary (W-2) income if you actively participate and your MAGI is under $100k (phasing out to $0 by $150k); unused losses carry forward. On sale, claimed depreciation is recaptured at up to 25%, and gains may owe capital-gains tax (a 1031 exchange can defer both). Figures are a year-1 estimate at your 24.0% rate — not tax advice; consult a CPA.
Schools (NCES district)
- District
- Albia Community School District
- NCES district ID
- 1903270
- Math proficiency
- 68% ▼ -9.00%
- Reading proficiency
- 77% ▬ 0.00%
- Median HH income
- $44,429
- Composite
- 60.88/100
- National rank
- #814
- State rank
- #117 of 289 in IA
Livability — Albia
- Score
- 73/100
- State rank
- #265
- US rank
- #5139
Category grades
Schools grade is shown separately in the Schools card above.
Census & demographics
- Census place
- Albia, IA
- City population
- 5,885
- Population (ZIP)
- 5,885
Population outlook (Monroe County) Hauer SSP2
- Today (2025)
- 7,921 people
- By 2030
- 7,918 · +-0.0%
- By 2040
- 7,873 · -0.6%
- By 2050
- 7,776 · -1.8%
- By 2075
- 7,556 · -4.6%
- By 2100
- 7,055 · -10.9%
Race, ethnicity, and origin ACS 2023
- Neighborhood character
- Predominantly White (94%)
- Race & ethnicity
- White 94% Two or more races 4% Asian 1%
- Common ancestry
- Iranian 4% Scotch-Irish 2% Italian 2%
- Foreign-born
- 2% · Vietnam
- Languages at home
- 97% English-only · German/W. Germanic 1% Spanish 1% Other Asian/Pacific 1%
Political lean MEDSL · Monroe
- 2024 margin
- Solid R (+50.7) · D 24.2% · R 74.9%
- 2008→2024 swing
- -45.5pp toward R · 2008: -5.2pp · 2024: -50.7pp
- All cycles
- 2024: R+50.7 2020: R+46.4 2016: R+41.2 2012: R+7.7 2008: R+5.2
Not yet ingested
- Civics
- —
Market trends
- HPI YoY
- ▲ 60.82%
- Current HPI
- 318.4427
- Rent YoY
- —
- Metro
- —
- State GDP YoY
- ▲ 2.48%
- F500 in state
- 4
Industry mix (Fortune 500 HQ in IA)
| Industry | F500 HQs | Revenue |
|---|---|---|
| Financial Services | 1 | $16B |
|
||
| Retail / Convenience | 1 | $15B |
|
||
Price history
+81.7% since first listed13 events — show timeline
- 2026-05-07 Price Changed $72,500 DMMLS
- 2026-04-17 Listed $74,900 DMMLS
- 2026-04-07 Price Changed $74,900 IAR
- 2026-03-10 Price Changed $79,900 IAR
- 2026-02-05 Price Changed $82,500 IAR
- 2026-01-06 Listed $84,900 IAR
- 2017-05-22 Sold (Public Records) $69,875 Public Records
- 2017-05-18 Sold (MLS) $70,000 NORTHSTARMLS as Distributed by MLS Grid
- 2017-05-18 Sold (MLS) $70,000 IAR
- 2017-02-17 Listed $79,900 NORTHSTARMLS as Distributed by MLS Grid
- 2017-02-17 Listed $79,900 IAR
- 2010-05-26 Sold (MLS) $35,000 NORTHSTARMLS as Distributed by MLS Grid
- 2009-11-18 Listed $39,900 NORTHSTARMLS as Distributed by MLS Grid
Property tax history
+2.8%/yrLatest (2025): $1,782 · +11.5% YoY. Source: county tax records.
Cash-flow waterfall
monthlySold comps — $/sqft
last 12 mo · ≤1 miLoading sold comps…