 Duplex
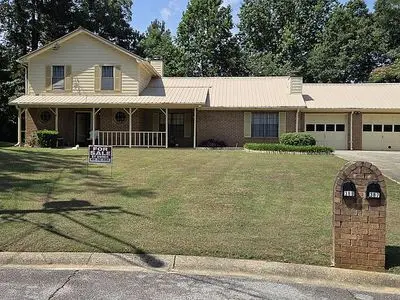
387 River Oak Dr · Riverdale, GA
Flood risk 1/10 · Minimal
- FEMA flood zone
- X (unshaded)
- Chance of flooding over 30 yrs
- 0.0%
- Est. flood insurance / yr
- $507 – $1,088
Fire risk 2/10 · Minimal
- Est. fire insurance / yr
- $963 – $1,789
Heat risk 6/10 · Moderate
- Hot days now (above 104°F)
- 7 days/yr
- Hot days in 30 yrs
- 18 days/yr
Wind risk 5/10 · Moderate
- Chance of severe wind over 30 yrs
- 26.0%
Air-quality risk 4/10 · Minor
- Unhealthy air days now
- 4 days/yr
- Unhealthy air days in 30 yrs
- 7 days/yr
Risk factors via First Street. Map © Google.
Why this score? — see what drove the C+ grade
The composite is a weighted blend of 9 inputs, each scored 0–100. Each bar is that input's sub-score; the figure is the points it added to the 100-point composite (weight × sub-score).
- Cash flow +27.2/30.0
- ARV discount +11.0/15.0
- DSCR +9.5/10.0
- 1% rule +6.3/10.0
- Livability +3.5/5.0
- Rent growth +2.8/5.0
- Condition / age +2.5/5.0
- Schools +1.3/10.0
- Appreciation +0.0/10.0
$300,000
🖨 Deal sheet 📄 Offer letter ✓ Due diligence
Multi-family units
County records classify this as Multi-Family (2-4 Unit). Listing-text estimate: 2 units. confirmed
Listing remarks
Duplex House, 2 addresses; 387 & amp; 389. Large lot on cul-de-sac 387 is a 2 Bdrm 1.5 Bath, 1000 sq. ft. Needs paint & amp; floors. Gas: range, hot water & amp; furnace. Fireplace. Central A/C. Appliances included. Single car garage. 389 is 3 Bdrm, 2.5 Bath, 1300 sq. ft. Wood floors, Gas: range, hot water & amp; furnace. Fireplace. Central A/C. Alarm system. Microwave. Appliances included, Single car garage. Metal roof on house. Large covered (RV) parking area, additional parking space. Lot has 3 sides fenced. 14x18 workshop w/ power. View by appointment only
Key facts
- Metal roof
- Large lot
- Central a/c
Tags
Neighborhood map
What this means for you Summary
Snapshot
- This is a 1×2bd/1.5ba + 1×3bd/2.5ba units multifamily listed at $300k.
Deal economics
- At list price, monthly cash flow is $858 ($10k/yr) — positive. Per door: $429/mo.
- The deal already cash-flows at list — no discount required.
- Meets the 1% rule at list price ($3k rent vs $300k).
- Recommended offer: $296k (1.5% below list) — sets the bar for market timing.
- Cap rate 9.7% vs local median 5.5% in Riverdale — top-decile yield for the area; either an underpriced asset or a hidden risk that comps aren't pricing in. Stress-test before assuming the spread holds.
Location & tenants
- Location reads 70/100 on livability (#100 in GA) — a middle-class / working-renter tenant base. Strengths: cost of living A+, housing A+; Watch: crime D, schools D-, amenities F.
- Clayton County (suburban): math 11% / reading 20% proficiency, ranked #155 of 174 in GA (top 89%) — low school quality limits family demand, transient renter base, plan for 1-2y turnover; 78% free/reduced lunch — lower-income household profile, screen leases tightly.
- Market conditions: Rents rising (+1.3%/yr); 182 active listings in the ZIP; 6 comparable units currently listed for rent nearby; rentals leasing fast (median 6d on market — plan ~1-2 weeks tenant-placement turnaround); 865 units permitted in Clayton County in 2024 (448 in 5+ unit buildings).
- At $3,377/mo this rent would consume 78% of the median local household income ($52k/yr) (locally 2586% of renters already pay >50% of income on rent) — very limited rent-growth headroom before tenants either downsize or default.
Forward outlook
- Local home prices are declining (-3.0%/yr); year-one equity from $2k of loan paydown is wiped out by about $9k of value loss. Plan a longer hold.
- Clayton County population projected at +29% by 2050 — long-run rental-demand tailwind backs the buy-and-hold thesis.
Negotiation context
- It's been on market 16 days — a 2% lower offer ($296k) is reasonable based on typical stale-listing flexibility.
- Current owner paid $90k; list at $300k implies a 234% gain — meaningful room to come down on a strong offer.
Risks & watch-outs
- Climate carrying-cost: moderate wind risk, 26% chance of damaging wind over 30y; extreme-heat days projected 7→18/yr by 2055 (HVAC capex compounding) — expect insurance premiums to compound above CPI over the hold.
Questions for the listing agent
- Can we see the unit-by-unit rent roll, current vacancy, and any below-market leases? What's the average tenancy length?
- What capital expenditures (roof, boiler, parking lot, exteriors) have been made in the last 5 years, and what's planned in the next 2?
- Is there a deadline driving the sale (1031 exchange, divorce, estate, relocation)? That informs how much negotiation room exists.
- Schools are D-rated, which usually means shorter tenancies and higher turnover. Who's the typical renter profile here, and what's been the actual vacancy rate?
- Crime grade is D in this area — have there been break-ins, vandalism, or insurance claims at this property in the last 3 years? What carrier currently insures it and at what premium?
- What's the average days-on-market for RENTAL listings here right now (not sales)? A rising rental-DOM trend means longer vacancies and softer asking-rent achievability than the comps imply.
- What's the recent tenant-quality profile in this submarket — average credit score on applications, eviction rate, late-payment / NSF rate, and stable-employment percentage? A property-management company in the area should have these aggregated.
- How much new apartment / multifamily construction is in the pipeline within 1–3 miles? Heavy new supply (>2% of stock underway) typically softens rents 12–24 months out; light construction supports rent growth.
Investment metrics
- 1% rule
- 1.13% ✓
- Cap rate
- 9.73%
- Cash-on-cash
- 12.26%
- DSCR
- 1.55
- GRM
- 7.4
CMA / ARV
- ARV (on-the-fly)
- $325,677
- Comps found
- 1
Show comp detail 1 sale within ~0.75 mi
| Address | Dist | Beds/Ba | Sqft | Sold | Price | $/sf | Match |
|---|---|---|---|---|---|---|---|
| 358 Riverbrook Ct | 0.07mi | 4/4.0 (-1) | 2,196 (-6%) | 10mo | $305,000 | $139 | 65 |
Match score weights: distance 35% · size 25% · config 20% · recency 20%. Top-matched comps best support the ARV.
Projected returns pro-forma
-3.0% appreciation · 1.3% rent growth · sell at horizon
- IRR
- 0.1%
- Equity multiple
- 1.00×
- Total profit
- $256
- Equity at exit
- $44,731
- IRR
- 8.0%
- Equity multiple
- 1.57×
- Total profit
- $47,630
- Equity at exit
- $25,939
Cash invested: $84,000 (down + closing). Projections, not guarantees.
Landlord ↔ Tenant lean methodology
- Overall (STATE)
- 90 Strongly Landlord-Friendly
- State Georgia
- 90 Strongly Landlord-Friendly · R+3
- County
- — inherits STATE
- City
- — inherits STATE
ZIP-level market 30274
- Home prices YoY
- -19.6%
- Rents YoY
- 1.3%
- Active inventory
- 182
- Price-to-rent
- 15.4×
Monthly cashflow live
- Estimated rent
- $3,377 high interval (Pro) →
- Mortgage (P&I)
- −$1,573
- Tax from tax record
- −$111 /mo · $1,337/yr
- Insurance
- −$125
- HOA
- −$0
- Vacancy / Maint / Mgmt
- −$709
- Net cashflow
- $858
Break-even live
2-unit breakdown (identical units grouped — click to expand)
| Units | Beds | Baths | Est. rent |
|---|---|---|---|
| 1× unit | 2 | 1.5 | $1,625 |
| 1× unit | 3 | 2.5 | $1,753 |
| Total (2 units) | $3,377 | ||
UW: 25.0% down · 7.5% · 30yr · 1.5% tax · 5.0% vac · 8.0% maint · 8.0% mgmt
Financing live
Cash to close
- Down payment
- $75,000
- Closing costs
- $9,000
- Reserves months
- —
- Total cash needed
- —
Loan-product check · same deal, 3 products live
Conventional
25% down · 7.5% · 30yr
- Down + closing
- —
- Monthly P&I
- —
- Monthly cashflow
- —
- DSCR
- —
- Eligible?
- —
Personal DTI + credit; lowest rate.
DSCR
20% down · 8.5% · 30yr
- Down + closing
- —
- Monthly P&I
- —
- Monthly cashflow
- —
- DSCR
- —
- Eligible?
- —
No personal income docs; deal must DSCR.
Hard money
10% down · 12.0% · 12mo
- Down + closing
- —
- Monthly P&I
- —
- Monthly cashflow
- —
- DSCR
- —
- Eligible?
- —
Short-term bridge; refi at stabilization.
Rent comps 6 comps
| Address | Beds | Baths | Sqft | Rent | $/sqft | DOM | Units | Dist |
|---|---|---|---|---|---|---|---|---|
| 6433 Valley Brook Dr Riverdale, GA | 4.0 | 2.0 | 2000 | $2,500 | $1.25 | 24d | 1 | 0.24mi |
| 218 Ridge Trl Riverdale, GA | 4.0 | 1.5 | 1826 | $2,100 | $1.15 | 5d | 1 | 0.41mi |
| 6748 Black Twig Ct Riverdale, GA | 5.0 | 2.0 | 1850 | $2,125 | $1.15 | 5d | 1 | 0.85mi |
| 6492 Meadow Lark Dr Riverdale, GA | 4.0 | 3.0 | 2158 | $2,260 | $1.05 | 2d | 1 | 0.97mi |
| 263 Elm Forest Way Riverdale, GA | 4.0 | 3.0 | 2006 | $2,173 | $1.08 | 22d | 1 | 1.13mi |
| 6316 Steepleridge Ct Riverdale, GA | 4.0 | 2.5 | 1634 | $2,011 | $1.23 | 5d | 1 | 1.20mi |
Listing history 11 events
-
2026-06-18days on market $300,000 Active 16 DOM
-
2026-06-17days on market $300,000 Active 15 DOM
-
2026-06-16days on market $300,000 Active 14 DOM
-
2026-06-15days on market $300,000 Active 13 DOM
-
2026-06-13days on market $300,000 Active 11 DOM
-
2026-06-09days on market $300,000 Active 7 DOM
-
2026-06-08days on market $300,000 Active 6 DOM
-
2026-06-07days on market $300,000 Active 5 DOM
-
2026-06-04days on market $300,000 Active 2 DOM
-
2026-06-02remarks 570-char remark
-
2026-06-02$300,000 Active 1 DOM
ⓘ Source: listings_history table (triggers on properties + properties_extension) + one-shot
backfill from property_details.listing_events for pre-trigger history.
Tax reassessment forecast GA · Resets to sale price
- Current annual tax
- $1,337 · $111/mo
- Projected year-2 tax
- $2,760 · $230/mo
- Expected delta
- +$1,423/yr (+$119/mo · 106.5%)
ⓘ Screening estimate from a state-policy table — verify with the county assessor before closing.
Climate risk First Street
- Flood 1/10 Low FEMA zone X (unshaded) · 0% chance over 30 yrs
- Wildfire 2/10 Low
- Heat 6/10 Major 7 d/yr ≥104°F today · 18 d/yr by 30 yrs out
- Wind 5/10 Major 26% chance of damaging wind over 30 yrs
- Air quality 4/10 Moderate 4 unhealthy d/yr today · 7 by 30 yrs out
Nearby sold comps map
Loading sold comps map…
Walkable amenities ~0.75 mi
Loading nearby amenities…
Taxation est. · year 1
- Rental income
- $40,524
- − Mortgage interest
- −$16,805
- − Property taxes
- −$1,337
- − Insurance
- −$1,500
- − Repairs & maintenance
- −$3,242
- − Management
- −$3,242
- − Depreciation
- −$8,727
- Taxable income
- $5,672
- Est. tax owed @ 24.0%
- −$1,361
- After-tax cash flow
- $8,937/yr
For passive investors: Depreciation is non-cash, so a rental often shows a tax loss while cash-flowing — sheltering income. Rental losses are passive: they offset passive income freely, and up to $25,000/yr can offset ordinary (W-2) income if you actively participate and your MAGI is under $100k (phasing out to $0 by $150k); unused losses carry forward. On sale, claimed depreciation is recaptured at up to 25%, and gains may owe capital-gains tax (a 1031 exchange can defer both). Figures are a year-1 estimate at your 24.0% rate — not tax advice; consult a CPA.
Schools (NCES district)
- District
- Clayton County
- NCES district ID
- 1301230
- Math proficiency
- 11% ▼ -13.00%
- Reading proficiency
- 20% ▼ -9.00%
- Median HH income
- $42,266
- Composite
- 13.41/100
- National rank
- #9527
- State rank
- #155 of 174 in GA
Livability — Riverdale
- Score
- 70/100
- State rank
- #100
- US rank
- #7907
Category grades
Schools grade is shown separately in the Schools card above.
Census & demographics
- Census place
- Riverdale, GA
- County
- Clayton County · 230,153 people
- City population
- 61,126
- Metro
- Atlanta-Sandy Springs-Alpharetta, GA
- Population (ZIP)
- 34,081
- Household income
- $52,209
- Rent vs Own
- Severe rent burden
- 2586.0
Population outlook (Clayton County) Hauer SSP2
- Today (2025)
- 310,777 people
- By 2030
- 329,762 · +6.1%
- By 2040
- 368,052 · +18.4%
- By 2050
- 401,196 · +29.1%
- By 2075
- 472,488 · +52.0%
- By 2100
- 500,446 · +61.0%
Race, ethnicity, and origin ACS 2023
- Neighborhood character
- Predominantly Black (76%)
- Race & ethnicity
- Black 76% Hispanic / Latino 14% Two or more races 5% Asian 5% White 5%
- Hispanic origin (detail)
- Mexican 9% Puerto Rican 1%
- Foreign-born
- 15% · Canada, Vietnam
- Languages at home
- 80% English-only · Spanish 12% Vietnamese 2% Other Asian/Pacific 2%
Political lean MEDSL · Clayton
- 2024 margin
- Solid D (+69.2) · D 84.3% · R 15.1%
- 2008→2024 swing
- +2.8pp toward D · 2008: 66.4pp · 2024: 69.2pp
- All cycles
- 2024: D+69.2 2020: D+70.9 2016: D+71.9 2012: D+70.1 2008: D+66.4
Not yet ingested
- Civics
- —
Market trends
- HPI YoY
- ▼ -57.82%
- Current HPI
- 236.3592
- Rent YoY
- ▲ 1.30%
- Metro
- Atlanta-Sandy Springs-Alpharetta, GA
- State GDP YoY
- ▲ 2.66%
- F500 in state
- 28
Industry mix (Fortune 500 HQ in GA)
| Industry | F500 HQs | Revenue |
|---|---|---|
| Paper / Packaging | 2 | $29B |
|
||
| Retail | 1 | $160B |
|
||
| Transportation / Logistics | 1 | $91B |
|
||
| Airlines | 1 | $62B |
|
||
| Consumer Goods | 1 | $47B |
|
||
| Utilities | 1 | $25B |
|
||
Price history
+233.7% since first listed2 events — show timeline
- 2026-06-03 Listed $300,000 FSBO.com
- 1983-08-19 Sold (Public Records) $89,900 Public Records
Property tax history
-2.2%/yrLatest (2025): $1,337 · -2.4% YoY. Source: county tax records.
Cash-flow waterfall
monthlySold comps — $/sqft
last 12 mo · ≤1 miLoading sold comps…