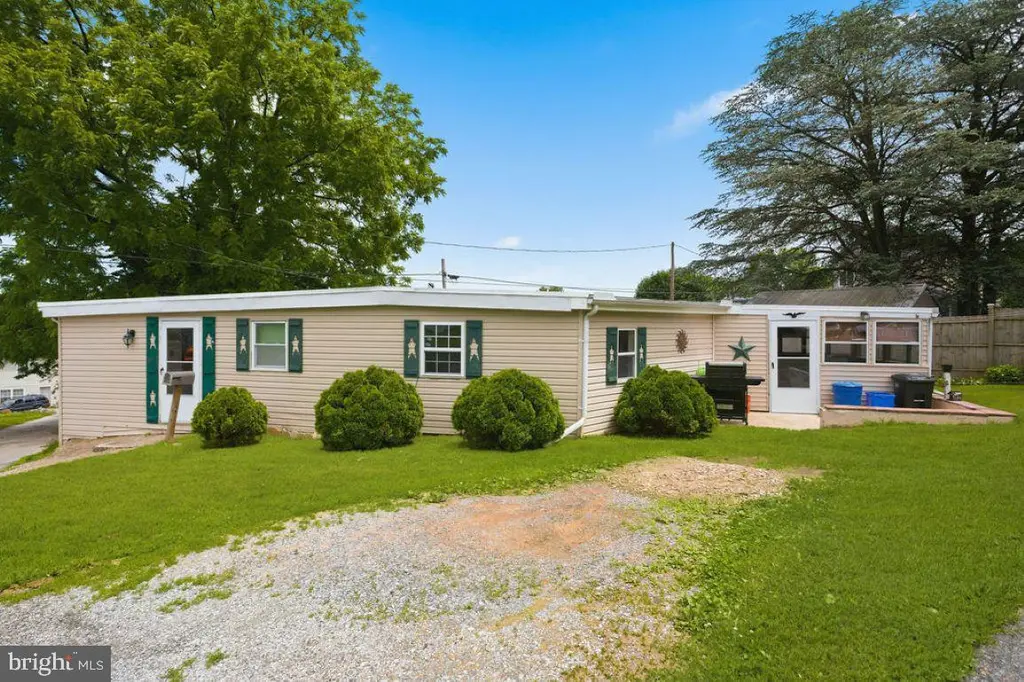
116 Howard Ave · Wrightsville, PA
Flood risk 8/10 · Major
- FEMA flood zone
- X (unshaded)
- Chance of flooding over 30 yrs
- 0.99%
- Est. flood insurance / yr
- $473 – $860
Fire risk 3/10 · Minor
- Est. fire insurance / yr
- $511 – $949
Heat risk 6/10 · Moderate
- Hot days now (above 102°F)
- 7 days/yr
- Hot days in 30 yrs
- 15 days/yr
Wind risk 4/10 · Minor
- Chance of severe wind over 30 yrs
- 14.0%
Air-quality risk 3/10 · Minor
- Unhealthy air days now
- 2 days/yr
- Unhealthy air days in 30 yrs
- 5 days/yr
Risk factors via First Street. Map © Google.
Why this score? — see what drove the B- grade
The composite is a weighted blend of 9 inputs, each scored 0–100. Each bar is that input's sub-score; the figure is the points it added to the 100-point composite (weight × sub-score).
- Cash flow +23.8/30.0
- ARV discount +15.0/15.0
- DSCR +7.7/10.0
- 1% rule +6.2/10.0
- Schools +4.5/10.0
- Livability +3.7/5.0
- Rent growth +2.5/5.0
- Condition / age +2.5/5.0
- Appreciation +0.0/10.0
$150,000
🖨 Deal sheet 📄 Offer letter ✓ Due diligence
Listing remarks
Adorable bungalow home full of charm. You're going to fall in love with all of the extra little touches this home offers, like wooden ceilings, shiplap walls, exposed ceiling beams, and wainscoting. The pellet stove in the living room helps with those heating bills. 3 bedrooms and a full modern bath with double sinks is an added surprise! Screen porch lets you enjoy the outdoors without the hassle of dealing with bugs. Off street parking and the storage shed conveys. Hurry, you don't want to miss this cutie!
Key facts
- 5,672 sq ft lot
- Built 1961
- Listed 2 days
Property features AI
Exterior
- Parking: Off-street parking
- Utilities: Public water; Public sewer; 200+ amp electric service; Electric hot water
- Home design: Detached property; Not located in a federal flood zone; Fee simple ownership
- Construction: Block construction; Permanent foundation; Above-grade and below-grade structures
- Exterior features: Porch(es); Deck(s)
Interior
- Kitchen: Refrigerator; Dishwasher
- Bedrooms: Three bedrooms on the main level (Master bedroom, Bedroom 2, Bedroom 3)
- Bathrooms: One full bathroom on the main level
- Heating & cooling: Electric heating; Window air conditioning units
- Interior features: Living room; Dining room; Sitting room; Screened porch
Neighborhood map
What this means for you Summary
Snapshot
- This is a 3-bed/1.0-bath single-family listed at $150k.
Deal economics
- At list price, monthly cash flow is $232 ($3k/yr) — positive.
- The deal already cash-flows at list — no discount required.
- Meets the 1% rule at list price ($2k rent vs $150k).
Location & tenants
- Location reads 73/100 on livability (#562 in PA) — a middle-class / working-renter tenant base. Strengths: crime A+, cost of living A+, housing A+; Watch: employment C-, amenities F, commute F.
- Eastern York SD (rural): math 40% / reading 64% proficiency, ranked #146 of 539 in PA (top 27%) — acceptable for families but not a draw, mixed tenant base, ~2y average lease.
- Market conditions: 52 active listings in the ZIP; 1 comparable units currently listed for rent nearby; 1,328 units permitted in York County in 2024 (338 in 5+ unit buildings).
Forward outlook
- Local home prices are declining (-3.0%/yr); year-one equity from $1k of loan paydown is wiped out by about $4k of value loss. Plan a longer hold.
Negotiation context
- Only 2 days on market — expect competitive offers; lowballing is unlikely to land.
- 3 sale attempts since 25y ago with the ask held roughly flat each time — persistent listings suggest the price (not the market) is what's stuck; bring a comps-based counter.
- Current owner paid $40k; list at $150k implies a 280% gain — meaningful room to come down on a strong offer.
Risks & watch-outs
- Watch-outs: flood insurance adds $56/mo.
- Climate carrying-cost: severe flood risk; extreme-heat days projected 7→15/yr by 2055 (HVAC capex compounding) — expect insurance premiums to compound above CPI over the hold.
Questions for the listing agent
- Built in 1961 — when were the roof, HVAC, electrical panel, plumbing, and water heater last replaced?
- What's the actual annual flood-insurance premium (NFIP or private), and is the property in a SFHA with mandatory coverage?
- Is there a deadline driving the sale (1031 exchange, divorce, estate, relocation)? That informs how much negotiation room exists.
- Schools are B-rated — typically a magnet for longer-tenancy family renters. What's the average tenant stay here, and is there a school-zone premium baked into asking?
- What's the average days-on-market for RENTAL listings here right now (not sales)? A rising rental-DOM trend means longer vacancies and softer asking-rent achievability than the comps imply.
- What's the recent tenant-quality profile in this submarket — average credit score on applications, eviction rate, late-payment / NSF rate, and stable-employment percentage? A property-management company in the area should have these aggregated.
- How much new for-sale + rental construction is in the pipeline within 1–3 miles? Heavy new supply typically softens prices + rents 12–24 months out; constrained supply supports both.
Investment metrics
- 1% rule
- 1.12% ✓
- Cap rate
- 8.59%
- Cash-on-cash
- 8.21%
- DSCR
- 1.37
- GRM
- 7.4
CMA / ARV
- ARV (on-the-fly)
- $259,666
- Comps found
- 5
Show comp detail 5 sales within ~0.75 mi
| Address | Dist | Beds/Ba | Sqft | Sold | Price | $/sf | Match |
|---|---|---|---|---|---|---|---|
| 131 Brook Ln | 0.55mi | 3/1.0 | 1,120 (+4%) | 10mo | $280,000 | $250 | 59 |
| 201 N 7th St | 0.67mi | 3/1.0 | 1,080 (+1%) | 12mo | $260,000 | $241 | 58 |
| 106 Fishermans Ln | 0.67mi | 3/1.0 | 1,097 (+2%) | 16mo | $265,000 | $242 | 52 |
| 453 N 4th St | 0.56mi | 3/1.0 | 1,160 (+8%) | 23mo | $300,000 | $259 | 42 |
| 505 S 6th St | 0.48mi | 3/1.0 | 1,232 (+15%) | 17mo | $267,000 | $217 | 39 |
Match score weights: distance 35% · size 25% · config 20% · recency 20%. Top-matched comps best support the ARV.
Projected returns pro-forma
-3.0% appreciation · 3.0% rent growth · sell at horizon
- IRR
- -6.1%
- Equity multiple
- 0.77×
- Total profit
- $-9,476
- Equity at exit
- $22,365
- IRR
- 3.6%
- Equity multiple
- 1.26×
- Total profit
- $11,024
- Equity at exit
- $12,969
Cash invested: $42,000 (down + closing). Projections, not guarantees.
Landlord ↔ Tenant lean methodology
- Overall (STATE)
- 62 Landlord-Friendly
- State Pennsylvania
- 62 Landlord-Friendly · EVEN
- County
- — inherits STATE
- City
- — inherits STATE
ZIP-level market 17368
- Home prices YoY
- -26.3%
- Active inventory
- 52
- Price-to-rent
- 7.4×
Monthly cashflow live
- Estimated rent
- $1,686 medium interval (Pro) →
- Mortgage (P&I)
- −$787
- Tax from tax record
- −$195 /mo · $2,340/yr
- Insurance
- −$62
- Flood insurance flood zone
- −$56 /mo · $666/yr
- HOA
- −$0
- Vacancy / Maint / Mgmt
- −$354
- Net cashflow
- $232
Break-even live
UW: 25.0% down · 7.5% · 30yr · 1.5% tax · 5.0% vac · 8.0% maint · 8.0% mgmt
Financing live
Cash to close
- Down payment
- $37,500
- Closing costs
- $4,500
- Reserves months
- —
- Total cash needed
- —
Loan-product check · same deal, 3 products live
Conventional
25% down · 7.5% · 30yr
- Down + closing
- —
- Monthly P&I
- —
- Monthly cashflow
- —
- DSCR
- —
- Eligible?
- —
Personal DTI + credit; lowest rate.
DSCR
20% down · 8.5% · 30yr
- Down + closing
- —
- Monthly P&I
- —
- Monthly cashflow
- —
- DSCR
- —
- Eligible?
- —
No personal income docs; deal must DSCR.
Hard money
10% down · 12.0% · 12mo
- Down + closing
- —
- Monthly P&I
- —
- Monthly cashflow
- —
- DSCR
- —
- Eligible?
- —
Short-term bridge; refi at stabilization.
Rent comps 1 comps
| Address | Beds | Baths | Sqft | Rent | $/sqft | DOM | Units | Dist |
|---|---|---|---|---|---|---|---|---|
| 37 Travis Cir Wrightsville, PA | 2.0 | 2.0–2.5 | 1361 | $1,686 | $1.24 | 13d | 14 | 0.77mi |
Listing history 4 events
-
2026-06-10status $150,000 Pending 2 DOM
-
2026-05-31days on market $150,000 Active 2 DOM
-
2026-05-30remarks 514-char remark
-
2026-05-30$150,000 Active 1 DOM
ⓘ Source: listings_history table (triggers on properties + properties_extension) + one-shot
backfill from property_details.listing_events for pre-trigger history.
Tax reassessment forecast PA · Partial reset (capped growth)
- Current annual tax
- $2,340 · $195/mo
- Projected year-2 tax
- $2,355 · $196/mo
- Expected delta
- +$15/yr (+$1/mo · 0.6%)
ⓘ Screening estimate from a state-policy table — verify with the county assessor before closing.
Climate risk First Street
- Flood 8/10 Severe FEMA zone X (unshaded) · 99% chance over 30 yrs
- Wildfire 3/10 Moderate
- Heat 6/10 Major 7 d/yr ≥102°F today · 15 d/yr by 30 yrs out
- Wind 4/10 Moderate 14% chance of damaging wind over 30 yrs
- Air quality 3/10 Moderate 2 unhealthy d/yr today · 5 by 30 yrs out
Nearby sold comps map
Loading sold comps map…
Walkable amenities ~0.75 mi
Loading nearby amenities…
Taxation est. · year 1
- Rental income
- $20,226
- − Mortgage interest
- −$8,402
- − Property taxes
- −$2,340
- − Insurance
- −$1,416
- − Repairs & maintenance
- −$1,618
- − Management
- −$1,618
- − Depreciation
- −$4,364
- Taxable income
- $467
- Est. tax owed @ 24.0%
- −$112
- After-tax cash flow
- $2,670/yr
For passive investors: Depreciation is non-cash, so a rental often shows a tax loss while cash-flowing — sheltering income. Rental losses are passive: they offset passive income freely, and up to $25,000/yr can offset ordinary (W-2) income if you actively participate and your MAGI is under $100k (phasing out to $0 by $150k); unused losses carry forward. On sale, claimed depreciation is recaptured at up to 25%, and gains may owe capital-gains tax (a 1031 exchange can defer both). Figures are a year-1 estimate at your 24.0% rate — not tax advice; consult a CPA.
Schools (NCES district)
- District
- Eastern York SD
- NCES district ID
- 4208790
- Math proficiency
- 40% ▼ -18.00%
- Reading proficiency
- 64% ▼ -11.00%
- Median HH income
- $56,178
- Composite
- 44.94/100
- National rank
- #2712
- State rank
- #146 of 539 in PA
Livability — Wrightsville
- Score
- 73/100
- State rank
- #562
- US rank
- #5294
Category grades
Schools grade is shown separately in the Schools card above.
Census & demographics
- Census place
- Wrightsville, PA
- Population (ZIP)
- 6,768
Population outlook (York County) Hauer SSP2
- Today (2025)
- 454,205 people
- By 2030
- 457,407 · +0.7%
- By 2040
- 457,529 · +0.7%
- By 2050
- 448,261 · -1.3%
- By 2075
- 427,388 · -5.9%
- By 2100
- 384,218 · -15.4%
Race, ethnicity, and origin ACS 2023
- Neighborhood character
- Predominantly White (91%)
- Race & ethnicity
- White 91% Two or more races 5% Hispanic / Latino 3%
- Common ancestry
- Slovak 3% Romanian 3% Lithuanian 2%
- Foreign-born
- 2% · Canada, Vietnam
- Languages at home
- 95% English-only · Spanish 3% Russian/Polish/Slavic 1% Vietnamese 1%
Political lean MEDSL · York
- 2024 margin
- Strong R (+25.3) · D 36.9% · R 62.1%
- 2008→2024 swing
- -11.7pp toward R · 2008: -13.6pp · 2024: -25.3pp
- All cycles
- 2024: R+25.3 2020: R+24.6 2016: R+29.3 2012: R+21.2 2008: R+13.6
Not yet ingested
- Civics
- —
Market trends
- HPI YoY
- ▼ -91.10%
- Current HPI
- 255.1214
- Rent YoY
- —
- Metro
- —
- State GDP YoY
- ▲ 1.68%
- F500 in state
- 34
Industry mix (Fortune 500 HQ in PA)
| Industry | F500 HQs | Revenue |
|---|---|---|
| Healthcare | 2 | $309B |
|
||
| Insurance | 2 | $27B |
|
||
| Telecommunications / Media | 1 | $124B |
|
||
| Industrial Distribution | 1 | $22B |
|
||
| Financial Services | 1 | $20B |
|
||
| Chemicals / Materials | 1 | $18B |
|
||
Price history
+279.7% since first listed7 events — show timeline
- 2026-05-30 Listed $150,000 BRIGHT MLS
- 2026-05-30 Coming Soon $150,000 BRIGHT MLS
- 2002-09-02 Listing Removed — BRIGHT MLS
- 2002-06-02 Listed $65,000 BRIGHT MLS
- 2002-04-30 Listing Removed — BRIGHT MLS
- 2001-10-04 Listed $72,900 BRIGHT MLS
- 1995-08-07 Sold (Public Records) $39,500 Public Records
Property tax history
+2.7%/yrLatest (2025): $2,340 · +3.3% YoY. Source: county tax records.
Cash-flow waterfall
monthlySold comps — $/sqft
last 12 mo · ≤1 miLoading sold comps…