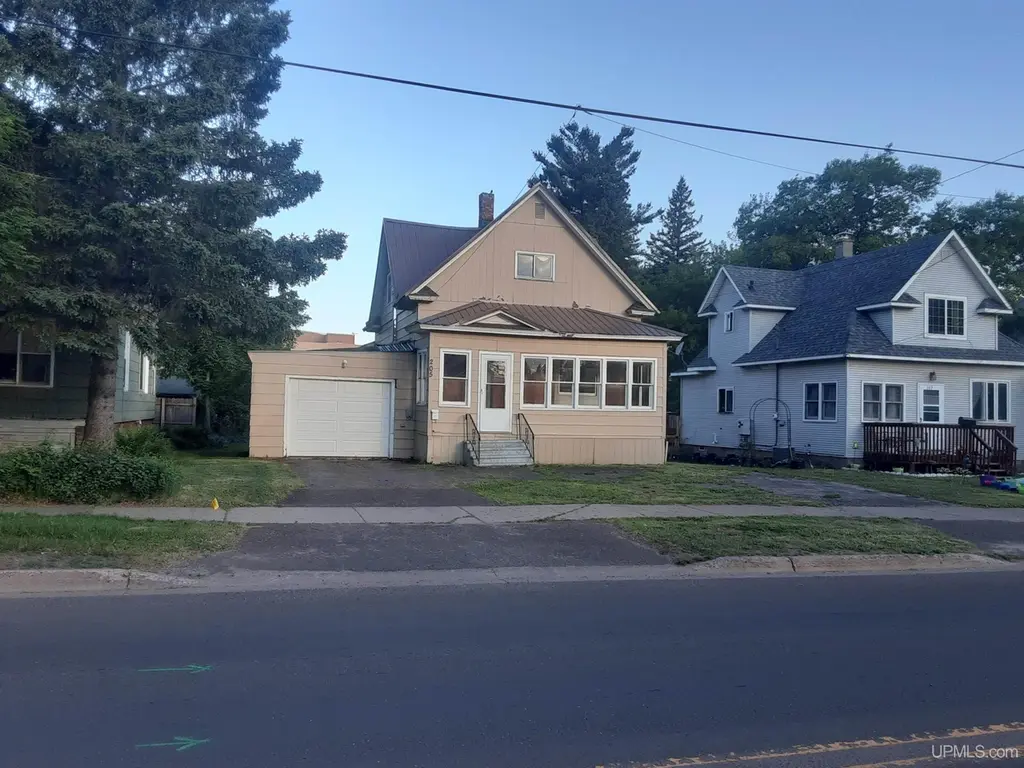
205 N Lake St · Ironwood, MI
Flood risk 1/10 · Minimal
- FEMA flood zone
- X
- Chance of flooding over 30 yrs
- 0.0%
- Est. flood insurance / yr
- $473 – $860
Fire risk 1/10 · Minimal
- Est. fire insurance / yr
- $784 – $1,456
Heat risk 1/10 · Minimal
- Hot days now (above 89°F)
- 7 days/yr
- Hot days in 30 yrs
- 13 days/yr
Wind risk 1/10 · Minimal
- Chance of severe wind over 30 yrs
- —
Air-quality risk 1/10 · Minimal
- Unhealthy air days now
- 0 days/yr
- Unhealthy air days in 30 yrs
- 0 days/yr
Risk factors via First Street. Map © Google.
Why this score? — see what drove the B- grade
The composite is a weighted blend of 9 inputs, each scored 0–100. Each bar is that input's sub-score; the figure is the points it added to the 100-point composite (weight × sub-score).
- Cash flow +30.0/30.0
- 1% rule +10.0/10.0
- DSCR +10.0/10.0
- ARV discount +7.6/15.0
- Livability +3.5/5.0
- Schools +2.6/10.0
- Rent growth +2.5/5.0
- Condition / age +2.5/5.0
- Appreciation +0.0/10.0
$89,000
🖨 Deal sheet 📄 Offer letter ✓ Due diligence
Listing remarks MLS
Nice 3 bedroom, 1 1/2 bath home in Ironwood located near school, hiking trails and snowmobile/ATV trail. Good size living room, dining room, kitchen and 1/2 bath on the main floor. Three good size bedrooms and a full bath upstairs. Detached one car garage and a nice back yard. House has been well maintained. Call for a showing today!
Key facts
- Snowmobile atv trail
- Back yard
- Kitchen
Tags
Property features AI
Exterior
- Parking: Attached garage with space for 1 vehicle
- Utilities: Electricity connected; Natural gas connected; Public water; Public sanitary sewer
- Home design: Residential property; 1 1/2-story structure; Built in 1910; Basement entry/foundation
- Construction: Wood and Masonite exterior; Basement foundation; Full basement
- Exterior features: Porch; Accessible doors; City/county year-round road access; Road frontage (50')
Interior
- Kitchen: Kitchen on the first floor (approx. 10 x 14); Range/oven; Refrigerator
- Bedrooms: Three bedrooms located on the second floor (approx. 11 x 12, 11 x 12, and 10 wide)
- Bathrooms: One full bathroom; One lavatory (half bath)
- Heating & cooling: Forced air heating; Ceiling fan(s); no central air; Electric water heater; Natural gas fuel
- Interior features: Cable/Internet available; First-floor lavatory
- Laundry & utility: Full basement
Neighborhood map
What this means for you Summary
Snapshot
- This is a 3-bed/1.5-bath single-family listed at $89k.
Deal economics
- At list price, monthly cash flow is $470 ($6k/yr) — positive.
- The deal already cash-flows at list — no discount required.
- Meets the 1% rule at list price ($1k rent vs $89k).
- Cap rate 12.6% vs local median 5.8% in Ironwood — top-decile yield for the area; either an underpriced asset or a hidden risk that comps aren't pricing in. Stress-test before assuming the spread holds.
Location & tenants
- Location reads 70/100 on livability (#325 in MI) — a middle-class / working-renter tenant base. Strengths: cost of living A+, crime A, housing A; Watch: health & safety C-, schools D+, amenities F.
- Ironwood Area Schools Of Gogebic County (town): math 23% / reading 40% proficiency, ranked #361 of 540 in MI (top 67%) — families likely to look elsewhere, expect single-tenant / working-renter base with shorter leases.
- Market conditions: 70 active listings in the ZIP; 28 units permitted in Gogebic County in 2024 (0 in 5+ unit buildings).
Forward outlook
- Local home prices are declining (-3.0%/yr); year-one equity from $615 of loan paydown is wiped out by about $3k of value loss. Plan a longer hold.
- Gogebic County population projected at -24% by 2050 — secular population decline; favor cash flow + early exit over multi-decade hold.
- At projected returns (-3.0% appreciation + 3.0% rent growth), your $25k cash investment doubles in ~6 years — after that, you're playing with house money.
Negotiation context
- Only 10 days on market — expect competitive offers; lowballing is unlikely to land.
- 4 sale attempts since 5y ago with the ask held roughly flat each time — persistent listings suggest the price (not the market) is what's stuck; bring a comps-based counter.
Risks & watch-outs
- Watch-outs: built in 1910 — expect roof / HVAC / electrical / plumbing capex.
Questions for the listing agent
- Built in 1910 — when were the roof, HVAC, electrical panel, plumbing, and water heater last replaced?
- Is there a deadline driving the sale (1031 exchange, divorce, estate, relocation)? That informs how much negotiation room exists.
- Schools are D-rated, which usually means shorter tenancies and higher turnover. Who's the typical renter profile here, and what's been the actual vacancy rate?
- What's the average days-on-market for RENTAL listings here right now (not sales)? A rising rental-DOM trend means longer vacancies and softer asking-rent achievability than the comps imply.
- What's the recent tenant-quality profile in this submarket — average credit score on applications, eviction rate, late-payment / NSF rate, and stable-employment percentage? A property-management company in the area should have these aggregated.
- How much new for-sale + rental construction is in the pipeline within 1–3 miles? Heavy new supply typically softens prices + rents 12–24 months out; constrained supply supports both.
Investment metrics
- 1% rule
- 1.52% ✓
- Cap rate
- 12.63%
- Cash-on-cash
- 22.64%
- DSCR
- 2.01
- GRM
- 5.5
CMA / ARV
- ARV (on-the-fly)
- $89,100
- Comps found
- 12
Show comp detail 12 sales within ~0.75 mi
| Address | Dist | Beds/Ba | Sqft | Sold | Price | $/sf | Match |
|---|---|---|---|---|---|---|---|
| 720 Hill St | 0.09mi | 2/1.0 (-1) | 960 (-3%) | 2mo | $93,000 | $97 | 82 |
| 237 E Ridge St | 0.52mi | 3/1.0 | 1,014 (+2%) | 10mo | $111,000 | $109 | 62 |
| 602 Lake Ave | 0.35mi | 3/1.0 | 914 (-8%) | 9mo | $47,000 | $51 | 61 |
| 746 Celia St | 0.46mi | 3/1.0 | 1,044 (+6%) | 8mo | $65,000 | $62 | 61 |
| 102 N Mansfield St | 0.32mi | 3/1.5 | 1,100 (+11%) | 9mo | $39,900 | $36 | 59 |
| 244 E Michigan Ave | 0.52mi | 3/1.5 | 1,044 (+6%) | 10mo | $66,000 | $63 | 58 |
| 224 E Harding Ave | 0.57mi | 2/1.0 (-1) | 936 (-6%) | 1mo | $75,000 | $80 | 56 |
| 720 Florence St | 0.38mi | 3/1.0 | 1,120 (+13%) | 3mo | $140,000 | $125 | 56 |
| 221 Frenchtown Rd | 0.64mi | 2/1.0 (-1) | 959 (-3%) | 8mo | $49,500 | $52 | 51 |
| 325 Houk St | 0.67mi | 2/1.0 (-1) | 960 (-3%) | 8mo | $86,000 | $90 | 50 |
| 433 E Margaret St | 0.64mi | 3/1.5 | 1,092 (+10%) | 7mo | $135,000 | $124 | 47 |
| 209 E Harding Ave | 0.60mi | 2/1.0 (-1) | 865 (-13%) | 8mo | $90,000 | $104 | 38 |
Match score weights: distance 35% · size 25% · config 20% · recency 20%. Top-matched comps best support the ARV.
Projected returns pro-forma
-3.0% appreciation · 3.0% rent growth · sell at horizon
- IRR
- 15.5%
- Equity multiple
- 1.62×
- Total profit
- $15,534
- Equity at exit
- $13,270
- IRR
- 24.2%
- Equity multiple
- 3.09×
- Total profit
- $52,128
- Equity at exit
- $7,695
Cash invested: $24,920 (down + closing). Projections, not guarantees.
Landlord ↔ Tenant lean methodology
- Overall (STATE)
- 62 Landlord-Friendly
- State Michigan
- 62 Landlord-Friendly · EVEN
- County
- — inherits STATE
- City
- — inherits STATE
ZIP-level market 49938
- Home prices YoY
- -23.3%
- Active inventory
- 70
- Price-to-rent
- 5.5×
Monthly cashflow live
- Estimated rent
- $1,353 medium interval (Pro) →
- Mortgage (P&I)
- −$467
- Tax from tax record
- −$95 /mo · $1,135/yr
- Insurance
- −$37
- HOA
- −$0
- Vacancy / Maint / Mgmt
- −$284
- Net cashflow
- $470
Break-even live
UW: 25.0% down · 7.5% · 30yr · 1.5% tax · 5.0% vac · 8.0% maint · 8.0% mgmt
Financing live
Cash to close
- Down payment
- $22,250
- Closing costs
- $2,670
- Reserves months
- —
- Total cash needed
- —
Loan-product check · same deal, 3 products live
Conventional
25% down · 7.5% · 30yr
- Down + closing
- —
- Monthly P&I
- —
- Monthly cashflow
- —
- DSCR
- —
- Eligible?
- —
Personal DTI + credit; lowest rate.
DSCR
20% down · 8.5% · 30yr
- Down + closing
- —
- Monthly P&I
- —
- Monthly cashflow
- —
- DSCR
- —
- Eligible?
- —
No personal income docs; deal must DSCR.
Hard money
10% down · 12.0% · 12mo
- Down + closing
- —
- Monthly P&I
- —
- Monthly cashflow
- —
- DSCR
- —
- Eligible?
- —
Short-term bridge; refi at stabilization.
Listing history 9 events
-
2026-06-18days on market $89,000 Active 10 DOM
-
2026-06-17days on market $89,000 Active 9 DOM
-
2026-06-16days on market $89,000 Active 8 DOM
-
2026-06-15days on market $89,000 Active 7 DOM
-
2026-06-13days on market $89,000 Active 5 DOM
-
2026-06-12days on market $89,000 Active 4 DOM
-
2026-06-09remarks 443-char remark
-
2026-06-09remarks 335-char remark
-
2026-06-09$89,000 Active 1 DOM
ⓘ Source: listings_history table (triggers on properties + properties_extension) + one-shot
backfill from property_details.listing_events for pre-trigger history.
Tax reassessment forecast MI · Partial reset (capped growth)
- Current annual tax
- $1,135 · $95/mo
- Projected year-2 tax
- $1,253 · $104/mo
- Expected delta
- +$118/yr (+$10/mo · 10.4%)
ⓘ Screening estimate from a state-policy table — verify with the county assessor before closing.
Climate risk First Street
- Flood 1/10 Low FEMA zone X · 0% chance over 30 yrs
- Wildfire 1/10 Low
- Heat 1/10 Low 7 d/yr ≥89°F today · 13 d/yr by 30 yrs out
- Wind 1/10 Low
- Air quality 1/10 Low 0 unhealthy d/yr today · 0 by 30 yrs out
Nearby sold comps map
Loading sold comps map…
Walkable amenities ~0.75 mi
Loading nearby amenities…
Taxation est. · year 1
- Rental income
- $16,231
- − Mortgage interest
- −$4,985
- − Property taxes
- −$1,135
- − Insurance
- −$445
- − Repairs & maintenance
- −$1,299
- − Management
- −$1,299
- − Depreciation
- −$2,589
- Taxable income
- $4,480
- Est. tax owed @ 24.0%
- −$1,075
- After-tax cash flow
- $4,567/yr
For passive investors: Depreciation is non-cash, so a rental often shows a tax loss while cash-flowing — sheltering income. Rental losses are passive: they offset passive income freely, and up to $25,000/yr can offset ordinary (W-2) income if you actively participate and your MAGI is under $100k (phasing out to $0 by $150k); unused losses carry forward. On sale, claimed depreciation is recaptured at up to 25%, and gains may owe capital-gains tax (a 1031 exchange can defer both). Figures are a year-1 estimate at your 24.0% rate — not tax advice; consult a CPA.
Schools (NCES district)
- District
- Ironwood Area Schools Of Gogebic County
- NCES district ID
- 2619470
- Math proficiency
- 23% ▼ -13.00%
- Reading proficiency
- 40% ▼ -5.00%
- Median HH income
- $33,313
- Composite
- 25.78/100
- National rank
- #7369
- State rank
- #361 of 540 in MI
Livability — Ironwood
- Score
- 70/100
- State rank
- #325
- US rank
- #8024
Category grades
Schools grade is shown separately in the Schools card above.
Census & demographics
- Census place
- Ironwood, MI
- Population (ZIP)
- 7,424
Population outlook (Gogebic County) Hauer SSP2
- Today (2025)
- 13,951 people
- By 2030
- 13,191 · -5.4%
- By 2040
- 11,739 · -15.9%
- By 2050
- 10,580 · -24.2%
- By 2075
- 8,530 · -38.9%
- By 2100
- 6,903 · -50.5%
Race, ethnicity, and origin ACS 2023
- Neighborhood character
- Predominantly White (94%)
- Race & ethnicity
- White 94% Two or more races 3% Hispanic / Latino 2%
- Common ancestry
- Romanian 10% Lithuanian 4% Portuguese 3%
- Foreign-born
- 1%
- Languages at home
- 97% English-only · Spanish 2%
Political lean MEDSL · Gogebic
- 2024 margin
- R (+17.1) · D 40.8% · R 57.9% · Other 1.2%
- 2008→2024 swing
- -34.4pp toward R · 2008: 17.3pp · 2024: -17.1pp
- All cycles
- 2024: R+17.1 2020: R+12.5 2016: R+15.0 2012: D+8.1 2008: D+17.3
Not yet ingested
- Civics
- —
Market trends
- HPI YoY
- ▼ -61.86%
- Current HPI
- 204.0924
- Rent YoY
- —
- Metro
- —
- State GDP YoY
- ▲ 1.37%
- F500 in state
- 28
Industry mix (Fortune 500 HQ in MI)
| Industry | F500 HQs | Revenue |
|---|---|---|
| Automotive Parts | 3 | $48B |
|
||
| Automotive | 2 | $372B |
|
||
| Chemicals | 1 | $45B |
|
||
| Automotive Retail | 1 | $29B |
|
||
| Healthcare / Medical Devices | 1 | $23B |
|
||
| Automotive Technology | 1 | $20B |
|
||
Price history
+48.6% since first listed5 events — show timeline
- 2026-06-08 Listed $89,000 UPAR
- 2026-06-08 Listed $89,000 GNMLS
- 2026-06-08 Listed $89,000 MiRealSource-MiMLS
- 2021-10-20 Listing Removed — MiRealSource-MiMLS
- 2021-07-09 Listed $59,900 MiRealSource-MiMLS
Property tax history
+0.1%/yrLatest (2024): $1,135 · +0.2% YoY. Source: county tax records.
Cash-flow waterfall
monthlySold comps — $/sqft
last 12 mo · ≤1 miLoading sold comps…