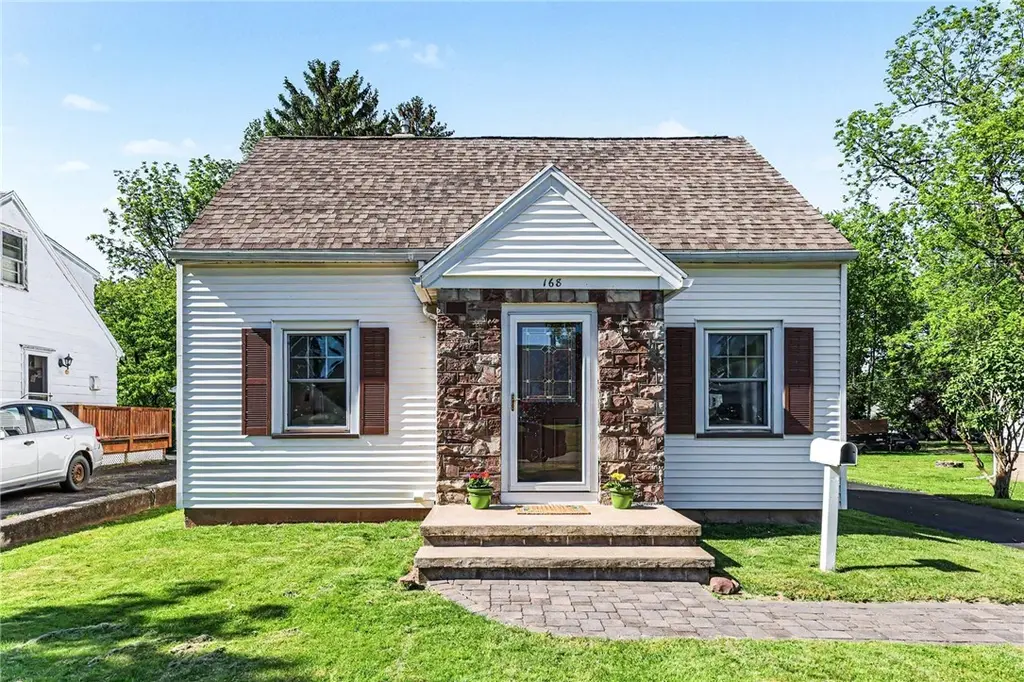
168 Cinnabar Rd · Irondequoit, NY
Flood risk 1/10 · Minimal
- FEMA flood zone
- X (unshaded)
- Chance of flooding over 30 yrs
- 0.0%
- Est. flood insurance / yr
- $473 – $860
Fire risk 3/10 · Minor
- Est. fire insurance / yr
- $691 – $1,283
Heat risk 2/10 · Minimal
- Hot days now (above 95°F)
- 7 days/yr
- Hot days in 30 yrs
- 15 days/yr
Wind risk 1/10 · Minimal
- Chance of severe wind over 30 yrs
- —
Air-quality risk 2/10 · Minimal
- Unhealthy air days now
- 1 days/yr
- Unhealthy air days in 30 yrs
- 2 days/yr
Risk factors via First Street. Map © Google.
Why this score? — see what drove the B+ grade
The composite is a weighted blend of 9 inputs, each scored 0–100. Each bar is that input's sub-score; the figure is the points it added to the 100-point composite (weight × sub-score).
- Cash flow +29.3/30.0
- ARV discount +15.0/15.0
- 1% rule +10.0/10.0
- DSCR +10.0/10.0
- Schools +6.2/10.0
- Livability +4.0/5.0
- Rent growth +2.5/5.0
- Condition / age +2.5/5.0
- Appreciation +0.0/10.0
$179,900
🖨 Deal sheet (PDF) 📄 Offer letter ✓ Due diligence
Listing remarks MLS
Absolutely charming! This entire home has been updated. Galley Kitchen features Oak Cabinetry & ceramic tile flooring, Bath with a jet tub. All the hardwood flooring has been professionally treated for scratching. Family room features commercial Wilson Art laminate flooring. Pella windows, sliding glass door to the patio, front door and back door (including storm doors). Furnace is equipped with a filtering system to control the air quality. Front steps and sidewalk replaced. Mud Room. Garage built in 2013. Nicely landscaped. This one is MOVE IN READY!
Key facts
- New furnace
- New water heater
- 7,405 sq ft lot
Tags
Property features AI
Exterior
- Parking: Detached garage with electricity and garage door opener (1.5 car)
- Utilities: Electricity connected (circuit breakers); Public water connected; Sewer connected; High-speed internet available; Cable available
- Home design: 2 stories; Existing construction
- Construction: Vinyl siding; Copper plumbing; Asphalt shingle roof; Block foundation; Built previously (existing)
- Exterior features: Blacktop driveway; Deck; Fully fenced yard; Rectangular residential lot; City street frontage
Interior
- Kitchen: Free-standing range; Oven; Dishwasher; Refrigerator; Disposal
- Bedrooms: Main-level bedroom (1)
- Flooring: Carpet; Ceramic tile; Hardwood; Laminate; Varies
- Bathrooms: 1 full bathroom (main level)
- Heating & cooling: Gas forced-air heating
- Interior features: Ceiling fan(s); Entrance foyer; Separate/formal living room; Living/dining room; Sliding glass door(s); Thermal windows; Sliding doors
- Laundry & utility: Washer; Dryer; Laundry in basement; Gas water heater
Neighborhood map
What this means for you Summary
Snapshot
- This is a 2-bed/1.0-bath single-family listed at $180k.
Deal economics
- At list price, monthly cash flow is $634 ($8k/yr) — positive.
- The deal already cash-flows at list — no discount required.
- Meets the 1% rule at list price ($3k rent vs $180k).
- Cap rate 10.5% vs local median 4.5% in Irondequoit — top-decile yield for the area; either an underpriced asset or a hidden risk that comps aren't pricing in. Stress-test before assuming the spread holds.
Location & tenants
- Location reads 81/100 on livability (#92 in NY, #1,414 nationally) — a professional / high-income tenant draw. Strengths: housing A+, health & safety A+, crime B+; Watch: amenities F.
- West Irondequoit Central School District (suburban): math 73% / reading 70% proficiency, ranked #126 of 590 in NY (top 21%) — strong family-tenant draw, lease renewals of 3-5y typical; only 18% free/reduced lunch — higher-income household profile.
- Zoned schools: Irondequoit High School (math 96% / reading 64%, grade A, #509 of 1,100 statewide, top 46%, 1,163 students, 33% FRL).
- Market conditions: 104 active listings in the ZIP; 3 comparable units currently listed for rent nearby; rentals leasing fast (median 4d on market — plan ~1-2 weeks tenant-placement turnaround); solid renter incomes; 1,169 units permitted in Monroe County in 2024 (591 in 5+ unit buildings).
- This rent runs 37% of the median local income ($90k/yr) — at the standard rent-burdened threshold; future hikes will face affordability resistance.
Forward outlook
- Local home prices are declining (-3.0%/yr); year-one equity from $1k of loan paydown is wiped out by about $5k of value loss. Plan a longer hold.
- Monroe County population projected to shrink 6% by 2050 — rents likely to lag national; underwrite the cash flow, not the appreciation.
- At projected returns (-3.0% appreciation + 3.0% rent growth), your $50k cash investment doubles in ~8 years — after that, you're playing with house money.
Negotiation context
- Only 6 days on market — expect competitive offers; lowballing is unlikely to land.
- 3 sale attempts since 11y ago with the ask held roughly flat each time — persistent listings suggest the price (not the market) is what's stuck; bring a comps-based counter.
- Current owner paid $84k; list at $180k implies a 113% gain — meaningful room to come down on a strong offer.
Risks & watch-outs
- Watch-outs: property tax is 3.8% of price; built in 1940 — expect roof / HVAC / electrical / plumbing capex.
Questions for the listing agent
- Built in 1940 — when were the roof, HVAC, electrical panel, plumbing, and water heater last replaced?
- Property tax is high relative to price — has the assessment been appealed recently, and will the sale trigger a re-assessment?
- Is there a deadline driving the sale (1031 exchange, divorce, estate, relocation)? That informs how much negotiation room exists.
- Schools are B-rated — typically a magnet for longer-tenancy family renters. What's the average tenant stay here, and is there a school-zone premium baked into asking?
- What's the average days-on-market for RENTAL listings here right now (not sales)? A rising rental-DOM trend means longer vacancies and softer asking-rent achievability than the comps imply.
- What's the recent tenant-quality profile in this submarket — average credit score on applications, eviction rate, late-payment / NSF rate, and stable-employment percentage? A property-management company in the area should have these aggregated.
- How much new for-sale + rental construction is in the pipeline within 1–3 miles? Heavy new supply typically softens prices + rents 12–24 months out; constrained supply supports both.
Investment metrics
- 1% rule
- 1.56% ✓
- Cap rate
- 10.52%
- Cash-on-cash
- 15.10%
- DSCR
- 1.67
- GRM
- 5.3
CMA / ARV
- ARV (on-the-fly)
- $272,296
- Comps found
- 12
Show comp detail 12 sales within ~0.75 mi
| Address | Dist | Beds/Ba | Sqft | Sold | Price | $/sf | Match |
|---|---|---|---|---|---|---|---|
| 62 Shorewood Dr | 0.14mi | 3/1.0 (+1) | 1,364 (+1%) | 5mo | $293,000 | $215 | 82 |
| 117 Shorewood Dr | 0.07mi | 3/1.0 (+1) | 1,395 (+4%) | 5mo | $260,000 | $186 | 82 |
| 539 Washington Ave | 0.24mi | 3/2.0 (+1) | 1,361 (+1%) | 1mo | $222,000 | $163 | 78 |
| 78 Ontario View St | 0.37mi | 3/1.0 (+1) | 1,394 (+3%) | 6mo | $185,000 | $133 | 67 |
| 46 Dewey Ave | 0.27mi | 3/2.5 (+1) | 1,443 (+7%) | 4mo | $280,000 | $194 | 62 |
| 173 Eaton Rd | 0.62mi | 3/1.5 (+1) | 1,332 (-1%) | 1mo | $302,000 | $227 | 62 |
| 79 Norcrest Dr | 0.43mi | 3/1.5 (+1) | 1,268 (-6%) | 2mo | $256,600 | $202 | 62 |
| 36 Madison Ter | 0.57mi | 2/1.5 | 1,282 (-5%) | 5mo | $385,000 | $300 | 59 |
| 4760 Saint Paul Blvd | 0.24mi | 2/1.5 | 1,164 (-14%) | 6mo | $220,000 | $189 | 59 |
| 439 Rock Beach Rd | 0.51mi | 2/1.0 | 1,168 (-13%) | 3mo | $303,010 | $259 | 51 |
| 549 Turtle Rock Ln | 0.59mi | 3/1.5 (+1) | 1,506 (+12%) | 0mo | $653,000 | $434 | 46 |
| 18 Centre Ter | 0.73mi | 3/1.0 (+1) | 1,476 (+10%) | 6mo | $232,000 | $157 | 40 |
Match score weights: distance 35% · size 25% · config 20% · recency 20%. Top-matched comps best support the ARV.
Projected returns pro-forma
-3.0% appreciation · 3.0% rent growth · sell at horizon
- IRR
- 5.9%
- Equity multiple
- 1.23×
- Total profit
- $11,479
- Equity at exit
- $26,824
- IRR
- 15.3%
- Equity multiple
- 2.25×
- Total profit
- $63,013
- Equity at exit
- $15,554
Cash invested: $50,372 (down + closing). Projections, not guarantees.
Landlord ↔ Tenant lean methodology
- Overall (STATE)
- 15 Strongly Tenant-Friendly
- State New York
- 15 Strongly Tenant-Friendly · D+10
- County
- — inherits STATE
- City
- — inherits STATE
ZIP-level market 14617
- Active inventory
- 104
- Price-to-rent
- 5.3×
Monthly cashflow live
- Estimated rent
- $2,807 medium interval (Pro) →
- Mortgage (P&I)
- −$943
- Tax from tax record
- −$565 /mo · $6,786/yr
- Insurance
- −$75
- HOA
- −$0
- Vacancy / Maint / Mgmt
- −$590
- Net cashflow
- $634
Break-even live
Sensitivity live
| Price | -10% $736 | -5% $685 | +0% $634 | +5% $583 | +10% $532 |
|---|---|---|---|---|---|
| Rent | -10% $412 | -5% $523 | +0% $634 | +5% $745 | +10% $856 |
| Rate | -1.0pp $725 | -0.5pp $680 | base $634 | +0.5pp $587 | +1.0pp $540 |
UW: 25.0% down · 7.5% · 30yr · 1.5% tax · 5.0% vac · 8.0% maint · 8.0% mgmt
Financing live
Cash to close
- Down payment
- $44,975
- Closing costs
- $5,397
- Reserves months
- —
- Total cash needed
- —
Loan-product check · same deal, 3 products live
Conventional
25% down · 7.5% · 30yr
- Down + closing
- —
- Monthly P&I
- —
- Monthly cashflow
- —
- DSCR
- —
- Eligible?
- —
Personal DTI + credit; lowest rate.
DSCR
20% down · 8.5% · 30yr
- Down + closing
- —
- Monthly P&I
- —
- Monthly cashflow
- —
- DSCR
- —
- Eligible?
- —
No personal income docs; deal must DSCR.
Hard money
10% down · 12.0% · 12mo
- Down + closing
- —
- Monthly P&I
- —
- Monthly cashflow
- —
- DSCR
- —
- Eligible?
- —
Short-term bridge; refi at stabilization.
Rent comps 3 comps
| Address | Beds | Baths | Sqft | Rent | $/sqft | DOM | Units | Dist |
|---|---|---|---|---|---|---|---|---|
| 485 Oakridge Dr Rochester, NY | 3.0 | 1.5 | 1826 | $4,000 | $2.19 | 4d | 1 | 0.56mi |
| 4302 Lake Ave Unit 1 Rochester, NY | 3.0 | 1.5 | 1600 | $3,000 | $1.88 | 45d | 1 | 1.13mi |
| 123 Spanish Trl Rochester, NY | 1.0–2.0 | 1.0–1.5 | 945 | $1,775 | $1.88 | 4d | 1 | 1.46mi |
Listing history 6 events
-
2026-06-10status $179,900 Pending 6 DOM
-
2026-06-09days on market $179,900 Active 6 DOM
-
2026-06-09days on market $179,900 Active 5 DOM
-
2026-06-07days on market $179,900 Active 4 DOM
-
2026-06-03remarks 671-char remark
-
2026-06-03$179,900 Active 1 DOM
ⓘ Source: listings_history table (triggers on properties + properties_extension) + one-shot
backfill from property_details.listing_events for pre-trigger history.
Tax reassessment forecast NY · Partial reset (capped growth)
- Current annual tax
- $6,786 · $565/mo
- Projected year-2 tax
- $6,786 · $565/mo
- Expected delta
- $0/yr ($0/mo · 0.0%)
ⓘ Screening estimate from a state-policy table — verify with the county assessor before closing.
Climate risk First Street
- Flood 1/10 Low FEMA zone X (unshaded) · 0% chance over 30 yrs
- Wildfire 3/10 Moderate
- Heat 2/10 Low 7 d/yr ≥95°F today · 15 d/yr by 30 yrs out
- Wind 1/10 Low
- Air quality 2/10 Low 1 unhealthy d/yr today · 2 by 30 yrs out
Nearby sold comps map
Loading sold comps map…
Walkable amenities ~0.75 mi
Loading nearby amenities…
Taxation est. · year 1
- Rental income
- $33,689
- − Mortgage interest
- −$10,077
- − Property taxes
- −$6,786
- − Insurance
- −$900
- − Repairs & maintenance
- −$2,695
- − Management
- −$2,695
- − Depreciation
- −$5,233
- Taxable income
- $5,303
- Est. tax owed @ 24.0%
- −$1,273
- After-tax cash flow
- $6,335/yr
For passive investors: Depreciation is non-cash, so a rental often shows a tax loss while cash-flowing — sheltering income. Rental losses are passive: they offset passive income freely, and up to $25,000/yr can offset ordinary (W-2) income if you actively participate and your MAGI is under $100k (phasing out to $0 by $150k); unused losses carry forward. On sale, claimed depreciation is recaptured at up to 25%, and gains may owe capital-gains tax (a 1031 exchange can defer both). Figures are a year-1 estimate at your 24.0% rate — not tax advice; consult a CPA.
Schools (NCES district)
- District
- West Irondequoit Central School District
- NCES district ID
- 3615390
- Math proficiency
- 73% ▲ 3.00%
- Reading proficiency
- 70% ▲ 5.00%
- Median HH income
- $60,218
- Composite
- 61.61/100
- National rank
- #748
- State rank
- #126 of 590 in NY
Livability — Irondequoit
- Score
- 81/100
- State rank
- #92
- US rank
- #1414
Category grades
Schools grade is shown separately in the Schools card above.
Census & demographics
- Census place
- Irondequoit, NY
- County
- Monroe County · 674,131 people
- City population
- 74,252
- Metro
- Rochester, NY
- Population (ZIP)
- 21,788
- Household income
- $90,192
- Rent vs Own
- Severe rent burden
- 426.0
Population outlook (Monroe County) Hauer SSP2
- Today (2025)
- 759,460 people
- By 2030
- 757,154 · -0.3%
- By 2040
- 740,644 · -2.5%
- By 2050
- 714,443 · -5.9%
- By 2075
- 645,883 · -15.0%
- By 2100
- 547,084 · -28.0%
Race, ethnicity, and origin ACS 2023
- Neighborhood character
- Predominantly White (85%)
- Race & ethnicity
- White 85% Hispanic / Latino 8% Two or more races 6% Black 4%
- Hispanic origin (detail)
- Puerto Rican 4%
- Common ancestry
- Romanian 6% Iranian 3% Lithuanian 3%
- Foreign-born
- 4% · Canada
- Languages at home
- 93% English-only · Spanish 4% Other Indo-European 1% Russian/Polish/Slavic 1%
Political lean MEDSL · Monroe
- 2024 margin
- D (+19.1) · D 59.5% · R 40.5%
- 2008→2024 swing
- +1.4pp toward D · 2008: 17.7pp · 2024: 19.1pp
- All cycles
- 2024: D+19.1 2020: D+21.0 2016: D+14.1 2012: D+17.4 2008: D+17.7
Not yet ingested
- Civics
- —
Market trends
- HPI YoY
- ▼ -148.22%
- Current HPI
- 263.9973
- Rent YoY
- —
- Metro
- Rochester, NY
- State GDP YoY
- ▲ 2.60%
- F500 in state
- 92
Industry mix (Fortune 500 HQ in NY)
| Industry | F500 HQs | Revenue |
|---|---|---|
| Financial Services | 10 | $950B |
|
||
| Consumer Goods | 9 | $162B |
|
||
| Insurance | 4 | $225B |
|
||
| Telecommunications | 2 | $144B |
|
||
| Pharmaceuticals | 2 | $112B |
|
||
| Media / Entertainment | 2 | $69B |
|
||
Price history
+132.1% since first listed9 events — show timeline
- 2026-06-03 Listed $179,900 UNYREIS
- 2022-10-28 Listing Removed — UNYREIS
- 2022-10-27 Listed $139,900 UNYREIS
- 2015-08-11 Sold (Public Records) $84,500 Public Records
- 2015-08-11 Sold (Public Records) $84,500 Public Records
- 2015-08-10 Sold (MLS) $84,500 UNYREIS
- 2015-05-21 Pending — UNYREIS
- 2015-05-13 Listed $89,900 UNYREIS
- 2001-06-15 Sold (Public Records) $77,500 Public Records
Property tax history
+5.3%/yrLatest (2025): $6,786 · +4.3% YoY. Source: county tax records.
Cash-flow waterfall
monthlySold comps — $/sqft
last 12 mo · ≤1 miLoading sold comps…