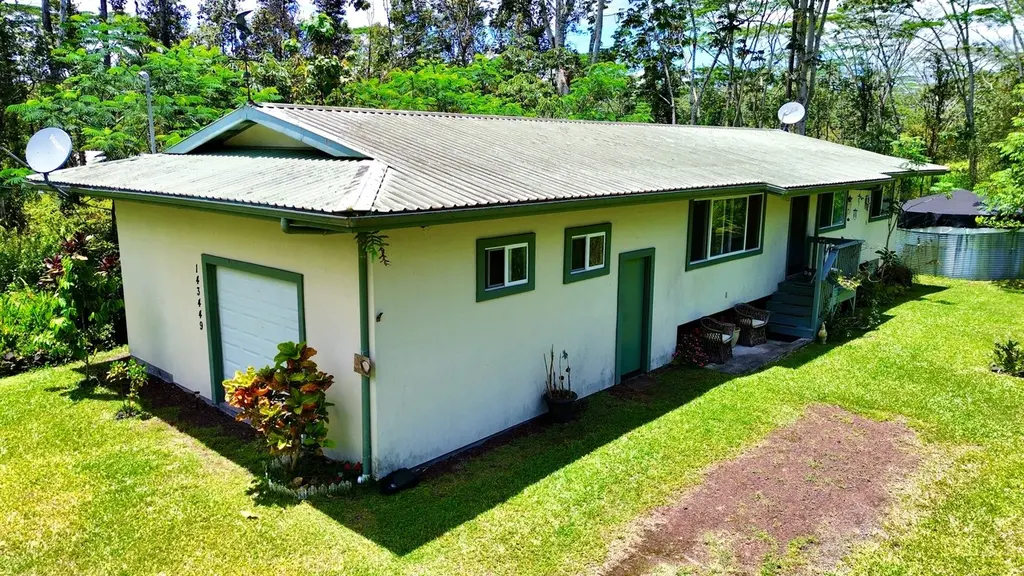
14-3449 Mauna Kea Rd · Nanawale Estates, HI
Flood risk 1/10 · Minimal
- FEMA flood zone
- X (unshaded)
- Chance of flooding over 30 yrs
- 0.0%
- Est. flood insurance / yr
- $507 – $1,088
Fire risk No data
- Est. fire insurance / yr
- —
Heat risk No data
- Hot days now (above threshold)
- —
- Hot days in 30 yrs
- —
Wind risk No data
- Chance of severe wind over 30 yrs
- —
Air-quality risk 1/10 · Minimal
- Unhealthy air days now
- —
- Unhealthy air days in 30 yrs
- —
Risk factors via First Street. Map © Google.
Why this score? — see what drove the D grade
The composite is a weighted blend of 9 inputs, each scored 0–100. Each bar is that input's sub-score; the figure is the points it added to the 100-point composite (weight × sub-score).
- Cash flow +13.5/30.0
- ARV discount +8.6/15.0
- DSCR +4.1/10.0
- 1% rule +3.9/10.0
- Schools +3.7/10.0
- Livability +3.1/5.0
- Condition / age +2.8/5.0
- Rent growth +2.5/5.0
- Appreciation +0.0/10.0
$203,000
🖨 Deal sheet (PDF) 📄 Offer letter ✓ Due diligence
Listing remarks
Fully permitted 3-bedroom home offering 1,122 sq ft of comfortable island living in the growing Nanawale Estates subdivision. This well-designed layout includes 2 full bathrooms plus a third bathroom that is already plumbed and ready for fixtures—offering a great opportunity to customize and add value. Ideal for extended living, guests, or rental potential. The home features a functional floor plan with ample natural light and a welcoming interior ready for your personal touch. An oversized carport has been enclosed, creating additional usable space; however, this enclosure was completed without permits and is not reflected in the official square footage. Buyers to conduct their own d
Key facts
- Puna coastline
- Shopping dining
- 9,000 sq ft lot
Tags
Property features AI
Finance
- HOA & community: Association fee approximately $10.33
Exterior
- Parking: Attached garage (396 sq ft)
- Utilities: Catchment water; Septic tank sewer; Electricity available; Phone available; Cable internet; No solid waste disposal listed
- Home design: Fee simple ownership; Located in Lava Zone 2; Zoned A-1A
- Exterior features: Fairly level, grassy lot; Road/street frontage; Graded roads
Interior
- Kitchen: Range; Refrigerator
- Bathrooms: 3 bathrooms (all full)
- Heating & cooling: Electric water heater
- Interior features: Unpermitted improvements present
- Laundry & utility: Washer; Dryer
Neighborhood map
What this means for you Summary
Snapshot
- This is a 3-bed/3.0-bath single-family listed at $203k. Condition is rated average.
Deal economics
- At list price, monthly cash flow is $9 ($109/yr) — positive.
- The deal already cash-flows at list — no discount required.
- To meet the 1% rule (rent ≥ 1% of price), the offer needs to be $180k (11.3% below list).
- Recommended offer: $180k (11.3% below list) — sets the bar for 1% rule.
Location & tenants
- Location reads 61/100 on livability (#78 in HI) — a middle-class / working-renter tenant base. Strengths: crime A+, housing B; Watch: employment C-, health & safety C-, amenities F.
- Hawaii Department Of Education (suburban): math 32% / reading 50% proficiency, ranked #1 of 1 in HI (top 100%) — families likely to look elsewhere, expect single-tenant / working-renter base with shorter leases.
- Zoned schools: Keonepoko Elementary School (math 8% / reading 24%, grade F, #169 of 183 statewide, top 93%, 562 students, 75% FRL); Pahoa High & Intermediate School (math 17% / reading 42%, grade F, #35 of 43 statewide, top 86%, 723 students, 74% FRL) — zoned schools average 75% FRL vs 39% district-wide (36 pts higher); higher-poverty schools than district average — tighter screening recommended.
- Zoned-school proficiency averages 23% at this address vs 41% district-wide (-18 pts) — the specific schools serving this property underperform the Hawaii Department Of Education average; the district grade overstates school quality for this exact location.
- Market conditions: 388 active listings in the ZIP; 1 comparable units currently listed for rent nearby; 982 units permitted in Hawaii County in 2024 (0 in 5+ unit buildings).
Forward outlook
- Local home prices are declining (-3.0%/yr); year-one equity from $1k of loan paydown is wiped out by about $6k of value loss. Plan a longer hold.
- Hawaii County population projected at +24% by 2050 — long-run rental-demand tailwind backs the buy-and-hold thesis.
Negotiation context
- It's been on market 52 days — a 3% lower offer ($197k) is reasonable based on typical stale-listing flexibility.
- 2 sale attempts; this cycle's ask has dropped $26k (11%) from the opening price — seller is motivated, your offer sets the floor, not the list.
Questions for the listing agent
- It's been on market 52 days. Have you received any prior offers? Is the seller open to a 11% concession, seller financing, or rate buy-down credit?
- What does the HOA fee cover, when was the last increase, and are there any pending special assessments or reserve-fund shortfalls?
- Is there a deadline driving the sale (1031 exchange, divorce, estate, relocation)? That informs how much negotiation room exists.
- Schools are F-rated, which usually means shorter tenancies and higher turnover. Who's the typical renter profile here, and what's been the actual vacancy rate?
- The area grade is low — what's the realistic commute time and amenity access for the typical tenant pool here? Any planned neighborhood developments (good or bad) we should know about?
- What's the average days-on-market for RENTAL listings here right now (not sales)? A rising rental-DOM trend means longer vacancies and softer asking-rent achievability than the comps imply.
- What's the recent tenant-quality profile in this submarket — average credit score on applications, eviction rate, late-payment / NSF rate, and stable-employment percentage? A property-management company in the area should have these aggregated.
- How much new for-sale + rental construction is in the pipeline within 1–3 miles? Heavy new supply typically softens prices + rents 12–24 months out; constrained supply supports both.
Investment metrics
- 1% rule
- 0.89% ✗
- Cap rate
- 6.35%
- Cash-on-cash
- 0.19%
- DSCR
- 1.01
- GRM
- 9.4
CMA / ARV
- ARV (median comp)
- $207,968
- List price
- $203,000
- Delta
- -2.39%
- Verdict
- FAIR
- Comps
- 4 within 1.0 mi
Projected returns pro-forma
-3.0% appreciation · 3.0% rent growth · sell at horizon
- IRR
- -16.0%
- Equity multiple
- 0.43×
- Total profit
- $-32,281
- Equity at exit
- $30,268
- IRR
- -7.6%
- Equity multiple
- 0.52×
- Total profit
- $-27,227
- Equity at exit
- $17,552
Cash invested: $56,840 (down + closing). Projections, not guarantees.
Landlord ↔ Tenant lean methodology
- Overall (STATE)
- 37 Tenant-Leaning
- State Hawaii
- 37 Tenant-Leaning · D+13
- County
- — inherits STATE
- City
- — inherits STATE
ZIP-level market 96778
- Home prices YoY
- -15.3%
- Active inventory
- 388
- Price-to-rent
- 9.4×
Monthly cashflow live
- Estimated rent
- $1,800 medium interval (Pro) →
- Mortgage (P&I)
- −$1,065
- Tax est. 1.5%
- −$254 /mo · $3,045/yr
- Insurance
- −$85
- HOA
- −$10
- Vacancy / Maint / Mgmt
- −$378
- Net cashflow
- $9
Break-even live
Sensitivity live
| Price | -10% $149 | -5% $79 | +0% $9 | +5% $-61 | +10% $-131 |
|---|---|---|---|---|---|
| Rent | -10% $-133 | -5% $-62 | +0% $9 | +5% $80 | +10% $151 |
| Rate | -1.0pp $111 | -0.5pp $61 | base $9 | +0.5pp $-43 | +1.0pp $-97 |
UW: 25.0% down · 7.5% · 30yr · 1.5% tax · 5.0% vac · 8.0% maint · 8.0% mgmt
Financing live
Cash to close
- Down payment
- $50,750
- Closing costs
- $6,090
- Reserves months
- —
- Total cash needed
- —
Loan-product check · same deal, 3 products live
Conventional
25% down · 7.5% · 30yr
- Down + closing
- —
- Monthly P&I
- —
- Monthly cashflow
- —
- DSCR
- —
- Eligible?
- —
Personal DTI + credit; lowest rate.
DSCR
20% down · 8.5% · 30yr
- Down + closing
- —
- Monthly P&I
- —
- Monthly cashflow
- —
- DSCR
- —
- Eligible?
- —
No personal income docs; deal must DSCR.
Hard money
10% down · 12.0% · 12mo
- Down + closing
- —
- Monthly P&I
- —
- Monthly cashflow
- —
- DSCR
- —
- Eligible?
- —
Short-term bridge; refi at stabilization.
Rent comps 1 comps
| Address | Beds | Baths | Sqft | Rent | $/sqft | DOM | Units | Dist |
|---|---|---|---|---|---|---|---|---|
| 14-610 Kapoho Cir Pahoa, HI | 2.0 | 1.0 | 1210 | $1,800 | $1.49 | 45d | 1 | 0.21mi |
HOA detail
- Monthly dues
- $10 · $120/yr
Listing history 19 events
-
2026-06-21statusdays on market $203,000 Active Under Contract 52 DOM
-
2026-06-18days on market $203,000 Active 49 DOM
-
2026-06-17days on market $203,000 Active 48 DOM
-
2026-06-16days on market $203,000 Active 47 DOM
-
2026-06-15days on market $203,000 Active 46 DOM
-
2026-06-13days on market $203,000 Active 44 DOM
-
2026-06-13days on market $203,000 Active 43 DOM
-
2026-06-10days on market $203,000 Active 41 DOM
-
2026-06-09days on market $203,000 Active 40 DOM
-
2026-06-08days on market $203,000 Active 39 DOM
-
2026-06-07days on market $203,000 Active 38 DOM
-
2026-06-05days on market $203,000 Active 35 DOM
-
2026-06-03days on market $203,000 Active 34 DOM
-
2026-06-02days on market $203,000 Active 33 DOM
-
2026-06-01days on market $203,000 Active 32 DOM
-
2026-05-31days on market $203,000 Active 31 DOM
-
2026-04-09$229,000 Active 959-char remark
-
2025-10-03historical
-
2025-04-17$279,000 Active
ⓘ Source: listings_history table (triggers on properties + properties_extension) + one-shot
backfill from property_details.listing_events for pre-trigger history.
Climate risk First Street
- Flood 1/10 Low FEMA zone X (unshaded) · 0% chance over 30 yrs
- Air quality 1/10 Low
Nearby sold comps map
Loading sold comps map…
Walkable amenities ~0.75 mi
Loading nearby amenities…
Taxation est. · year 1
- Rental income
- $21,600
- − Mortgage interest
- −$11,371
- − Property taxes
- −$3,045
- − Insurance
- −$1,015
- − Repairs & maintenance
- −$1,728
- − Management
- −$1,728
- − HOA
- −$120
- − Depreciation
- −$5,905
- Taxable loss
- −$3,313
- Est. tax savings @ 24.0%
- +$795
- After-tax cash flow
- $904/yr
For passive investors: Depreciation is non-cash, so a rental often shows a tax loss while cash-flowing — sheltering income. Rental losses are passive: they offset passive income freely, and up to $25,000/yr can offset ordinary (W-2) income if you actively participate and your MAGI is under $100k (phasing out to $0 by $150k); unused losses carry forward. On sale, claimed depreciation is recaptured at up to 25%, and gains may owe capital-gains tax (a 1031 exchange can defer both). Figures are a year-1 estimate at your 24.0% rate — not tax advice; consult a CPA.
Condition & rehab AI · 13 photos
The home is in average condition with cosmetic repairs and maintenance needed. Upgrades to paint, landscaping, and appliances can significantly enhance its resale and rental value.
Repairs flagged
- Minor Paint — Paint on exterior and interior walls shows signs of wear.
- Minor Landscaping — Overgrown landscaping and lack of recent maintenance are visible.
Value-add opportunities
- Both Paint exterior and interior walls — Fresh paint can improve curb appeal and interior aesthetics.
- Both Landscaping and yard maintenance — A well-maintained yard can enhance curb appeal and property value.
- Resale Replace outdated appliances — Modern appliances can attract more buyers and renters.
- Resale Update bathrooms with new fixtures and finishes — Fresh bathrooms can significantly boost the home's appeal and value.
- Both HVAC system maintenance or replacement — A functional HVAC system is essential for comfort and can improve energy efficiency and property value.
Renovation cost estimate screening
| Repair item | Severity | Est. cost |
|---|---|---|
| Paint · Paint on exterior and interior walls shows signs of wear. | Minor | $500–3,000 |
| Landscaping · Overgrown landscaping and lack of recent maintenance are visible. | Minor | $500–3,000 |
| Total estimated repair cost · 2 items | $1,000–6,000 |
Value-add ROI direction
- Both Paint exterior and interior walls — Fresh paint can improve curb appeal and interior aesthetics. ↑
- Both Landscaping and yard maintenance — A well-maintained yard can enhance curb appeal and property value. ↑
- Resale Replace outdated appliances — Modern appliances can attract more buyers and renters. ↑
- Resale Update bathrooms with new fixtures and finishes — Fresh bathrooms can significantly boost the home's appeal and value. ↑
- Both HVAC system maintenance or replacement — A functional HVAC system is essential for comfort and can improve energy efficiency and property value. ↑
ⓘ Cost ranges are severity-bucket heuristics (US national rule-of-thumb). Get contractor quotes + a written scope before underwriting a rehab budget.
Schools (NCES district)
- District
- Hawaii Department Of Education
- NCES district ID
- 1500030
- Math proficiency
- 32% ▼ -10.00%
- Reading proficiency
- 50% ▼ -3.00%
- Median HH income
- $69,005
- Composite
- 37.07/100
- National rank
- #4504
- State rank
- #1 of 1 in HI
Livability — Nanawale Estates
- Score
- 61/100
- State rank
- #78
- US rank
- #17834
Category grades
Schools grade is shown separately in the Schools card above.
Census & demographics
- Census place
- Nanawale Estates, HI
- Population (ZIP)
- 14,225
Population outlook (Hawaii County) Hauer SSP2
- Today (2025)
- 220,733 people
- By 2030
- 232,156 · +5.2%
- By 2040
- 252,486 · +14.4%
- By 2050
- 272,703 · +23.5%
- By 2075
- 332,113 · +50.5%
- By 2100
- 398,342 · +80.5%
Race, ethnicity, and origin ACS 2023
- Neighborhood character
- Highly diverse neighborhood (Simpson 0.82)
- Race & ethnicity
- White 37% Two or more races 30% Hispanic / Latino 15% Pacific Islander 15% Asian 12%
- Hispanic origin (detail)
- Mexican 4% Puerto Rican 9%
- Common ancestry
- Russian 7% Italian 3% Romanian 3%
- Foreign-born
- 12% · Canada, Vietnam
- Languages at home
- 77% English-only · Other Asian/Pacific 11% Tagalog/Filipino 1% Russian/Polish/Slavic 1%
Political lean MEDSL · Hawaii
- 2024 margin
- Strong D (+28.3) · D 63.0% · R 34.7% · Other 2.3%
- 2008→2024 swing
- -25.4pp toward R · 2008: 53.7pp · 2024: 28.3pp
- All cycles
- 2024: D+28.3 2020: D+36.2 2016: D+36.6 2012: D+51.3 2008: D+53.7
Not yet ingested
- Civics
- —
Market trends
- HPI YoY
- ▼ -31.52%
- Current HPI
- 173.8168
- Rent YoY
- —
- Metro
- —
- State GDP YoY
- —
- F500 in state
- 0
Price history
-27.2% since first listed4 events — show timeline
- 2026-05-21 Price Changed $203,000 HI Information Service
- 2026-04-09 Listed $229,000 HI Information Service
- 2025-10-03 Listing Removed — HI Information Service
- 2025-04-17 Listed $279,000 HI Information Service
Cash-flow waterfall
monthlySold comps — $/sqft
last 12 mo · ≤1 miLoading sold comps…