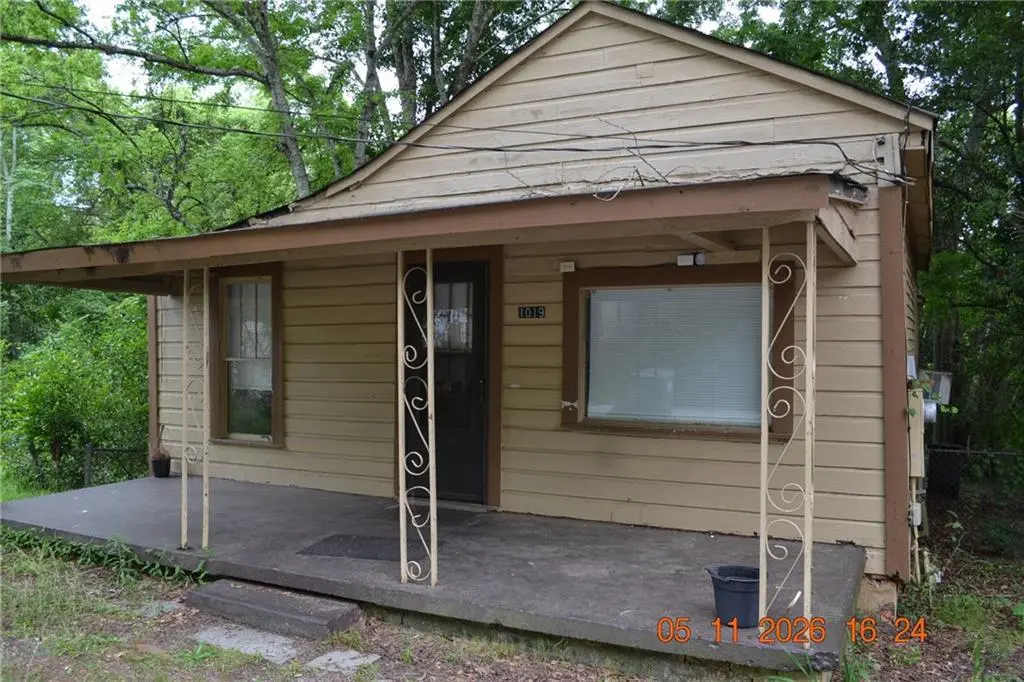
1019 21st St · Phenix City, AL
Flood risk 1/10 · Minimal
- FEMA flood zone
- X (unshaded)
- Chance of flooding over 30 yrs
- 0.0%
- Est. flood insurance / yr
- $507 – $1,088
Fire risk 1/10 · Minimal
- Est. fire insurance / yr
- $916 – $1,700
Heat risk 7/10 · Major
- Hot days now (above 107°F)
- 7 days/yr
- Hot days in 30 yrs
- 18 days/yr
Wind risk 6/10 · Moderate
- Chance of severe wind over 30 yrs
- 76.0%
Air-quality risk 5/10 · Moderate
- Unhealthy air days now
- 7 days/yr
- Unhealthy air days in 30 yrs
- 8 days/yr
Risk factors via First Street. Map © Google.
Why this score? — see what drove the B- grade
The composite is a weighted blend of 9 inputs, each scored 0–100. Each bar is that input's sub-score; the figure is the points it added to the 100-point composite (weight × sub-score).
- Cash flow +30.0/30.0
- 1% rule +10.0/10.0
- DSCR +10.0/10.0
- ARV discount +7.5/15.0
- Rent growth +3.8/5.0
- Livability +3.0/5.0
- Schools +2.7/10.0
- Condition / age +2.5/5.0
- Appreciation +0.0/10.0
$36,500
🖨 Deal sheet 📄 Offer letter ✓ Due diligence
Listing remarks
ROOF 3 YEARS OLD! LVP AND VINYL FLOORING, PORCH, FIXER UPPER
Key facts
- Roof 3 years old
- Porch
- 3,920 sq ft lot
Tags
Property features AI
Exterior
- Parking: Driveway with 2 parking spaces
- Utilities: Public water; Public sewer; Electricity available; Natural gas available; Cable available
- Home design: Single-family residence; One story; Fixer condition; No common walls
- Construction: Frame and vinyl siding construction; Composition/shingle roof; Crawl space foundation; Built with approximately 960 square feet
- Exterior features: Front porch; Back yard fencing; Level yard; Has a view
Interior
- Kitchen: Dishwasher; Electric range; Refrigerator
- Bedrooms: 2 main-level bedrooms
- Flooring: Vinyl flooring; Other flooring
- Bathrooms: 1 full bathroom on the main level
- Heating & cooling: Space heater; Window unit(s) for cooling
- Interior features: Private entrance; Wood window frames; Other interior features
- Laundry & utility: Laundry area (other)
Neighborhood map
What this means for you Summary
Snapshot
- This is a 2-bed/1.0-bath single-family listed at $36k.
Deal economics
- At list price, monthly cash flow is $789 ($9k/yr) — positive.
- The deal already cash-flows at list — no discount required.
- Meets the 1% rule at list price ($1k rent vs $36k).
- Cap rate 32.2% vs local median 5.0% in Phenix City — top-decile yield for the area; either an underpriced asset or a hidden risk that comps aren't pricing in. Stress-test before assuming the spread holds.
Location & tenants
- Location reads 60/100 on livability (#297 in AL) — a middle-class / working-renter tenant base. Strengths: cost of living A+, housing A+; Watch: schools D+, crime F, amenities F.
- Phenix City (suburban): math 22% / reading 44% proficiency, ranked #59 of 129 in AL (top 46%) — families likely to look elsewhere, expect single-tenant / working-renter base with shorter leases; 64% free/reduced lunch — lower-income household profile, screen leases tightly.
- Market conditions: Rents rising fast (+5.3%/yr); 217 active listings in the ZIP; 3 comparable units currently listed for rent nearby; rentals at typical pace (median 21d on market — plan ~3-4 weeks tenant-placement turnaround); 183 units permitted in Russell County in 2024 (0 in 5+ unit buildings).
- This rent runs 32% of the median local income ($48k/yr) — at the standard rent-burdened threshold; future hikes will face affordability resistance.
Forward outlook
- Local home prices are declining (-3.0%/yr); year-one equity from $252 of loan paydown is wiped out by about $1k of value loss. Plan a longer hold.
- Russell County population projected at +42% by 2050 — long-run rental-demand tailwind backs the buy-and-hold thesis.
- At projected returns (-3.0% appreciation + 5.3% rent growth), your $10k cash investment doubles in ~2 years — after that, you're playing with house money.
Negotiation context
- Only 4 days on market — expect competitive offers; lowballing is unlikely to land.
Risks & watch-outs
- Watch-outs: built in 1924 — expect roof / HVAC / electrical / plumbing capex.
- Climate carrying-cost: major wind risk, 76% chance of damaging wind over 30y; extreme-heat days projected 7→18/yr by 2055 (HVAC capex compounding) — expect insurance premiums to compound above CPI over the hold.
Questions for the listing agent
- Built in 1924 — when were the roof, HVAC, electrical panel, plumbing, and water heater last replaced?
- Is there a deadline driving the sale (1031 exchange, divorce, estate, relocation)? That informs how much negotiation room exists.
- Schools are D-rated, which usually means shorter tenancies and higher turnover. Who's the typical renter profile here, and what's been the actual vacancy rate?
- Crime grade is F in this area — have there been break-ins, vandalism, or insurance claims at this property in the last 3 years? What carrier currently insures it and at what premium?
- What's the average days-on-market for RENTAL listings here right now (not sales)? A rising rental-DOM trend means longer vacancies and softer asking-rent achievability than the comps imply.
- What's the recent tenant-quality profile in this submarket — average credit score on applications, eviction rate, late-payment / NSF rate, and stable-employment percentage? A property-management company in the area should have these aggregated.
- How much new for-sale + rental construction is in the pipeline within 1–3 miles? Heavy new supply typically softens prices + rents 12–24 months out; constrained supply supports both.
Investment metrics
- 1% rule
- 3.53% ✓
- Cap rate
- 32.22%
- Cash-on-cash
- 92.59%
- DSCR
- 5.12
- GRM
- 2.4
CMA / ARV
- ARV (on-the-fly)
- $81,600
- Comps found
- 12
Show comp detail 12 sales within ~0.75 mi
| Address | Dist | Beds/Ba | Sqft | Sold | Price | $/sf | Match |
|---|---|---|---|---|---|---|---|
| 804 N Railroad St St | 0.31mi | 2/2.0 | 938 (-2%) | 3mo | $64,000 | $68 | 76 |
| 1208 20th st St | 0.19mi | 3/1.0 (+1) | 1,040 (+8%) | 3mo | $50,800 | $49 | 70 |
| 2002 6th Ave | 0.45mi | 2/1.0 | 1,024 (+7%) | 2mo | $32,500 | $32 | 66 |
| 1704 18th St | 0.61mi | 3/1.0 (+1) | 980 (+2%) | 3mo | $100,000 | $102 | 61 |
| 1506 14th Ct | 0.45mi | 3/1.0 (+1) | 916 (-5%) | 9mo | $63,000 | $69 | 59 |
| 1804 16th Pl | 0.73mi | 2/1.0 | 910 (-5%) | 2mo | $125,000 | $137 | 55 |
| 2103 14th Ct | 0.32mi | 2/1.0 | 825 (-14%) | 8mo | $70,000 | $85 | 55 |
| 215 23rd St St | 0.61mi | 2/1.0 | 877 (-9%) | 5mo | $100,000 | $114 | 53 |
| 1514 10th Ave | 0.32mi | 2/1.0 | 816 (-15%) | 10mo | $23,000 | $28 | 52 |
| 604 20th St | 0.40mi | 3/1.0 (+1) | 1,094 (+14%) | 9mo | $58,000 | $53 | 46 |
| 1309 12th Pl | 0.74mi | 2/1.0 | 1,086 (+13%) | 1mo | $114,000 | $105 | 43 |
| 1702 23rd Pl | 0.67mi | 3/2.0 (+1) | 1,100 (+15%) | 1mo | $165,000 | $150 | 34 |
Match score weights: distance 35% · size 25% · config 20% · recency 20%. Top-matched comps best support the ARV.
Projected returns pro-forma
-3.0% appreciation · 5.33% rent growth · sell at horizon
- IRR
- 95.9%
- Equity multiple
- 5.64×
- Total profit
- $47,403
- Equity at exit
- $5,442
- IRR
- 99.1%
- Equity multiple
- 12.67×
- Total profit
- $119,259
- Equity at exit
- $3,156
Cash invested: $10,220 (down + closing). Projections, not guarantees.
Landlord ↔ Tenant lean methodology
- Overall (STATE)
- 90 Strongly Landlord-Friendly
- State Alabama
- 90 Strongly Landlord-Friendly · R+15
- County
- — inherits STATE
- City
- — inherits STATE
ZIP-level market 36867
- Home prices YoY
- -30.1%
- Rents YoY
- 5.3%
- Active inventory
- 217
- Price-to-rent
- 2.4×
Monthly cashflow live
- Estimated rent
- $1,287 medium interval (Pro) →
- Mortgage (P&I)
- −$191
- Tax from tax record
- −$22 /mo · $258/yr
- Insurance
- −$15
- HOA
- −$0
- Vacancy / Maint / Mgmt
- −$270
- Net cashflow
- $789
Break-even live
UW: 25.0% down · 7.5% · 30yr · 1.5% tax · 5.0% vac · 8.0% maint · 8.0% mgmt
Financing live
Cash to close
- Down payment
- $9,125
- Closing costs
- $1,095
- Reserves months
- —
- Total cash needed
- —
Loan-product check · same deal, 3 products live
Conventional
25% down · 7.5% · 30yr
- Down + closing
- —
- Monthly P&I
- —
- Monthly cashflow
- —
- DSCR
- —
- Eligible?
- —
Personal DTI + credit; lowest rate.
DSCR
20% down · 8.5% · 30yr
- Down + closing
- —
- Monthly P&I
- —
- Monthly cashflow
- —
- DSCR
- —
- Eligible?
- —
No personal income docs; deal must DSCR.
Hard money
10% down · 12.0% · 12mo
- Down + closing
- —
- Monthly P&I
- —
- Monthly cashflow
- —
- DSCR
- —
- Eligible?
- —
Short-term bridge; refi at stabilization.
Rent comps 3 comps
| Address | Beds | Baths | Sqft | Rent | $/sqft | DOM | Units | Dist |
|---|---|---|---|---|---|---|---|---|
| 2108 9th Ave Phenix City, AL | 3.0 | 1.0 | 1040 | $1,150 | $1.11 | 21d | 1 | 0.26mi |
| 2702 N Railroad St Phenix City, AL | 2.0 | 1.0 | 768 | $1,200 | $1.56 | 21d | 1 | 1.22mi |
| 1106 Broadway Unit 1106C Columbus, GA | 1.0 | 1.0 | 930 | $1,600 | $1.72 | 13d | 1 | 1.26mi |
Listing history 2 events
-
2026-05-15status Pending
-
2026-05-11$36,500 Active
ⓘ Source: listings_history table (triggers on properties + properties_extension) + one-shot
backfill from property_details.listing_events for pre-trigger history.
Tax reassessment forecast AL · Resets to sale price
- Current annual tax
- $258 · $22/mo
- Projected year-2 tax
- $258 · $22/mo
- Expected delta
- $0/yr ($0/mo · 0.0%)
ⓘ Screening estimate from a state-policy table — verify with the county assessor before closing.
Climate risk First Street
- Flood 1/10 Low FEMA zone X (unshaded) · 0% chance over 30 yrs
- Wildfire 1/10 Low
- Heat 7/10 Severe 7 d/yr ≥107°F today · 18 d/yr by 30 yrs out
- Wind 6/10 Major 76% chance of damaging wind over 30 yrs
- Air quality 5/10 Major 7 unhealthy d/yr today · 8 by 30 yrs out
Nearby sold comps map
Loading sold comps map…
Walkable amenities ~0.75 mi
Loading nearby amenities…
Taxation est. · year 1
- Rental income
- $15,444
- − Mortgage interest
- −$2,045
- − Property taxes
- −$258
- − Insurance
- −$182
- − Repairs & maintenance
- −$1,236
- − Management
- −$1,236
- − Depreciation
- −$1,062
- Taxable income
- $9,426
- Est. tax owed @ 24.0%
- −$2,262
- After-tax cash flow
- $7,201/yr
For passive investors: Depreciation is non-cash, so a rental often shows a tax loss while cash-flowing — sheltering income. Rental losses are passive: they offset passive income freely, and up to $25,000/yr can offset ordinary (W-2) income if you actively participate and your MAGI is under $100k (phasing out to $0 by $150k); unused losses carry forward. On sale, claimed depreciation is recaptured at up to 25%, and gains may owe capital-gains tax (a 1031 exchange can defer both). Figures are a year-1 estimate at your 24.0% rate — not tax advice; consult a CPA.
Schools (NCES district)
- District
- Phenix City
- NCES district ID
- 0102700
- Math proficiency
- 22% ▼ -24.00%
- Reading proficiency
- 44% ▼ -1.00%
- Median HH income
- $36,228
- Composite
- 27.29/100
- National rank
- #7001
- State rank
- #59 of 129 in AL
Livability — Phenix City
- Score
- 60/100
- State rank
- #297
- US rank
- #19037
Category grades
Schools grade is shown separately in the Schools card above.
Census & demographics
- Census place
- Phenix City, AL
- County
- Russell County · 53,055 people
- City population
- 62,290
- Metro
- Columbus, GA-AL
- Population (ZIP)
- 22,821
- Household income
- $48,026
- Rent vs Own
- Severe rent burden
- 1399.0
Population outlook (Russell County) Hauer SSP2
- Today (2025)
- 70,137 people
- By 2030
- 75,826 · +8.1%
- By 2040
- 87,858 · +25.3%
- By 2050
- 99,721 · +42.2%
- By 2075
- 128,009 · +82.5%
- By 2100
- 149,251 · +112.8%
Race, ethnicity, and origin ACS 2023
- Neighborhood character
- Diverse neighborhood (Simpson 0.60)
- Race & ethnicity
- White 53% Black 34% Hispanic / Latino 7% Two or more races 7% Asian 2%
- Hispanic origin (detail)
- Mexican 1% Puerto Rican 2% Cuban 2%
- Common ancestry
- Romanian 2% Italian 2% Slovak 1%
- Foreign-born
- 4% · Canada, China, South Korea
- Languages at home
- 94% English-only · Spanish 4% Tagalog/Filipino 1%
Political lean MEDSL · Russell
- 2024 margin
- Toss-up / Even · D 50.4% · R 48.7%
- 2008→2024 swing
- -5.6pp toward R · 2008: 7.3pp · 2024: 1.7pp
- All cycles
- 2024: D+1.7 2020: D+6.4 2016: D+1.9 2012: D+11.8 2008: D+7.3
Not yet ingested
- Civics
- —
Market trends
- HPI YoY
- ▼ -74.10%
- Current HPI
- 171.8426
- Rent YoY
- ▲ 5.33%
- Metro
- Columbus, GA-AL
- State GDP YoY
- ▲ 2.94%
- F500 in state
- 4
Industry mix (Fortune 500 HQ in AL)
| Industry | F500 HQs | Revenue |
|---|---|---|
| Financial Services | 1 | $8B |
|
||
| Healthcare | 1 | $5B |
|
||
Price history
2 events — show timeline
- 2026-05-15 Pending — EABOR
- 2026-05-11 Listed $36,500 EABOR
Property tax history
+2.4%/yrLatest (2025): $258 · +4.8% YoY. Source: county tax records.
Cash-flow waterfall
monthlySold comps — $/sqft
last 12 mo · ≤1 miLoading sold comps…