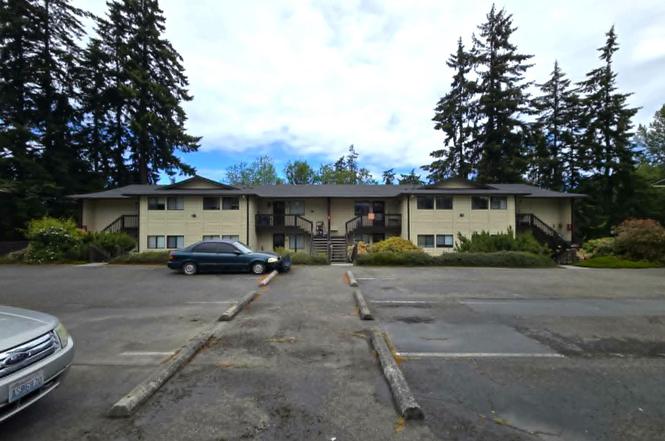
 8-Plex
1239 Campbell Ave · Port Angeles, WA
Flood risk 1/10 · Minimal
- FEMA flood zone
- X
- Chance of flooding over 30 yrs
- 0.0%
- Est. flood insurance / yr
- $507 – $1,088
Fire risk 1/10 · Minimal
- Est. fire insurance / yr
- $604 – $1,122
Heat risk 1/10 · Minimal
- Hot days now (above 83°F)
- 6 days/yr
- Hot days in 30 yrs
- 12 days/yr
Wind risk 1/10 · Minimal
- Chance of severe wind over 30 yrs
- —
Air-quality risk 6/10 · Moderate
- Unhealthy air days now
- 8 days/yr
- Unhealthy air days in 30 yrs
- 9 days/yr
Risk factors via First Street. Map © Google.
Why this score? — see what drove the B grade
The composite is a weighted blend of 9 inputs, each scored 0–100. Each bar is that input's sub-score; the figure is the points it added to the 100-point composite (weight × sub-score).
- Cash flow +27.5/30.0
- ARV discount +15.0/15.0
- DSCR +9.6/10.0
- 1% rule +6.5/10.0
- Schools +5.2/10.0
- Livability +3.9/5.0
- Rent growth +2.5/5.0
- Condition / age +2.5/5.0
- Appreciation +0.0/10.0
$1,195,000
🖨 Deal sheet 📄 Offer letter ✓ Due diligence
Multi-family units
County records classify this as Multi-Family (5+ Unit). Listing-text estimate: 8 units. confirmed
5+ unit building — per-unit beds/baths from public records are typically unavailable; the breakdown below (if shown) is an estimate from the listing text.
Listing remarks MLS
Great 8 unit investment property! Owners have kept this very well maintained. Great rental location minutes away from college, downtown, and the National Park. Each unit comes with its own washer/dryer, two parking spots, and great functional layout. This property has a stable rental history and reliable tenants.
Key facts
- Washer dryer
- 2 parking spaces
- Well maintained
Tags
Property features AI
Finance
- Other: Located in the Beacon Hill subdivision
- Financial info: Annual taxes listed
Exterior
- Utilities: Public water; Public sewer
- Home design: Multi-family residential income property; 5–10 unit building; 2 stories
- Construction: Wood siding; Composition roof
- Exterior features: Level lot; Lot dimensions approximately 116 x 157 x 118 x 157; Zoned for multi-family
Interior
- Kitchen: Oven; Range; Refrigerator; Dishwasher not listed
- Flooring: Vinyl flooring; Carpet
- Heating & cooling: Baseboard heating (electric)
- Interior features: Washer and Dryer included; Oven, Range, Refrigerator
- Laundry & utility: Washer; Dryer
Neighborhood map
What this means for you Summary
Snapshot
- This is a 8 × 2-bed/1.5-bath units multifamily listed at $1.20M.
Deal economics
- At list price, monthly cash flow is $4k ($42k/yr) — positive. Per door: $442/mo.
- The deal already cash-flows at list — no discount required.
- Meets the 1% rule at list price ($14k rent vs $1.20M).
- Cap rate 9.8% vs local median 2.8% in Port Angeles — top-decile yield for the area; either an underpriced asset or a hidden risk that comps aren't pricing in. Stress-test before assuming the spread holds.
Location & tenants
- Location reads 78/100 on livability (#138 in WA, #2,729 nationally) — a middle-class / working-renter tenant base. Strengths: amenities A+, commute A+, health & safety A+; Watch: employment C-, crime F.
- Port Angeles School District (town): math 55% / reading 65% proficiency, ranked #70 of 291 in WA (top 24%) — acceptable for families but not a draw, mixed tenant base, ~2y average lease.
- Market conditions: 268 active listings in the ZIP; 166 units permitted in Clallam County in 2024 (0 in 5+ unit buildings).
Forward outlook
- Local home prices are declining (-3.0%/yr); year-one equity from $8k of loan paydown is wiped out by about $36k of value loss. Plan a longer hold.
- Clallam County population projected at +5% by 2050 — modest demand growth; plan on rents tracking national, not racing it.
- At projected returns (-3.0% appreciation + 3.0% rent growth), your $335k cash investment doubles in ~9 years — after that, you're playing with house money.
Negotiation context
- Only 3 days on market — expect competitive offers; lowballing is unlikely to land.
- Current owner paid $525k; list at $1.20M implies a 128% gain — meaningful room to come down on a strong offer.
Questions for the listing agent
- Can we see the unit-by-unit rent roll, current vacancy, and any below-market leases? What's the average tenancy length?
- What capital expenditures (roof, boiler, parking lot, exteriors) have been made in the last 5 years, and what's planned in the next 2?
- Built in 1979 — when were the roof, HVAC, electrical panel, plumbing, and water heater last replaced?
- Is there a deadline driving the sale (1031 exchange, divorce, estate, relocation)? That informs how much negotiation room exists.
- Schools are B-rated — typically a magnet for longer-tenancy family renters. What's the average tenant stay here, and is there a school-zone premium baked into asking?
- Crime grade is F in this area — have there been break-ins, vandalism, or insurance claims at this property in the last 3 years? What carrier currently insures it and at what premium?
- What's the average days-on-market for RENTAL listings here right now (not sales)? A rising rental-DOM trend means longer vacancies and softer asking-rent achievability than the comps imply.
- What's the recent tenant-quality profile in this submarket — average credit score on applications, eviction rate, late-payment / NSF rate, and stable-employment percentage? A property-management company in the area should have these aggregated.
- How much new apartment / multifamily construction is in the pipeline within 1–3 miles? Heavy new supply (>2% of stock underway) typically softens rents 12–24 months out; light construction supports rent growth.
Investment metrics
- 1% rule
- 1.15% ✓
- Cap rate
- 9.84%
- Cash-on-cash
- 12.68%
- DSCR
- 1.56
- GRM
- 7.2
CMA / ARV
- ARV (on-the-fly)
- $2,022,592
- Comps found
- 1
Show comp detail 1 sale within ~0.75 mi
| Address | Dist | Beds/Ba | Sqft | Sold | Price | $/sf | Match |
|---|---|---|---|---|---|---|---|
| 1203 Campbell Ave | 0.08mi | —/— | 6,912 (-2%) | 15mo | $1,975,000 | $286 | 80 |
Match score weights: distance 35% · size 25% · config 20% · recency 20%. Top-matched comps best support the ARV.
Projected returns pro-forma
-3.0% appreciation · 3.0% rent growth · sell at horizon
- IRR
- 2.4%
- Equity multiple
- 1.09×
- Total profit
- $31,235
- Equity at exit
- $178,178
- IRR
- 12.0%
- Equity multiple
- 1.94×
- Total profit
- $315,752
- Equity at exit
- $103,322
Cash invested: $334,600 (down + closing). Projections, not guarantees.
Landlord ↔ Tenant lean methodology
- Overall (STATE)
- 28 Tenant-Leaning
- State Washington
- 28 Tenant-Leaning · D+8
- County
- — inherits STATE
- City
- — inherits STATE
ZIP-level market 98362
- Active inventory
- 268
- Price-to-rent
- 57.9×
Monthly cashflow live
- Estimated rent
- $13,752 medium interval (Pro) →
- Mortgage (P&I)
- −$6,267
- Tax from tax record
- −$563 /mo · $6,756/yr
- Insurance
- −$498
- HOA
- −$0
- Vacancy / Maint / Mgmt
- −$2,888
- Net cashflow
- $3,536
Break-even live
8-unit breakdown (identical units grouped — click to expand)
| Units | Beds | Baths | Est. rent |
|---|---|---|---|
| 8× units | 2 | 1.5 | $13,752 |
| #1 | 2 | 1.5 | $1,719 |
| #2 | 2 | 1.5 | $1,719 |
| #3 | 2 | 1.5 | $1,719 |
| #4 | 2 | 1.5 | $1,719 |
| #5 | 2 | 1.5 | $1,719 |
| #6 | 2 | 1.5 | $1,719 |
| #7 | 2 | 1.5 | $1,719 |
| #8 | 2 | 1.5 | $1,719 |
| Total (8 units) | $13,752 | ||
UW: 25.0% down · 7.5% · 30yr · 1.5% tax · 5.0% vac · 8.0% maint · 8.0% mgmt
Financing live
Cash to close
- Down payment
- $298,750
- Closing costs
- $35,850
- Reserves months
- —
- Total cash needed
- —
Loan-product check · same deal, 3 products live
Conventional
25% down · 7.5% · 30yr
- Down + closing
- —
- Monthly P&I
- —
- Monthly cashflow
- —
- DSCR
- —
- Eligible?
- —
Personal DTI + credit; lowest rate.
DSCR
20% down · 8.5% · 30yr
- Down + closing
- —
- Monthly P&I
- —
- Monthly cashflow
- —
- DSCR
- —
- Eligible?
- —
No personal income docs; deal must DSCR.
Hard money
10% down · 12.0% · 12mo
- Down + closing
- —
- Monthly P&I
- —
- Monthly cashflow
- —
- DSCR
- —
- Eligible?
- —
Short-term bridge; refi at stabilization.
Listing history 4 events
-
2026-06-18days on market $1,195,000 Active 3 DOM
-
2026-06-17days on market $1,195,000 Active 2 DOM
-
2026-06-16remarks 238-char remark
-
2026-06-16$1,195,000 Active 1 DOM
ⓘ Source: listings_history table (triggers on properties + properties_extension) + one-shot
backfill from property_details.listing_events for pre-trigger history.
Tax reassessment forecast WA · Resets to sale price
- Current annual tax
- $6,756 · $563/mo
- Projected year-2 tax
- $11,711 · $976/mo
- Expected delta
- +$4,955/yr (+$413/mo · 73.4%)
ⓘ Screening estimate from a state-policy table — verify with the county assessor before closing.
Climate risk First Street
- Flood 1/10 Low FEMA zone X · 0% chance over 30 yrs
- Wildfire 1/10 Low
- Heat 1/10 Low 6 d/yr ≥83°F today · 12 d/yr by 30 yrs out
- Wind 1/10 Low
- Air quality 6/10 Major 8 unhealthy d/yr today · 9 by 30 yrs out
Nearby sold comps map
Loading sold comps map…
Walkable amenities ~0.75 mi
Loading nearby amenities…
Taxation est. · year 1
- Rental income
- $165,024
- − Mortgage interest
- −$66,939
- − Property taxes
- −$6,756
- − Insurance
- −$5,975
- − Repairs & maintenance
- −$13,202
- − Management
- −$13,202
- − Depreciation
- −$34,764
- Taxable income
- $24,187
- Est. tax owed @ 24.0%
- −$5,805
- After-tax cash flow
- $36,633/yr
For passive investors: Depreciation is non-cash, so a rental often shows a tax loss while cash-flowing — sheltering income. Rental losses are passive: they offset passive income freely, and up to $25,000/yr can offset ordinary (W-2) income if you actively participate and your MAGI is under $100k (phasing out to $0 by $150k); unused losses carry forward. On sale, claimed depreciation is recaptured at up to 25%, and gains may owe capital-gains tax (a 1031 exchange can defer both). Figures are a year-1 estimate at your 24.0% rate — not tax advice; consult a CPA.
Schools (NCES district)
- District
- Port Angeles School District
- NCES district ID
- 5306820
- Math proficiency
- 55% ▬ 0.00%
- Reading proficiency
- 65% ▲ 1.00%
- Median HH income
- $46,594
- Composite
- 52.34/100
- National rank
- #3432
- State rank
- #70 of 291 in WA
Livability — Port Angeles
- Score
- 78/100
- State rank
- #138
- US rank
- #2729
Category grades
Schools grade is shown separately in the Schools card above.
Census & demographics
- Census place
- Port Angeles, WA
- Population (ZIP)
- 23,907
Population outlook (Clallam County) Hauer SSP2
- Today (2025)
- 76,817 people
- By 2030
- 78,177 · +1.8%
- By 2040
- 79,795 · +3.9%
- By 2050
- 80,890 · +5.3%
- By 2075
- 83,933 · +9.3%
- By 2100
- 82,141 · +6.9%
Race, ethnicity, and origin ACS 2023
- Neighborhood character
- Predominantly White (84%)
- Race & ethnicity
- White 84% Two or more races 8% Hispanic / Latino 7% Native American 1% Asian 1%
- Hispanic origin (detail)
- Mexican 4%
- Common ancestry
- Italian 6% Portuguese 6% Lithuanian 4%
- Foreign-born
- 4% · Canada
- Languages at home
- 95% English-only · Spanish 3% German/W. Germanic 1%
Political lean MEDSL · Clallam
- 2024 margin
- Lean D (+7.9) · D 52.6% · R 44.7% · Other 2.7%
- 2008→2024 swing
- +4.6pp toward D · 2008: 3.3pp · 2024: 7.9pp
- All cycles
- 2024: D+7.9 2020: D+3.4 2016: R+1.6 2012: D+0.4 2008: D+3.3
Not yet ingested
- Civics
- —
Market trends
- HPI YoY
- ▼ -340.90%
- Current HPI
- 189.7112
- Rent YoY
- —
- Metro
- —
- State GDP YoY
- ▲ 4.65%
- F500 in state
- 22
Industry mix (Fortune 500 HQ in WA)
| Industry | F500 HQs | Revenue |
|---|---|---|
| Retail | 2 | $269B |
|
||
| Technology / Retail | 1 | $638B |
|
||
| Technology | 1 | $245B |
|
||
| Telecommunications | 1 | $38B |
|
||
| Food / Beverage | 1 | $36B |
|
||
| Automotive / Trucks | 1 | $34B |
|
||
Price history
+127.6% since first listed3 events — show timeline
- 2026-06-15 Listed $1,195,000 OLS
- 2017-07-18 Sold (Public Records) $525,000 Public Records
- 2017-07-18 Sold (MLS) $525,000 OLS
Property tax history
+1.7%/yrLatest (2026): $6,756 · -0.6% YoY. Source: county tax records.
Cash-flow waterfall
monthlySold comps — $/sqft
last 12 mo · ≤1 miLoading sold comps…