 🏷️ Likely Rental
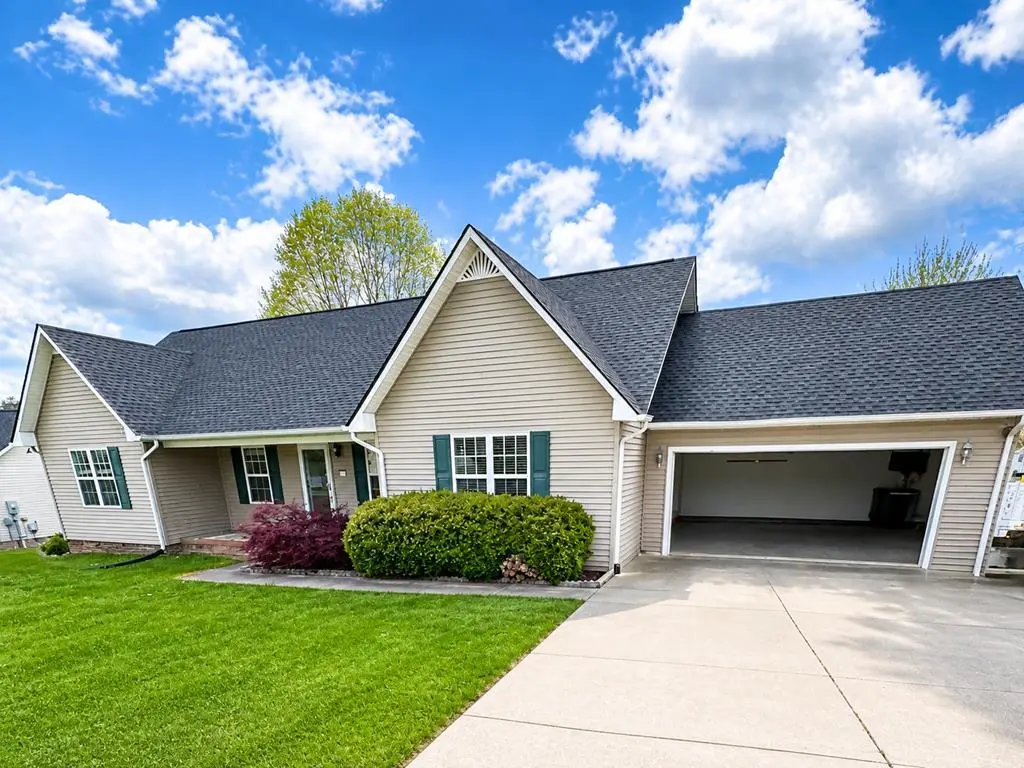
7008 Brittney Cir · Baxter, TN
Flood risk 1/10 · Minimal
- FEMA flood zone
- X (unshaded)
- Chance of flooding over 30 yrs
- 0.0%
- Est. flood insurance / yr
- $507 – $1,088
Fire risk 5/10 · Moderate
- Est. fire insurance / yr
- $949 – $1,763
Heat risk 5/10 · Moderate
- Hot days now (above 104°F)
- 7 days/yr
- Hot days in 30 yrs
- 21 days/yr
Wind risk 4/10 · Minor
- Chance of severe wind over 30 yrs
- 9.0%
Air-quality risk 2/10 · Minimal
- Unhealthy air days now
- 1 days/yr
- Unhealthy air days in 30 yrs
- 2 days/yr
Risk factors via First Street. Map © Google.
Why this score? — see what drove the C- grade
The composite is a weighted blend of 9 inputs, each scored 0–100. Each bar is that input's sub-score; the figure is the points it added to the 100-point composite (weight × sub-score).
- Cash flow +15.0/30.0
- Appreciation +10.0/10.0
- ARV discount +7.5/15.0
- 1% rule +5.0/10.0
- DSCR +5.0/10.0
- Livability +3.3/5.0
- Schools +2.6/10.0
- Rent growth +2.5/5.0
- Condition / age +2.5/5.0
$2,049
🖨 Deal sheet 📄 Offer letter ✓ Due diligence
Listing remarks MLS
One level home featuring all hardwood and tile floors! NO CARPET! Open floor plan w/ vaulted ceiling. Split bedroom plan. Master features walk-in closet and walk-in show. 2 blinds, nice neutral paint color. Seller updates include: ALL new hardwood and tile; 2 blinds; paint throughout; french doors; kitchen back splash; outbuilding; underground fencing (collar & box not included); water heater. Priced to sell.
Key facts
- Galley-style kitchen
- Manicured front lawn
- 0.49 acre lot
Tags
Property features AI
Exterior
- Parking: Attached garage (1 covered parking space, 1 total space)
- Utilities: Public water; Septic tank sewer; Electric service with circuit breakers
- Home design: Residential property; One level; Residential rental/property management sub-type
- Construction: Frame construction with wood siding; Composition shingle roof
- Exterior features: Front porch
Interior
- Kitchen: Dishwasher; Electric oven; Electric range; Refrigerator; Electric water heater
- Flooring: Hardwood flooring
- Bathrooms: 2 full bathrooms
- Heating & cooling: Electric heating; Ceiling fan cooling
- Interior features: Ceiling fans; Double-pane windows
Neighborhood map
What this means for you Summary
Snapshot
- This is a 3-bed/2.0-bath single-family listed at $2k.
Deal economics
- At list price, monthly cash flow is $945 ($11k/yr) — positive.
- The deal already cash-flows at list — no discount required.
- Meets the 1% rule at list price ($1k rent vs $2k).
- Recommended offer: $2k (3.0% below list) — sets the bar for market timing.
- Cap rate 559.9% vs local median 1.8% in Baxter — top-decile yield for the area; either an underpriced asset or a hidden risk that comps aren't pricing in. Stress-test before assuming the spread holds.
Location & tenants
- Location reads 66/100 on livability (#131 in TN) — a middle-class / working-renter tenant base. Strengths: cost of living A+, housing A+, crime B+; Watch: health & safety C-, employment D, schools F.
- Putnam County (town): math 32% / reading 31% proficiency, ranked #49 of 139 in TN (top 35%) — families likely to look elsewhere, expect single-tenant / working-renter base with shorter leases.
- Market conditions: 200 active listings in the ZIP; 700 units permitted in Putnam County in 2024 (48 in 5+ unit buildings).
Forward outlook
- In year one you build about $219 of equity ($14 loan paydown + $205 appreciation (10.0% local appreciation)).
- Putnam County population projected at +16% by 2050 — long-run rental-demand tailwind backs the buy-and-hold thesis.
- At projected returns (10.0% appreciation + 3.0% rent growth), your $574 cash investment doubles in ~1 year — after that, you're playing with house money.
Negotiation context
- It's been on market 46 days — a 3% lower offer ($2k) is reasonable based on typical stale-listing flexibility.
- 4 sale attempts since 19y ago; this cycle's ask has dropped $126 (6%) from the opening price — seller is motivated, your offer sets the floor, not the list.
Risks & watch-outs
- Climate carrying-cost: moderate wildfire risk; extreme-heat days projected 7→21/yr by 2055 (HVAC capex compounding) — expect insurance premiums to compound above CPI over the hold.
Questions for the listing agent
- It's been on market 46 days. Have you received any prior offers? Is the seller open to a 3% concession, seller financing, or rate buy-down credit?
- Is there a deadline driving the sale (1031 exchange, divorce, estate, relocation)? That informs how much negotiation room exists.
- Schools are F-rated, which usually means shorter tenancies and higher turnover. Who's the typical renter profile here, and what's been the actual vacancy rate?
- What's the average days-on-market for RENTAL listings here right now (not sales)? A rising rental-DOM trend means longer vacancies and softer asking-rent achievability than the comps imply.
- What's the recent tenant-quality profile in this submarket — average credit score on applications, eviction rate, late-payment / NSF rate, and stable-employment percentage? A property-management company in the area should have these aggregated.
- How much new for-sale + rental construction is in the pipeline within 1–3 miles? Heavy new supply typically softens prices + rents 12–24 months out; constrained supply supports both.
Investment metrics
- 1% rule
- 59.27% ✓
- Cap rate
- 559.92%
- Cash-on-cash
- 1977.22%
- DSCR
- 88.98
- GRM
- 0.1
CMA / ARV
- ARV (median comp)
- $327,007
- List price
- $2,049
- Delta
- -99.37%
- Verdict
- UNDERPRICED
- Comps
- 20 within 1.0 mi
Show comp detail 7 sales within ~0.75 mi
| Address | Dist | Beds/Ba | Sqft | Sold | Price | $/sf | Match |
|---|---|---|---|---|---|---|---|
| 7012 Brittney Cir | 0.02mi | 3/2.0 | 1,623 (+2%) | 1mo | $360,000 | $222 | 94 |
| 6544 Thomas Twin Oak Rd | 0.51mi | 3/2.0 | 1,670 (+5%) | 3mo | $375,000 | $225 | 65 |
| 6400 Thomas Twin Oak Rd | 0.39mi | 3/2.0 | 1,725 (+9%) | 4mo | $419,900 | $243 | 64 |
| 6450 Thomas Twin Oaks Rd | 0.46mi | 3/2.0 | 1,725 (+9%) | 4mo | $420,000 | $243 | 60 |
| 6905 Cookeville Boat Dock Rd | 0.10mi | 3/2.0 | 1,773 (+12%) | 19mo | $370,000 | $209 | 60 |
| 7079 Brittney Cir | 0.17mi | 3/2.0 | 1,749 (+10%) | 22mo | $310,000 | $177 | 57 |
| 6528 Thomas Twin Oak Rd | 0.53mi | 3/3.0 | 1,668 (+5%) | 18mo | $369,000 | $221 | 48 |
Match score weights: distance 35% · size 25% · config 20% · recency 20%. Top-matched comps best support the ARV.
Projected returns pro-forma
10.0% appreciation · 3.0% rent growth · sell at horizon
- IRR
- —
- Equity multiple
- 107.92×
- Total profit
- $61,342
- Equity at exit
- $1,846
- IRR
- —
- Equity multiple
- 233.40×
- Total profit
- $133,331
- Equity at exit
- $3,981
Cash invested: $574 (down + closing). Projections, not guarantees.
Landlord ↔ Tenant lean methodology
- Overall (STATE)
- 87 Strongly Landlord-Friendly
- State Tennessee
- 87 Strongly Landlord-Friendly · R+13
- County
- — inherits STATE
- City
- — inherits STATE
ZIP-level market 38544
- Home prices YoY
- 5.0%
- Active inventory
- 200
- Price-to-rent
- 0.1×
Monthly cashflow live
- Estimated rent
- $1,215 medium interval (Pro) →
- Mortgage (P&I)
- −$11
- Tax est. 1.5%
- −$3 /mo · $31/yr
- Insurance
- −$1
- HOA
- −$0
- Vacancy / Maint / Mgmt
- −$255
- Net cashflow
- $945
Break-even live
UW: 25.0% down · 7.5% · 30yr · 1.5% tax · 5.0% vac · 8.0% maint · 8.0% mgmt
Financing live
Cash to close
- Down payment
- $512
- Closing costs
- $61
- Reserves months
- —
- Total cash needed
- —
Loan-product check · same deal, 3 products live
Conventional
25% down · 7.5% · 30yr
- Down + closing
- —
- Monthly P&I
- —
- Monthly cashflow
- —
- DSCR
- —
- Eligible?
- —
Personal DTI + credit; lowest rate.
DSCR
20% down · 8.5% · 30yr
- Down + closing
- —
- Monthly P&I
- —
- Monthly cashflow
- —
- DSCR
- —
- Eligible?
- —
No personal income docs; deal must DSCR.
Hard money
10% down · 12.0% · 12mo
- Down + closing
- —
- Monthly P&I
- —
- Monthly cashflow
- —
- DSCR
- —
- Eligible?
- —
Short-term bridge; refi at stabilization.
Listing history 28 events
-
2026-06-19days on market $2,049 Active 46 DOM
-
2026-06-18days on market $2,049 Active 45 DOM
-
2026-06-17days on market $2,049 Active 44 DOM
-
2026-06-16days on market $2,049 Active 43 DOM
-
2026-06-15days on market $2,049 Active 42 DOM
-
2026-06-14days on market $2,049 Active 40 DOM
-
2026-06-13days on market $2,049 Active 39 DOM
-
2026-06-10days on market $2,049 Active 37 DOM
-
2026-06-09days on market $2,049 Active 36 DOM
-
2026-06-08days on market $2,049 Active 35 DOM
-
2026-06-07days on market $2,049 Active 34 DOM
-
2026-06-05days on market $2,049 Active 31 DOM
-
2026-06-02days on market $2,049 Active 29 DOM
-
2026-06-01days on market $2,049 Active 28 DOM
-
2026-05-31days on market $2,049 Active 27 DOM
-
2026-05-30days on market $2,049 Active 26 DOM
-
2026-05-15price $2,099 1000-char remark
-
2026-05-08historical $2,175
-
2026-05-05$2,175 Active 1000-char remark
-
2026-05-02price $2,175
-
2026-04-10$2,199
-
2022-02-24price $1,599
-
2017-03-20soldstatus $139,000 418-char remark
Show marketing remark (418 chars)
One level home featuring all hardwood and tile floors! NO CARPET! Open floor plan w/ vaulted ceiling. Split bedroom plan. Master features walk-in closet and walk-in show. 2 blinds, nice neutral paint color. Seller updates include: ALL new hardwood and tile; 2 blinds; paint throughout; french doors; kitchen back splash; outbuilding; underground fencing (collar & box not included); water heater. Priced to sell.
-
2017-03-20soldstatus $139,000
Show marketing remark (418 chars)
One level home featuring all hardwood and tile floors! NO CARPET! Open floor plan w/ vaulted ceiling. Split bedroom plan. Master features walk-in closet and walk-in show. 2 blinds, nice neutral paint color. Seller updates include: ALL new hardwood and tile; 2 blinds; paint throughout; french doors; kitchen back splash; outbuilding; underground fencing (collar & box not included); water heater. Priced to sell.
-
2017-01-27$142,500 418-char remark
Show marketing remark (418 chars)
One level home featuring all hardwood and tile floors! NO CARPET! Open floor plan w/ vaulted ceiling. Split bedroom plan. Master features walk-in closet and walk-in show. 2 blinds, nice neutral paint color. Seller updates include: ALL new hardwood and tile; 2 blinds; paint throughout; french doors; kitchen back splash; outbuilding; underground fencing (collar & box not included); water heater. Priced to sell.
-
2008-03-05soldstatus $127,500
-
2008-03-04soldstatus $127,500
-
2007-08-16$132,500
ⓘ Source: listings_history table (triggers on properties + properties_extension) + one-shot
backfill from property_details.listing_events for pre-trigger history.
Climate risk First Street
- Flood 1/10 Low FEMA zone X (unshaded) · 0% chance over 30 yrs
- Wildfire 5/10 Major
- Heat 5/10 Major 7 d/yr ≥104°F today · 21 d/yr by 30 yrs out
- Wind 4/10 Moderate 9% chance of damaging wind over 30 yrs
- Air quality 2/10 Low 1 unhealthy d/yr today · 2 by 30 yrs out
Nearby sold comps map
Loading sold comps map…
Walkable amenities ~0.75 mi
Loading nearby amenities…
Taxation est. · year 1
- Rental income
- $14,574
- − Mortgage interest
- −$115
- − Property taxes
- −$31
- − Insurance
- −$10
- − Repairs & maintenance
- −$1,166
- − Management
- −$1,166
- − Depreciation
- −$60
- Taxable income
- $12,027
- Est. tax owed @ 24.0%
- −$2,886
- After-tax cash flow
- $8,457/yr
For passive investors: Depreciation is non-cash, so a rental often shows a tax loss while cash-flowing — sheltering income. Rental losses are passive: they offset passive income freely, and up to $25,000/yr can offset ordinary (W-2) income if you actively participate and your MAGI is under $100k (phasing out to $0 by $150k); unused losses carry forward. On sale, claimed depreciation is recaptured at up to 25%, and gains may owe capital-gains tax (a 1031 exchange can defer both). Figures are a year-1 estimate at your 24.0% rate — not tax advice; consult a CPA.
Schools (NCES district)
- District
- Putnam County
- NCES district ID
- 4703480
- Math proficiency
- 32% ▼ -6.00%
- Reading proficiency
- 31% ▼ -5.00%
- Median HH income
- $35,738
- Composite
- 26.09/100
- National rank
- #7291
- State rank
- #49 of 139 in TN
Livability — Baxter
- Score
- 66/100
- State rank
- #131
- US rank
- #12008
Category grades
Schools grade is shown separately in the Schools card above.
Census & demographics
- Population (ZIP)
- 7,413
Population outlook (Putnam County) Hauer SSP2
- Today (2025)
- 80,122 people
- By 2030
- 82,798 · +3.3%
- By 2040
- 87,913 · +9.7%
- By 2050
- 92,659 · +15.6%
- By 2075
- 104,965 · +31.0%
- By 2100
- 113,256 · +41.4%
Race, ethnicity, and origin ACS 2023
- Neighborhood character
- Predominantly White (88%)
- Race & ethnicity
- White 88% Hispanic / Latino 8% Two or more races 3%
- Hispanic origin (detail)
- Common ancestry
- Iranian 2% Slovak 2% Lithuanian 2%
- Foreign-born
- 4% · Canada, South Korea, Jamaica
- Languages at home
- 93% English-only · Spanish 7%
Political lean MEDSL · Putnam
- 2024 margin
- Solid R (+47.4) · D 25.7% · R 73.1% · Other 1.1%
- 2008→2024 swing
- -20.5pp toward R · 2008: -26.9pp · 2024: -47.4pp
- All cycles
- 2024: R+47.4 2020: R+43.4 2016: R+45.0 2012: R+37.1 2008: R+26.9
Not yet ingested
- Civics
- —
Market trends
- HPI YoY
- ▲ 15.12%
- Current HPI
- 320.6255
- Rent YoY
- —
- Metro
- —
- State GDP YoY
- ▲ 2.78%
- F500 in state
- 22
Industry mix (Fortune 500 HQ in TN)
| Industry | F500 HQs | Revenue |
|---|---|---|
| Healthcare | 3 | $91B |
|
||
| Retail | 3 | $72B |
|
||
| Transportation / Logistics | 1 | $88B |
|
||
| Paper / Packaging | 1 | $19B |
|
||
| Insurance | 1 | $13B |
|
||
| Energy | 1 | $12B |
|
||
Price history
-98.5% since first listed13 events — show timeline
- 2026-05-26 Price Changed $2,049 UCMLS
- 2026-05-15 Price Changed $2,099 UCMLS
- 2026-05-08 Rental Removed $2,175 SHOWMOJO
- 2026-05-05 Listed $2,175 UCMLS
- 2026-05-02 Price Changed $2,175 SHOWMOJO
- 2026-04-10 Listed for Rent $2,199 SHOWMOJO
- 2022-02-24 Price Changed $1,599 RENT.
- 2017-03-20 Sold (Public Records) $139,000 Public Records
- 2017-03-20 Sold (MLS) $139,000 UCMLS
- 2017-01-27 Listed $142,500 UCMLS
- 2008-03-05 Sold (Public Records) $127,500 Public Records
- 2008-03-04 Sold (MLS) $127,500 UCMLS
- 2007-08-16 Listed $132,500 UCMLS
Property tax history
+0.8%/yrLatest (2025): $1,104 · +0.0% YoY. Source: county tax records.
Cash-flow waterfall
monthlySold comps — $/sqft
last 12 mo · ≤1 miLoading sold comps…