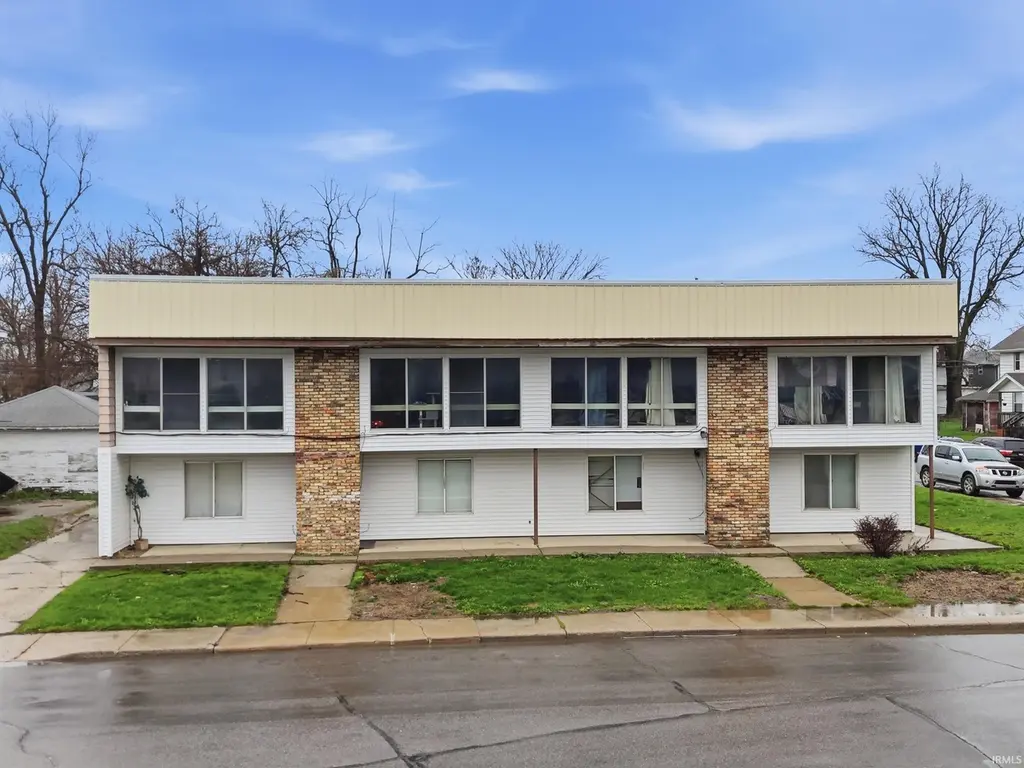
 8-Plex
1821 E Pontiac St · Fort Wayne, IN
Flood risk 1/10 · Minimal
- FEMA flood zone
- X (unshaded)
- Chance of flooding over 30 yrs
- 0.0%
- Est. flood insurance / yr
- $507 – $1,088
Fire risk 1/10 · Minimal
- Est. fire insurance / yr
- $717 – $1,331
Heat risk 3/10 · Minor
- Hot days now (above 100°F)
- 7 days/yr
- Hot days in 30 yrs
- 17 days/yr
Wind risk 2/10 · Minimal
- Chance of severe wind over 30 yrs
- —
Air-quality risk 3/10 · Minor
- Unhealthy air days now
- 2 days/yr
- Unhealthy air days in 30 yrs
- 3 days/yr
Risk factors via First Street. Map © Google.
Why this score? — see what drove the B+ grade
The composite is a weighted blend of 9 inputs, each scored 0–100. Each bar is that input's sub-score; the figure is the points it added to the 100-point composite (weight × sub-score).
- Cash flow +30.0/30.0
- DSCR +10.0/10.0
- Appreciation +10.0/10.0
- 1% rule +7.9/10.0
- ARV discount +7.5/15.0
- Livability +4.2/5.0
- Rent growth +2.5/5.0
- Condition / age +2.5/5.0
- Schools +2.2/10.0
$534,900
🖨 Deal sheet (PDF) 📄 Offer letter ✓ Due diligence
Multi-family units
County records classify this as Multi-Family (5+ Unit). Listing-text estimate: 8 units. confirmed
5+ unit building — per-unit beds/baths from public records are typically unavailable; the breakdown below (if shown) is an estimate from the listing text.
Listing remarks MLS
Don’t miss this excellent income-producing opportunity! This fully rented 8-unit building features eight 1-bedroom, 1-bath units, delivering immediate and consistent cash flow. Recent updates include brand new exterior siding and a roof recoated within the past year for added durability and reduced maintenance. Units have been refreshed with interior updates and fresh paint, and select units feature new baseboard heaters for improved comfort and efficiency. With strong occupancy, functional layouts, and recent improvements, this property offers stable income and long-term investment potential.
Key facts
- 8,712 sq ft lot
- 8 parking spots
- Built 1965
Neighborhood map
What this means for you Summary
Snapshot
- This is a 8 × 1-bed/1-bath units multifamily listed at $535k.
Deal economics
- At list price, monthly cash flow is $2k ($24k/yr) — positive. Per door: $252/mo.
- The deal already cash-flows at list — no discount required.
- Meets the 1% rule at list price ($7k rent vs $535k).
- Recommended offer: $503k (6.0% below list) — sets the bar for market timing.
- Cap rate 10.8% vs local median 4.8% in Fort Wayne — top-decile yield for the area; either an underpriced asset or a hidden risk that comps aren't pricing in. Stress-test before assuming the spread holds.
Location & tenants
- Location reads 84/100 on livability (#6 in IN, #676 nationally) — a professional / high-income tenant draw. Strengths: amenities A+, commute A+, cost of living A+; Watch: crime C-, employment D+.
- Fort Wayne Community Schools (urban): math 22% / reading 29% proficiency, ranked #263 of 301 in IN (top 87%) — low school quality limits family demand, transient renter base, plan for 1-2y turnover; 60% free/reduced lunch — lower-income household profile, screen leases tightly.
- Zoned schools: Lincoln Elementary School (math 29% / reading 26%, grade F, #733 of 994 statewide, top 74%, 616 students, 71% FRL); Shawnee Middle School (math 11% / reading 22%, grade F, #287 of 330 statewide, top 88%, 675 students, 65% FRL); Northrop High School (math 25% / reading 62%, grade F, #191 of 369 statewide, top 52%, 2,136 students, 54% FRL) — zoned schools at 63% FRL track the district average.
- Market conditions: 52 active listings in the ZIP; lower-income renter base — watch delinquency; 1,861 units permitted in Allen County in 2024 (576 in 5+ unit buildings).
- At $6,878/mo this rent would consume 240% of the median local household income ($34k/yr) (locally 660% of renters already pay >50% of income on rent) — very limited rent-growth headroom before tenants either downsize or default.
Forward outlook
- In year one you build about $57k of equity ($4k loan paydown + $53k appreciation (10.0% local appreciation)).
- Allen County population projected at +10% by 2050 — modest demand growth; plan on rents tracking national, not racing it.
- At projected returns (10.0% appreciation + 3.0% rent growth), your $150k cash investment doubles in ~2 years — after that, you're playing with house money.
- By year 2, paydown + projected appreciation supports a ~$92k cash-out refi (75% LTV) — recoverable capital for the next deal without selling this one.
Negotiation context
- It's been on market 80 days — a 6% lower offer ($503k) is reasonable based on typical stale-listing flexibility.
- 3 sale attempts since 2y ago; this cycle's ask has dropped $40k (7%) from the opening price — seller is motivated, your offer sets the floor, not the list.
Questions for the listing agent
- It's been on market 80 days. Have you received any prior offers? Is the seller open to a 6% concession, seller financing, or rate buy-down credit?
- Can we see the unit-by-unit rent roll, current vacancy, and any below-market leases? What's the average tenancy length?
- What capital expenditures (roof, boiler, parking lot, exteriors) have been made in the last 5 years, and what's planned in the next 2?
- Built in 1965 — when were the roof, HVAC, electrical panel, plumbing, and water heater last replaced?
- Why hasn't it sold? Are there any deal-killer items the seller is aware of (foundation, flood, title, zoning, code violations)?
- Is there a deadline driving the sale (1031 exchange, divorce, estate, relocation)? That informs how much negotiation room exists.
- Schools are D-rated, which usually means shorter tenancies and higher turnover. Who's the typical renter profile here, and what's been the actual vacancy rate?
- What's the average days-on-market for RENTAL listings here right now (not sales)? A rising rental-DOM trend means longer vacancies and softer asking-rent achievability than the comps imply.
- What's the recent tenant-quality profile in this submarket — average credit score on applications, eviction rate, late-payment / NSF rate, and stable-employment percentage? A property-management company in the area should have these aggregated.
- How much new apartment / multifamily construction is in the pipeline within 1–3 miles? Heavy new supply (>2% of stock underway) typically softens rents 12–24 months out; light construction supports rent growth.
Investment metrics
- 1% rule
- 1.29% ✓
- Cap rate
- 10.82%
- Cash-on-cash
- 16.17%
- DSCR
- 1.72
- GRM
- 6.5
CMA / ARV
- ARV (median comp)
- $289,604
- List price
- $534,900
- Delta
- 84.70%
- Verdict
- OVERPRICED
- Comps
- 8 within 2.0 mi
Projected returns pro-forma
10.0% appreciation · 3.0% rent growth · sell at horizon
- IRR
- 36.2%
- Equity multiple
- 3.80×
- Total profit
- $419,789
- Equity at exit
- $481,880
- IRR
- 31.2%
- Equity multiple
- 8.58×
- Total profit
- $1,134,992
- Equity at exit
- $1,039,193
Cash invested: $149,772 (down + closing). Projections, not guarantees.
Landlord ↔ Tenant lean methodology
- Overall (STATE)
- 90 Strongly Landlord-Friendly
- State Indiana
- 90 Strongly Landlord-Friendly · R+11
- County
- — inherits STATE
- City
- — inherits STATE
ZIP-level market 46803
- Active inventory
- 52
- Price-to-rent
- 51.8×
Monthly cashflow live
- Estimated rent
- $6,878 high interval (Pro) →
- Mortgage (P&I)
- −$2,805
- Tax from tax record
- −$388 /mo · $4,650/yr
- Insurance
- −$223
- HOA
- −$0
- Vacancy / Maint / Mgmt
- −$1,444
- Net cashflow
- $2,018
Break-even live
Sensitivity live
| Price | -10% $2,321 | -5% $2,170 | +0% $2,018 | +5% $1,867 | +10% $1,715 |
|---|---|---|---|---|---|
| Rent | -10% $1,475 | -5% $1,746 | +0% $2,018 | +5% $2,290 | +10% $2,562 |
| Rate | -1.0pp $2,288 | -0.5pp $2,154 | base $2,018 | +0.5pp $1,880 | +1.0pp $1,739 |
8-unit breakdown (identical units grouped — click to expand)
| Units | Beds | Baths | Est. rent |
|---|---|---|---|
| 8× units | 1 | 1 | $6,880 |
| #1 | 1 | 1 | $860 |
| #2 | 1 | 1 | $860 |
| #3 | 1 | 1 | $860 |
| #4 | 1 | 1 | $860 |
| #5 | 1 | 1 | $860 |
| #6 | 1 | 1 | $860 |
| #7 | 1 | 1 | $860 |
| #8 | 1 | 1 | $860 |
| Total (8 units) | $6,878 | ||
UW: 25.0% down · 7.5% · 30yr · 1.5% tax · 5.0% vac · 8.0% maint · 8.0% mgmt
Financing live
Cash to close
- Down payment
- $133,725
- Closing costs
- $16,047
- Reserves months
- —
- Total cash needed
- —
Loan-product check · same deal, 3 products live
Conventional
25% down · 7.5% · 30yr
- Down + closing
- —
- Monthly P&I
- —
- Monthly cashflow
- —
- DSCR
- —
- Eligible?
- —
Personal DTI + credit; lowest rate.
DSCR
20% down · 8.5% · 30yr
- Down + closing
- —
- Monthly P&I
- —
- Monthly cashflow
- —
- DSCR
- —
- Eligible?
- —
No personal income docs; deal must DSCR.
Hard money
10% down · 12.0% · 12mo
- Down + closing
- —
- Monthly P&I
- —
- Monthly cashflow
- —
- DSCR
- —
- Eligible?
- —
Short-term bridge; refi at stabilization.
Listing history 24 events
-
2026-06-22days on market $534,900 Active 80 DOM
-
2026-06-18days on market $534,900 Active 77 DOM
-
2026-06-17days on market $534,900 Active 76 DOM
-
2026-06-16days on market $534,900 Active 75 DOM
-
2026-06-15days on market $534,900 Active 74 DOM
-
2026-06-14days on market $534,900 Active 72 DOM
-
2026-06-10days on market $534,900 Active 69 DOM
-
2026-06-09days on market $534,900 Active 68 DOM
-
2026-06-08days on market $534,900 Active 67 DOM
-
2026-06-07days on market $534,900 Active 66 DOM
-
2026-06-03days on market $534,900 Active 62 DOM
-
2026-06-02days on market $534,900 Active 61 DOM
-
2026-06-01days on market $534,900 Active 60 DOM
-
2026-05-31days on market $534,900 Active 59 DOM
-
2026-05-30days on market $534,900 Active 58 DOM
-
2026-05-05price $534,900 606-char remark
Show marketing remark (606 chars)
Don’t miss this excellent income-producing opportunity! This fully rented 8-unit building features eight 1-bedroom, 1-bath units, delivering immediate and consistent cash flow. Recent updates include brand new exterior siding and a roof recoated within the past year for added durability and reduced maintenance. Units have been refreshed with interior updates and fresh paint, and select units feature new baseboard heaters for improved comfort and efficiency. With strong occupancy, functional layouts, and recent improvements, this property offers stable income and long-term investment potential.
-
2026-04-02$574,900 Active 606-char remark
Show marketing remark (606 chars)
Don’t miss this excellent income-producing opportunity! This fully rented 8-unit building features eight 1-bedroom, 1-bath units, delivering immediate and consistent cash flow. Recent updates include brand new exterior siding and a roof recoated within the past year for added durability and reduced maintenance. Units have been refreshed with interior updates and fresh paint, and select units feature new baseboard heaters for improved comfort and efficiency. With strong occupancy, functional layouts, and recent improvements, this property offers stable income and long-term investment potential.
-
2025-05-03status Pending
-
2025-03-17price $525,000
-
2025-02-07$550,000 Active
-
2025-01-06price $550,000
-
2024-12-26price $600,000
-
2024-11-12price $625,000
-
2024-07-07$650,000 Active
ⓘ Source: listings_history table (triggers on properties + properties_extension) + one-shot
backfill from property_details.listing_events for pre-trigger history.
Tax reassessment forecast IN · Partial reset (capped growth)
- Current annual tax
- $4,650 · $388/mo
- Projected year-2 tax
- $4,650 · $388/mo
- Expected delta
- $0/yr ($0/mo · 0.0%)
ⓘ Screening estimate from a state-policy table — verify with the county assessor before closing.
Climate risk First Street
- Flood 1/10 Low FEMA zone X (unshaded) · 0% chance over 30 yrs
- Wildfire 1/10 Low
- Heat 3/10 Moderate 7 d/yr ≥100°F today · 17 d/yr by 30 yrs out
- Wind 2/10 Low
- Air quality 3/10 Moderate 2 unhealthy d/yr today · 3 by 30 yrs out
Nearby sold comps map
Loading sold comps map…
Walkable amenities ~0.75 mi
Loading nearby amenities…
Taxation est. · year 1
- Rental income
- $82,536
- − Mortgage interest
- −$29,963
- − Property taxes
- −$4,650
- − Insurance
- −$2,674
- − Repairs & maintenance
- −$6,603
- − Management
- −$6,603
- − Depreciation
- −$15,561
- Taxable income
- $16,482
- Est. tax owed @ 24.0%
- −$3,956
- After-tax cash flow
- $20,262/yr
For passive investors: Depreciation is non-cash, so a rental often shows a tax loss while cash-flowing — sheltering income. Rental losses are passive: they offset passive income freely, and up to $25,000/yr can offset ordinary (W-2) income if you actively participate and your MAGI is under $100k (phasing out to $0 by $150k); unused losses carry forward. On sale, claimed depreciation is recaptured at up to 25%, and gains may owe capital-gains tax (a 1031 exchange can defer both). Figures are a year-1 estimate at your 24.0% rate — not tax advice; consult a CPA.
Schools (NCES district)
- District
- Fort Wayne Community Schools
- NCES district ID
- 1803630
- Math proficiency
- 22% ▼ -11.00%
- Reading proficiency
- 29% ▼ -7.00%
- Median HH income
- $41,951
- Composite
- 21.68/100
- National rank
- #8275
- State rank
- #263 of 301 in IN
Livability — Fort Wayne
- Score
- 84/100
- State rank
- #6
- US rank
- #676
Category grades
Schools grade is shown separately in the Schools card above.
Census & demographics
- Census place
- Fort Wayne, IN
- County
- Allen County · 326,813 people
- City population
- 326,813
- Metro
- Fort Wayne, IN
- Population (ZIP)
- 10,994
- Household income
- $34,381
- Rent vs Own
- Severe rent burden
- 660.0
Population outlook (Allen County) Hauer SSP2
- Today (2025)
- 394,020 people
- By 2030
- 405,128 · +2.8%
- By 2040
- 423,476 · +7.5%
- By 2050
- 435,137 · +10.4%
- By 2075
- 450,293 · +14.3%
- By 2100
- 424,101 · +7.6%
Race, ethnicity, and origin ACS 2023
- Neighborhood character
- Diverse neighborhood (Simpson 0.69)
- Race & ethnicity
- Black 42% White 27% Hispanic / Latino 24% Two or more races 10% Native American 2% Asian 1%
- Hispanic origin (detail)
- Mexican 17% Puerto Rican 1%
- Common ancestry
- Lithuanian 1% Iranian 1% Serbian 1%
- Foreign-born
- 11% · Canada, Philippines
- Languages at home
- 81% English-only · Spanish 16% Other Asian/Pacific 1% French/Haitian/Cajun 1%
Political lean MEDSL · Allen
- 2024 margin
- R (+12.5) · D 42.9% · R 55.4% · Other 1.7%
- 2008→2024 swing
- -8.1pp toward R · 2008: -4.3pp · 2024: -12.5pp
- All cycles
- 2024: R+12.5 2020: R+11.2 2016: R+19.6 2012: R+16.8 2008: R+4.3
Not yet ingested
- Civics
- —
Market trends
- HPI YoY
- ▲ 107.58%
- Current HPI
- 404.7976
- Rent YoY
- —
- Metro
- Fort Wayne, IN
- State GDP YoY
- ▲ 2.90%
- F500 in state
- 18
Industry mix (Fortune 500 HQ in IN)
| Industry | F500 HQs | Revenue |
|---|---|---|
| Industrial Machinery | 2 | $37B |
|
||
| Healthcare | 1 | $177B |
|
||
| Pharmaceuticals | 1 | $45B |
|
||
| Metals / Steel | 1 | $18B |
|
||
| Agriculture | 1 | $17B |
|
||
| Packaging | 1 | $12B |
|
||
Price history
-17.7% since first listed9 events — show timeline
- 2026-05-05 Price Changed $534,900 IRMLS
- 2026-04-02 Listed $574,900 IRMLS
- 2025-05-03 Pending — IRMLS
- 2025-03-17 Price Changed $525,000 IRMLS
- 2025-02-07 Listed $550,000 IRMLS
- 2025-01-06 Price Changed $550,000 IRMLS
- 2024-12-26 Price Changed $600,000 IRMLS
- 2024-11-12 Price Changed $625,000 IRMLS
- 2024-07-07 Listed $650,000 IRMLS
Property tax history
+11.7%/yrLatest (2024): $4,650 · -1.0% YoY. Source: county tax records.
Cash-flow waterfall
monthlySold comps — $/sqft
last 12 mo · ≤1 miLoading sold comps…