 🏗️ New Construction
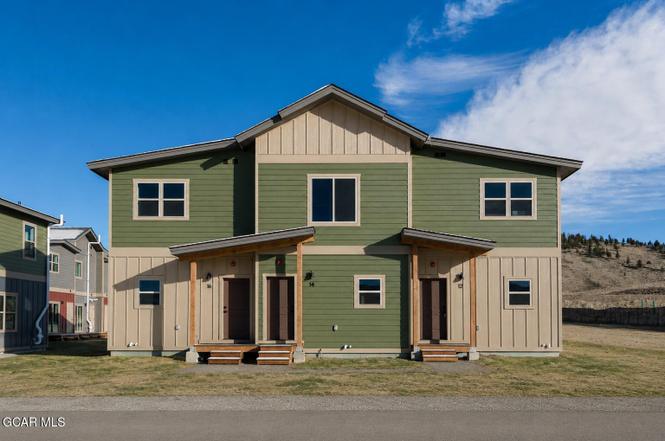
20 Hackamore Dr · Granby, CO
Flood risk No data
- FEMA flood zone
- —
- Chance of flooding over 30 yrs
- —
- Est. flood insurance / yr
- —
Fire risk No data
- Est. fire insurance / yr
- —
Heat risk No data
- Hot days now (above threshold)
- —
- Hot days in 30 yrs
- —
Wind risk No data
- Chance of severe wind over 30 yrs
- —
Air-quality risk No data
- Unhealthy air days now
- —
- Unhealthy air days in 30 yrs
- —
Risk factors via First Street. Map © Google.
Why this score? — see what drove the B grade
The composite is a weighted blend of 9 inputs, each scored 0–100. Each bar is that input's sub-score; the figure is the points it added to the 100-point composite (weight × sub-score).
- Cash flow +30.0/30.0
- 1% rule +10.0/10.0
- DSCR +10.0/10.0
- ARV discount +7.5/15.0
- Schools +4.2/10.0
- Livability +3.5/5.0
- Rent growth +2.5/5.0
- Condition / age +2.5/5.0
- Appreciation +0.0/10.0
$344,213
🖨 Deal sheet 📄 Offer letter ✓ Due diligence
Multi-family units
County records classify this as Multi-Family (2-4 Unit). Listing-text estimate: 3 units. confirmed
Listing remarks
DEED RESTRICTED PROPERTY. Newly completed and move-in ready, this middle unit triplex in Nuche Village offers 2 bedrooms and 2.5 bathrooms with an efficient layout designed for comfortable, full-time living. This home is part of a workforce housing community intended for qualified buyers. The property features open-concept living spaces, quality finishes, and private bedroom suites for added functionality and convenience. Enjoy low-maintenance, lock-and-leave living in a thoughtfully planned community. Buyer must meet all deed-restriction requirements. Eligibility and terms to be verified by Seller. If multiple qualified buyers are identified, a lottery selection process may be used.
Key facts
- New construction
- Built 2025
- Listed 160 days
Tags
Property features AI
Finance
- HOA & community: Homeowners association with $85 monthly fee
Exterior
- Utilities: Public water; Electric on property
- Home design: Residential income property; Triplex; New construction
- Construction: New construction
- Exterior features: Public maintained road; Private maintained road
Interior
- Kitchen: Dishwasher; Disposal; Microwave; Range; Oven; Refrigerator
- Heating & cooling: Forced air heating; Natural gas heating; Has heating
- Interior features: Dishwasher; Disposal; Microwave; Range; Oven; Refrigerator; Washer/Dryer
- Laundry & utility: Washer/Dryer; Washer hookup
Neighborhood map
What this means for you Summary
Snapshot
- This is a 3 × 2.0-bed/2.5-bath units multifamily listed at $344k.
Deal economics
- At list price, monthly cash flow is $2k ($24k/yr) — positive. Per door: $672/mo.
- The deal already cash-flows at list — no discount required.
- Meets the 1% rule at list price ($6k rent vs $344k).
- Recommended offer: $303k (12.0% below list) — sets the bar for market timing.
- Cap rate 13.3% vs local median 1.4% in Granby — top-decile yield for the area; either an underpriced asset or a hidden risk that comps aren't pricing in. Stress-test before assuming the spread holds.
Location & tenants
- Location reads 70/100 on livability (#85 in CO) — a middle-class / working-renter tenant base. Strengths: crime A+, housing A+, employment B+; Watch: commute D+, amenities F, health & safety F.
- East Grand School District No. 2 (rural): math 36% / reading 58% proficiency, ranked #17 of 86 in CO (top 20%) — families likely to look elsewhere, expect single-tenant / working-renter base with shorter leases.
- Market conditions: 424 active listings in the ZIP; 294 units permitted in Grand County in 2024 (82 in 5+ unit buildings).
- At $5,669/mo this rent would consume 91% of the median local household income ($75k/yr) (locally 105% of renters already pay >50% of income on rent) — very limited rent-growth headroom before tenants either downsize or default.
Forward outlook
- Local home prices are declining (-3.0%/yr); year-one equity from $2k of loan paydown is wiped out by about $10k of value loss. Plan a longer hold.
- Grand County population projected at -16% by 2050 — secular population decline; favor cash flow + early exit over multi-decade hold.
- At projected returns (-3.0% appreciation + 3.0% rent growth), your $96k cash investment doubles in ~5 years — after that, you're playing with house money.
Negotiation context
- It's been on market 160 days — a 12% lower offer ($303k) is reasonable based on typical stale-listing flexibility.
Questions for the listing agent
- It's been on market 160 days. Have you received any prior offers? Is the seller open to a 12% concession, seller financing, or rate buy-down credit?
- Can we see the unit-by-unit rent roll, current vacancy, and any below-market leases? What's the average tenancy length?
- What capital expenditures (roof, boiler, parking lot, exteriors) have been made in the last 5 years, and what's planned in the next 2?
- What does the HOA fee cover, when was the last increase, and are there any pending special assessments or reserve-fund shortfalls?
- Why hasn't it sold? Are there any deal-killer items the seller is aware of (foundation, flood, title, zoning, code violations)?
- Is there a deadline driving the sale (1031 exchange, divorce, estate, relocation)? That informs how much negotiation room exists.
- What's the average days-on-market for RENTAL listings here right now (not sales)? A rising rental-DOM trend means longer vacancies and softer asking-rent achievability than the comps imply.
- What's the recent tenant-quality profile in this submarket — average credit score on applications, eviction rate, late-payment / NSF rate, and stable-employment percentage? A property-management company in the area should have these aggregated.
- How much new apartment / multifamily construction is in the pipeline within 1–3 miles? Heavy new supply (>2% of stock underway) typically softens rents 12–24 months out; light construction supports rent growth.
Investment metrics
- 1% rule
- 1.65% ✓
- Cap rate
- 13.32%
- Cash-on-cash
- 25.08%
- DSCR
- 2.12
- GRM
- 5.1
CMA / ARV
No comps found within radius.
Projected returns pro-forma
-3.0% appreciation · 3.0% rent growth · sell at horizon
- IRR
- 18.6%
- Equity multiple
- 1.75×
- Total profit
- $72,680
- Equity at exit
- $51,323
- IRR
- 27.0%
- Equity multiple
- 3.38×
- Total profit
- $229,080
- Equity at exit
- $29,761
Cash invested: $96,380 (down + closing). Projections, not guarantees.
Landlord ↔ Tenant lean methodology
- Overall (STATE)
- 38 Tenant-Leaning
- State Colorado
- 38 Tenant-Leaning · D+4
- County
- — inherits STATE
- City
- — inherits STATE
ZIP-level market 80446
- Home prices YoY
- -23.1%
- Active inventory
- 424
- Price-to-rent
- 15.2×
Monthly cashflow live
- Estimated rent
- $5,669 medium interval (Pro) →
- Mortgage (P&I)
- −$1,805
- Tax est. 1.5%
- −$430 /mo · $5,163/yr
- Insurance
- −$143
- HOA
- −$85
- Vacancy / Maint / Mgmt
- −$1,190
- Net cashflow
- $2,015
Break-even live
3-unit breakdown (identical units grouped — click to expand)
| Units | Beds | Baths | Est. rent |
|---|---|---|---|
| 3× units | 2.0 | 2.5 | $5,670 |
| #1 | 2.0 | 2.5 | $1,890 |
| #2 | 2.0 | 2.5 | $1,890 |
| #3 | 2.0 | 2.5 | $1,890 |
| Total (3 units) | $5,669 | ||
UW: 25.0% down · 7.5% · 30yr · 1.5% tax · 5.0% vac · 8.0% maint · 8.0% mgmt
Financing live
Cash to close
- Down payment
- $86,053
- Closing costs
- $10,326
- Reserves months
- —
- Total cash needed
- —
Loan-product check · same deal, 3 products live
Conventional
25% down · 7.5% · 30yr
- Down + closing
- —
- Monthly P&I
- —
- Monthly cashflow
- —
- DSCR
- —
- Eligible?
- —
Personal DTI + credit; lowest rate.
DSCR
20% down · 8.5% · 30yr
- Down + closing
- —
- Monthly P&I
- —
- Monthly cashflow
- —
- DSCR
- —
- Eligible?
- —
No personal income docs; deal must DSCR.
Hard money
10% down · 12.0% · 12mo
- Down + closing
- —
- Monthly P&I
- —
- Monthly cashflow
- —
- DSCR
- —
- Eligible?
- —
Short-term bridge; refi at stabilization.
HOA detail
- Monthly dues
- $85 · $1,020/yr
Listing history 16 events
-
2026-06-18days on market $344,213 Active 160 DOM
-
2026-06-17days on market $344,213 Active 159 DOM
-
2026-06-16days on market $344,213 Active 158 DOM
-
2026-06-15days on market $344,213 Active 157 DOM
-
2026-06-14days on market $344,213 Active 155 DOM
-
2026-06-10days on market $344,213 Active 152 DOM
-
2026-06-09days on market $344,213 Active 151 DOM
-
2026-06-08days on market $344,213 Active 150 DOM
-
2026-06-07days on market $344,213 Active 149 DOM
-
2026-06-05days on market $344,213 Active 146 DOM
-
2026-06-03days on market $344,213 Active 145 DOM
-
2026-06-02days on market $344,213 Active 144 DOM
-
2026-06-01days on market $344,213 Active 143 DOM
-
2026-05-31days on market $344,213 Active 142 DOM
-
2026-05-31days on market $344,213 Active 141 DOM
-
2025-12-17$344,213 Active
ⓘ Source: listings_history table (triggers on properties + properties_extension) + one-shot
backfill from property_details.listing_events for pre-trigger history.
Nearby sold comps map
Loading sold comps map…
Walkable amenities ~0.75 mi
Loading nearby amenities…
Taxation est. · year 1
- Rental income
- $68,028
- − Mortgage interest
- −$19,281
- − Property taxes
- −$5,163
- − Insurance
- −$1,721
- − Repairs & maintenance
- −$5,442
- − Management
- −$5,442
- − HOA
- −$1,020
- − Depreciation
- −$10,013
- Taxable income
- $19,945
- Est. tax owed @ 24.0%
- −$4,787
- After-tax cash flow
- $19,390/yr
For passive investors: Depreciation is non-cash, so a rental often shows a tax loss while cash-flowing — sheltering income. Rental losses are passive: they offset passive income freely, and up to $25,000/yr can offset ordinary (W-2) income if you actively participate and your MAGI is under $100k (phasing out to $0 by $150k); unused losses carry forward. On sale, claimed depreciation is recaptured at up to 25%, and gains may owe capital-gains tax (a 1031 exchange can defer both). Figures are a year-1 estimate at your 24.0% rate — not tax advice; consult a CPA.
Schools (NCES district)
- District
- East Grand School District No. 2
- NCES district ID
- 0804320
- Math proficiency
- 36% ▼ -2.00%
- Reading proficiency
- 58% ▲ 4.00%
- Median HH income
- $64,903
- Composite
- 41.64/100
- National rank
- #3424
- State rank
- #17 of 86 in CO
Livability — Granby
- Score
- 70/100
- State rank
- #85
- US rank
- #7574
Category grades
Schools grade is shown separately in the Schools card above.
Census & demographics
- Census place
- Granby, CO
- County
- Grand County · 5,874 people
- City population
- 4,017
- Metro
- nan
- Population (ZIP)
- 4,017
- Household income
- $74,973
- Rent vs Own
- Severe rent burden
- 105.0
Population outlook (Grand County) Hauer SSP2
- Today (2025)
- 14,498 people
- By 2030
- 14,215 · -2.0%
- By 2040
- 13,225 · -8.8%
- By 2050
- 12,186 · -15.9%
- By 2075
- 10,196 · -29.7%
- By 2100
- 8,326 · -42.6%
Race, ethnicity, and origin ACS 2023
- Neighborhood character
- Predominantly White (79%)
- Race & ethnicity
- White 79% Two or more races 19% Hispanic / Latino 6%
- Hispanic origin (detail)
- Puerto Rican 2%
- Common ancestry
- Slovak 8% Portuguese 6% Romanian 2%
- Foreign-born
- 2% · Canada, Jamaica
- Languages at home
- 98% English-only · Russian/Polish/Slavic 1% French/Haitian/Cajun 1% Spanish 1%
Political lean MEDSL · Grand
- 2024 margin
- Toss-up / Even · D 48.0% · R 48.8% · Other 3.2%
- 2008→2024 swing
- +0.3pp no change · 2008: -1.1pp · 2024: -0.8pp
- All cycles
- 2024: R+0.8 2020: R+1.8 2016: R+13.5 2012: R+7.2 2008: R+1.1
Not yet ingested
- Civics
- —
Market trends
- HPI YoY
- ▼ -104.78%
- Current HPI
- 347.8691
- Rent YoY
- —
- Metro
- nan
- State GDP YoY
- ▲ 1.95%
- F500 in state
- 14
Industry mix (Fortune 500 HQ in CO)
| Industry | F500 HQs | Revenue |
|---|---|---|
| Technology Distribution | 1 | $31B |
|
||
| Food / Agriculture | 1 | $18B |
|
||
| Packaging | 1 | $14B |
|
||
| Healthcare | 1 | $13B |
|
||
| Energy | 1 | $10B |
|
||
| Technology | 1 | $4B |
|
||
Price history
1 event — show timeline
- 2025-12-17 Listed $344,213 GCAR
Cash-flow waterfall
monthlySold comps — $/sqft
last 12 mo · ≤1 miLoading sold comps…