 Duplex
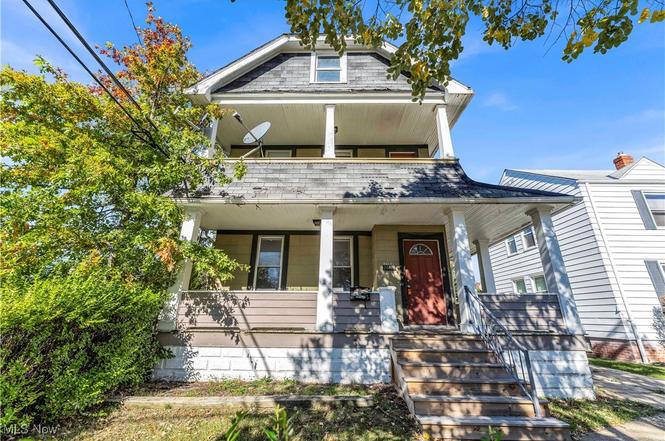
20101 Tracy Ave · Euclid, OH
Flood risk 1/10 · Minimal
- FEMA flood zone
- X (unshaded)
- Chance of flooding over 30 yrs
- 0.0%
- Est. flood insurance / yr
- $473 – $860
Fire risk 1/10 · Minimal
- Est. fire insurance / yr
- $713 – $1,323
Heat risk 3/10 · Minor
- Hot days now (above 94°F)
- 7 days/yr
- Hot days in 30 yrs
- 17 days/yr
Wind risk 1/10 · Minimal
- Chance of severe wind over 30 yrs
- —
Air-quality risk 3/10 · Minor
- Unhealthy air days now
- 3 days/yr
- Unhealthy air days in 30 yrs
- 4 days/yr
Risk factors via First Street. Map © Google.
Why this score? — see what drove the B+ grade
The composite is a weighted blend of 9 inputs, each scored 0–100. Each bar is that input's sub-score; the figure is the points it added to the 100-point composite (weight × sub-score).
- Cash flow +30.0/30.0
- ARV discount +15.0/15.0
- 1% rule +10.0/10.0
- DSCR +10.0/10.0
- Livability +3.9/5.0
- Rent growth +3.8/5.0
- Condition / age +2.5/5.0
- Schools +1.7/10.0
- Appreciation +0.0/10.0
$139,900
🖨 Deal sheet (PDF) 📄 Offer letter ✓ Due diligence
Multi-family units
County records classify this as Multi-Family (2-4 Unit). Listing-text estimate: 2 units. confirmed
Listing remarks MLS
Many Possibilities Here! Easy-to-rent Area With Quick Access To Freeway And Bus Lines. Currently Used As A Single Family, Home Is A Double, Per City. Up Unit Has Access To Attic Which Could Provide More Bedrooms. Home Needs Work. Buyer To Assume All City Violations. Needs Sold Now!
Key facts
- Kitchen with stove
- Unfinished attic
- 4,961 sq ft lot
Tags
Neighborhood map
What this means for you Summary
Snapshot
- This is a 2 × 2-bed/1.0-bath units multifamily listed at $140k.
Deal economics
- At list price, monthly cash flow is $814 ($10k/yr) — positive. Per door: $407/mo.
- The deal already cash-flows at list — no discount required.
- Meets the 1% rule at list price ($2k rent vs $140k).
- Recommended offer: $136k (3.0% below list) — sets the bar for market timing.
- Cap rate 13.3% vs local median 6.7% in Euclid — top-decile yield for the area; either an underpriced asset or a hidden risk that comps aren't pricing in. Stress-test before assuming the spread holds.
Location & tenants
- Location reads 77/100 on livability (#204 in OH, #3,149 nationally) — a middle-class / working-renter tenant base. Strengths: cost of living A+, housing A+, crime B+; Watch: commute F, employment D-.
- Euclid City (suburban): math 14% / reading 28% proficiency, ranked #625 of 656 in OH (top 95%) — low school quality limits family demand, transient renter base, plan for 1-2y turnover; 70% free/reduced lunch — lower-income household profile, screen leases tightly.
- Zoned schools: Arbor Elementary School (math 17% / reading 28%, grade F, #1,239 of 1,584 statewide, top 78%, 370 students, 0% FRL); Euclid Middle School (math 10% / reading 22%, grade F, #624 of 654 statewide, top 96%, 934 students, 0% FRL); Euclid High School (math 7% / reading 33%, grade F, #675 of 781 statewide, top 87%, 1,618 students, 0% FRL) — zoned schools average 0% FRL vs 70% district-wide (70 pts lower); this property's tenant base skews higher-income than the district average.
- Market conditions: Rents rising fast (+5.3%/yr); 96 active listings in the ZIP; 16 comparable units currently listed for rent nearby; rentals at typical pace (median 19d on market — plan ~3-4 weeks tenant-placement turnaround); 1,441 units permitted in Cuyahoga County in 2024 (700 in 5+ unit buildings).
- At $2,387/mo this rent would consume 51% of the median local household income ($56k/yr) (locally 1085% of renters already pay >50% of income on rent) — very limited rent-growth headroom before tenants either downsize or default.
Forward outlook
- Local home prices are declining (-3.0%/yr); year-one equity from $967 of loan paydown is wiped out by about $4k of value loss. Plan a longer hold.
- Cuyahoga County population projected to shrink 8% by 2050 — rents likely to lag national; underwrite the cash flow, not the appreciation.
- At projected returns (-3.0% appreciation + 5.3% rent growth), your $39k cash investment doubles in ~5 years — after that, you're playing with house money.
Negotiation context
- It's been on market 57 days — a 3% lower offer ($136k) is reasonable based on typical stale-listing flexibility.
- 10 sale attempts since 23y ago; this cycle's ask is 14626% above the opening price — seller raised mid-cycle; expect resistance to lowballs.
- Current owner paid $86k; list at $140k implies a 63% gain — meaningful room to come down on a strong offer.
Risks & watch-outs
- Watch-outs: built in 1925 — expect roof / HVAC / electrical / plumbing capex.
Questions for the listing agent
- It's been on market 57 days. Have you received any prior offers? Is the seller open to a 3% concession, seller financing, or rate buy-down credit?
- Can we see the unit-by-unit rent roll, current vacancy, and any below-market leases? What's the average tenancy length?
- What capital expenditures (roof, boiler, parking lot, exteriors) have been made in the last 5 years, and what's planned in the next 2?
- Built in 1925 — when were the roof, HVAC, electrical panel, plumbing, and water heater last replaced?
- Is there a deadline driving the sale (1031 exchange, divorce, estate, relocation)? That informs how much negotiation room exists.
- What's the average days-on-market for RENTAL listings here right now (not sales)? A rising rental-DOM trend means longer vacancies and softer asking-rent achievability than the comps imply.
- What's the recent tenant-quality profile in this submarket — average credit score on applications, eviction rate, late-payment / NSF rate, and stable-employment percentage? A property-management company in the area should have these aggregated.
- How much new apartment / multifamily construction is in the pipeline within 1–3 miles? Heavy new supply (>2% of stock underway) typically softens rents 12–24 months out; light construction supports rent growth.
Investment metrics
- 1% rule
- 1.71% ✓
- Cap rate
- 13.28%
- Cash-on-cash
- 24.94%
- DSCR
- 2.11
- GRM
- 4.9
CMA / ARV
- ARV (on-the-fly)
- $174,960
- Comps found
- 7
Show comp detail 7 sales within ~0.75 mi
| Address | Dist | Beds/Ba | Sqft | Sold | Price | $/sf | Match |
|---|---|---|---|---|---|---|---|
| 20520 Ball Ave | 0.23mi | 4/2.0 | 1,988 (+2%) | 10mo | $162,000 | $81 | 77 |
| 386 E 200th St | 0.10mi | 4/2.0 | 2,040 (+5%) | 14mo | $220,000 | $108 | 75 |
| 324 E 200th St | 0.23mi | 4/2.0 | 1,944 (0%) | 21mo | $175,000 | $90 | 72 |
| 18751 Monterey Ave | 0.49mi | 4/2.0 | 1,976 (+2%) | 11mo | $173,000 | $88 | 65 |
| 19000 Lakeshore Blvd | 0.40mi | 4/2.0 | 2,052 (+6%) | 22mo | $220,000 | $107 | 54 |
| 21370 Milan Dr | 0.53mi | 4/3.0 | 2,128 (+10%) | 10mo | $200,000 | $94 | 47 |
| 20572 Lindbergh Ave | 0.52mi | 5/2.0 (+1) | 1,716 (-12%) | 19mo | $120,000 | $70 | 35 |
Match score weights: distance 35% · size 25% · config 20% · recency 20%. Top-matched comps best support the ARV.
Projected returns pro-forma
-3.0% appreciation · 5.28% rent growth · sell at horizon
- IRR
- 21.1%
- Equity multiple
- 1.89×
- Total profit
- $34,891
- Equity at exit
- $20,860
- IRR
- 30.9%
- Equity multiple
- 4.11×
- Total profit
- $121,648
- Equity at exit
- $12,096
Cash invested: $39,172 (down + closing). Projections, not guarantees.
Landlord ↔ Tenant lean methodology
- Overall (STATE)
- 73 Landlord-Friendly
- State Ohio
- 73 Landlord-Friendly · R+6
- County
- — inherits STATE
- City
- — inherits STATE
ZIP-level market 44123
- Home prices YoY
- -25.0%
- Rents YoY
- 5.3%
- Active inventory
- 96
- Price-to-rent
- 9.8×
Monthly cashflow live
- Estimated rent
- $2,387 high interval (Pro) →
- Mortgage (P&I)
- −$734
- Tax from tax record
- −$280 /mo · $3,354/yr
- Insurance
- −$58
- HOA
- −$0
- Vacancy / Maint / Mgmt
- −$501
- Net cashflow
- $814
Break-even live
Sensitivity live
| Price | -10% $893 | -5% $854 | +0% $814 | +5% $775 | +10% $735 |
|---|---|---|---|---|---|
| Rent | -10% $626 | -5% $720 | +0% $814 | +5% $909 | +10% $1,003 |
| Rate | -1.0pp $885 | -0.5pp $850 | base $814 | +0.5pp $778 | +1.0pp $741 |
2-unit breakdown (identical units grouped — click to expand)
| Units | Beds | Baths | Est. rent |
|---|---|---|---|
| 2× units | 2 | 1 | $2,386 |
| #1 | 2 | 1 | $1,193 |
| #2 | 2 | 1 | $1,193 |
| Total (2 units) | $2,387 | ||
UW: 25.0% down · 7.5% · 30yr · 1.5% tax · 5.0% vac · 8.0% maint · 8.0% mgmt
Financing live
Cash to close
- Down payment
- $34,975
- Closing costs
- $4,197
- Reserves months
- —
- Total cash needed
- —
Loan-product check · same deal, 3 products live
Conventional
25% down · 7.5% · 30yr
- Down + closing
- —
- Monthly P&I
- —
- Monthly cashflow
- —
- DSCR
- —
- Eligible?
- —
Personal DTI + credit; lowest rate.
DSCR
20% down · 8.5% · 30yr
- Down + closing
- —
- Monthly P&I
- —
- Monthly cashflow
- —
- DSCR
- —
- Eligible?
- —
No personal income docs; deal must DSCR.
Hard money
10% down · 12.0% · 12mo
- Down + closing
- —
- Monthly P&I
- —
- Monthly cashflow
- —
- DSCR
- —
- Eligible?
- —
Short-term bridge; refi at stabilization.
Rent comps 16 comps
| Address | Beds | Baths | Sqft | Rent | $/sqft | DOM | Units | Dist |
|---|---|---|---|---|---|---|---|---|
| 299 E 197th St Cleveland, OH | 4.0 | 2.0 | 1328 | $1,400 | $1.05 | 18d | 1 | 0.26mi |
| 19450 Monterey Ave Cleveland, OH | 5.0 | 1.5 | 1800 | $1,690 | $0.94 | 6d | 1 | 0.30mi |
| 20547 Fuller Ave Euclid, OH | 5.0 | 3.0 | 1600 | $1,800 | $1.12 | 18d | 1 | 0.32mi |
| 19330 Monterey Ave Cleveland, OH | 4.0 | 1.5 | 1578 | $1,450 | $0.92 | 3d | 1 | 0.33mi |
| 20500 Priday Ave Euclid, OH | 4.0 | 1.5 | 1698 | $1,750 | $1.03 | 46d | 1 | 0.34mi |
| 21271 Nicholas Ave Euclid, OH | 3.0 | 2.0 | 1300 | $1,689 | $1.30 | 45d | 1 | 0.41mi |
| 18800 Pasnow Ave Cleveland, OH | 3.0 | 1.0 | 1348 | $1,350 | $1.00 | 18d | 1 | 0.42mi |
| 21000 Crystal Ave Euclid, OH | 5.0 | 2.0 | 1512 | $2,150 | $1.42 | 19d | 1 | 0.49mi |
| 21251 S Lake Shore Blvd Euclid, OH | 3.0 | 2.0 | 1246 | $1,595 | $1.28 | 45d | 1 | 0.60mi |
| 21980 Ivan Ave Euclid, OH | 4.0 | 2.0 | 1348 | $1,350 | $1.00 | 45d | 1 | 0.63mi |
| 26200 S Lake Shr Euclid, OH | 3.0 | 1.5 | 1305 | $1,225 | $0.94 | 9d | 1 | 0.82mi |
| 21860 Roberts Ave Euclid, OH | 3.0 | 1.0 | 1253 | $1,450 | $1.16 | 9d | 1 | 0.85mi |
| 797 Babbitt Rd #22 Euclid, OH | 3.0 | 1.5 | 1360 | $1,600 | $1.18 | 45d | 1 | 1.30mi |
| 23214 Gay St Euclid, OH | 3.0 | 1.0 | 1634 | $1,864 | $1.14 | 25d | 1 | 1.43mi |
| 23901 Puritan Rd Euclid, OH | 3.0 | 1.0 | 1326 | $1,595 | $1.20 | 16d | 1 | 1.44mi |
| 655 E 240th St Euclid, OH | 3.0 | 1.0 | 1341 | $1,550 | $1.16 | 45d | 1 | 1.44mi |
Listing history 24 events
-
2026-04-28status Pending
-
2026-01-29status Pending
-
2026-01-22price $139,900
-
2026-01-20status Active
-
2026-01-07status Pending
-
2025-11-28historical $950
-
2025-11-21$950
-
2025-11-21historical $950
-
2025-11-20$950
-
2025-11-20historical $950
-
2025-11-20$149,000 Active
-
2025-10-09$950
-
2025-09-22historical $950
-
2025-08-02$950
-
2025-08-02historical $1,000
-
2025-07-27price $1,000
-
2025-07-05$1,050
-
2025-03-16historical $950
-
2025-02-15$950
-
2023-09-11historical $850
-
2023-08-18$850
-
2004-04-13soldstatus $86,000 282-char remark
Show marketing remark (282 chars)
Many Possibilities Here! Easy-to-rent Area With Quick Access To Freeway And Bus Lines. Currently Used As A Single Family, Home Is A Double, Per City. Up Unit Has Access To Attic Which Could Provide More Bedrooms. Home Needs Work. Buyer To Assume All City Violations. Needs Sold Now!
-
2004-04-13soldstatus $86,000
Show marketing remark (282 chars)
Many Possibilities Here! Easy-to-rent Area With Quick Access To Freeway And Bus Lines. Currently Used As A Single Family, Home Is A Double, Per City. Up Unit Has Access To Attic Which Could Provide More Bedrooms. Home Needs Work. Buyer To Assume All City Violations. Needs Sold Now!
-
2003-12-16$89,900 282-char remark
Show marketing remark (282 chars)
Many Possibilities Here! Easy-to-rent Area With Quick Access To Freeway And Bus Lines. Currently Used As A Single Family, Home Is A Double, Per City. Up Unit Has Access To Attic Which Could Provide More Bedrooms. Home Needs Work. Buyer To Assume All City Violations. Needs Sold Now!
ⓘ Source: listings_history table (triggers on properties + properties_extension) + one-shot
backfill from property_details.listing_events for pre-trigger history.
Tax reassessment forecast OH · Partial reset (capped growth)
- Current annual tax
- $3,354 · $280/mo
- Projected year-2 tax
- $3,354 · $280/mo
- Expected delta
- $0/yr ($0/mo · 0.0%)
ⓘ Screening estimate from a state-policy table — verify with the county assessor before closing.
Climate risk First Street
- Flood 1/10 Low FEMA zone X (unshaded) · 0% chance over 30 yrs
- Wildfire 1/10 Low
- Heat 3/10 Moderate 7 d/yr ≥94°F today · 17 d/yr by 30 yrs out
- Wind 1/10 Low
- Air quality 3/10 Moderate 3 unhealthy d/yr today · 4 by 30 yrs out
Nearby sold comps map
Loading sold comps map…
Walkable amenities ~0.75 mi
Loading nearby amenities…
Taxation est. · year 1
- Rental income
- $28,644
- − Mortgage interest
- −$7,837
- − Property taxes
- −$3,354
- − Insurance
- −$700
- − Repairs & maintenance
- −$2,292
- − Management
- −$2,292
- − Depreciation
- −$4,070
- Taxable income
- $8,101
- Est. tax owed @ 24.0%
- −$1,944
- After-tax cash flow
- $7,827/yr
For passive investors: Depreciation is non-cash, so a rental often shows a tax loss while cash-flowing — sheltering income. Rental losses are passive: they offset passive income freely, and up to $25,000/yr can offset ordinary (W-2) income if you actively participate and your MAGI is under $100k (phasing out to $0 by $150k); unused losses carry forward. On sale, claimed depreciation is recaptured at up to 25%, and gains may owe capital-gains tax (a 1031 exchange can defer both). Figures are a year-1 estimate at your 24.0% rate — not tax advice; consult a CPA.
Schools (NCES district)
- District
- Euclid City
- NCES district ID
- 3904395
- Math proficiency
- 14% ▼ -19.00%
- Reading proficiency
- 28% ▼ -14.00%
- Median HH income
- $36,385
- Composite
- 17.39/100
- National rank
- #9067
- State rank
- #625 of 656 in OH
Livability — Euclid
- Score
- 77/100
- State rank
- #204
- US rank
- #3149
Category grades
Schools grade is shown separately in the Schools card above.
Census & demographics
- Census place
- Euclid, OH
- County
- Cuyahoga County · 1,090,369 people
- City population
- 41,855
- Metro
- Cleveland-Elyria, OH
- Population (ZIP)
- 18,050
- Household income
- $55,676
- Rent vs Own
- Severe rent burden
- 1085.0
Population outlook (Cuyahoga County) Hauer SSP2
- Today (2025)
- 1,244,621 people
- By 2030
- 1,230,093 · -1.2%
- By 2040
- 1,189,108 · -4.5%
- By 2050
- 1,145,706 · -7.9%
- By 2075
- 1,076,557 · -13.5%
- By 2100
- 978,987 · -21.3%
Race, ethnicity, and origin ACS 2023
- Neighborhood character
- Majority Black (65%)
- Race & ethnicity
- Black 65% White 28% Two or more races 6% Hispanic / Latino 1%
- Common ancestry
- Romanian 5%
- Foreign-born
- 2% · Canada
- Languages at home
- 96% English-only · Spanish 2% Chinese 1%
Political lean MEDSL · Cuyahoga
- 2024 margin
- Solid D (+31.5) · D 65.4% · R 33.9%
- 2008→2024 swing
- -7.4pp toward R · 2008: 38.9pp · 2024: 31.5pp
- All cycles
- 2024: D+31.5 2020: D+34.1 2016: D+35.0 2012: D+38.7 2008: D+38.9
Not yet ingested
- Civics
- —
Market trends
- HPI YoY
- ▼ -62.82%
- Current HPI
- 188.4932
- Rent YoY
- ▲ 5.28%
- Metro
- Cleveland-Elyria, OH
- State GDP YoY
- ▲ 1.98%
- F500 in state
- 48
Industry mix (Fortune 500 HQ in OH)
| Industry | F500 HQs | Revenue |
|---|---|---|
| Insurance | 3 | $145B |
|
||
| Industrial Machinery | 3 | $49B |
|
||
| Financial Services | 3 | $24B |
|
||
| Consumer Goods | 2 | $93B |
|
||
| Aerospace / Defense | 2 | $47B |
|
||
| Utilities | 2 | $33B |
|
||
Price history
+55.6% since first listed24 events — show timeline
- 2026-04-28 Pending — MLSNOW
- 2026-01-29 Pending — MLSNOW
- 2026-01-22 Price Changed $139,900 MLSNOW
- 2026-01-20 Relisted — MLSNOW
- 2026-01-07 Pending — MLSNOW
- 2025-11-28 Rental Removed $950 RENTALBEAST
- 2025-11-21 Listed for Rent $950 RENTALBEAST
- 2025-11-21 Rental Removed $950 RENTALBEAST
- 2025-11-20 Listed for Rent $950 RENTALBEAST
- 2025-11-20 Rental Removed $950 BUILDIUM
- 2025-11-20 Listed $149,000 MLSNOW
- 2025-10-09 Listed for Rent $950 BUILDIUM
- 2025-09-22 Rental Removed $950 BUILDIUM
- 2025-08-02 Listed for Rent $950 BUILDIUM
- 2025-08-02 Rental Removed $1,000 RENTALBEAST
- 2025-07-27 Price Changed $1,000 RENTALBEAST
- 2025-07-05 Listed for Rent $1,050 RENTALBEAST
- 2025-03-16 Rental Removed $950 RENTALBEAST
- 2025-02-15 Listed for Rent $950 RENTALBEAST
- 2023-09-11 Rental Removed $850 BUILDIUM
- 2023-08-18 Listed for Rent $850 BUILDIUM
- 2004-04-13 Sold (Public Records) $86,000 Public Records
- 2004-04-13 Sold (MLS) $86,000 MLSNOW
- 2003-12-16 Listed $89,900 MLSNOW
Property tax history
+5.5%/yrLatest (2025): $3,354 · -2.8% YoY. Source: county tax records.
Cash-flow waterfall
monthlySold comps — $/sqft
last 12 mo · ≤1 miLoading sold comps…