12215 Wild Pine Dr Unit C · Houston, TX
Flood risk 7/10 · Major
- FEMA flood zone
- X (unshaded)
- Chance of flooding over 30 yrs
- 0.99%
- Est. flood insurance / yr
- $507 – $1,088
Fire risk 4/10 · Minor
- Est. fire insurance / yr
- $1,222 – $2,270
Heat risk 9/10 · Severe
- Hot days now (above 110°F)
- 7 days/yr
- Hot days in 30 yrs
- 24 days/yr
Wind risk 9/10 · Severe
- Chance of severe wind over 30 yrs
- 99.0%
Air-quality risk 3/10 · Minor
- Unhealthy air days now
- 3 days/yr
- Unhealthy air days in 30 yrs
- 3 days/yr
Risk factors via First Street. Map © Google.
Why this score? — see what drove the D grade
The composite is a weighted blend of 9 inputs, each scored 0–100. Each bar is that input's sub-score; the figure is the points it added to the 100-point composite (weight × sub-score).
- Cash flow +13.2/30.0
- ARV discount +10.2/15.0
- 1% rule +7.1/10.0
- DSCR +4.0/10.0
- Livability +3.7/5.0
- Rent growth +2.5/5.0
- Condition / age +2.5/5.0
- Schools +1.5/10.0
- Appreciation +0.0/10.0
$105,000
🖨 Deal sheet (PDF) 📄 Offer letter ✓ Due diligence
Listing remarks MLS
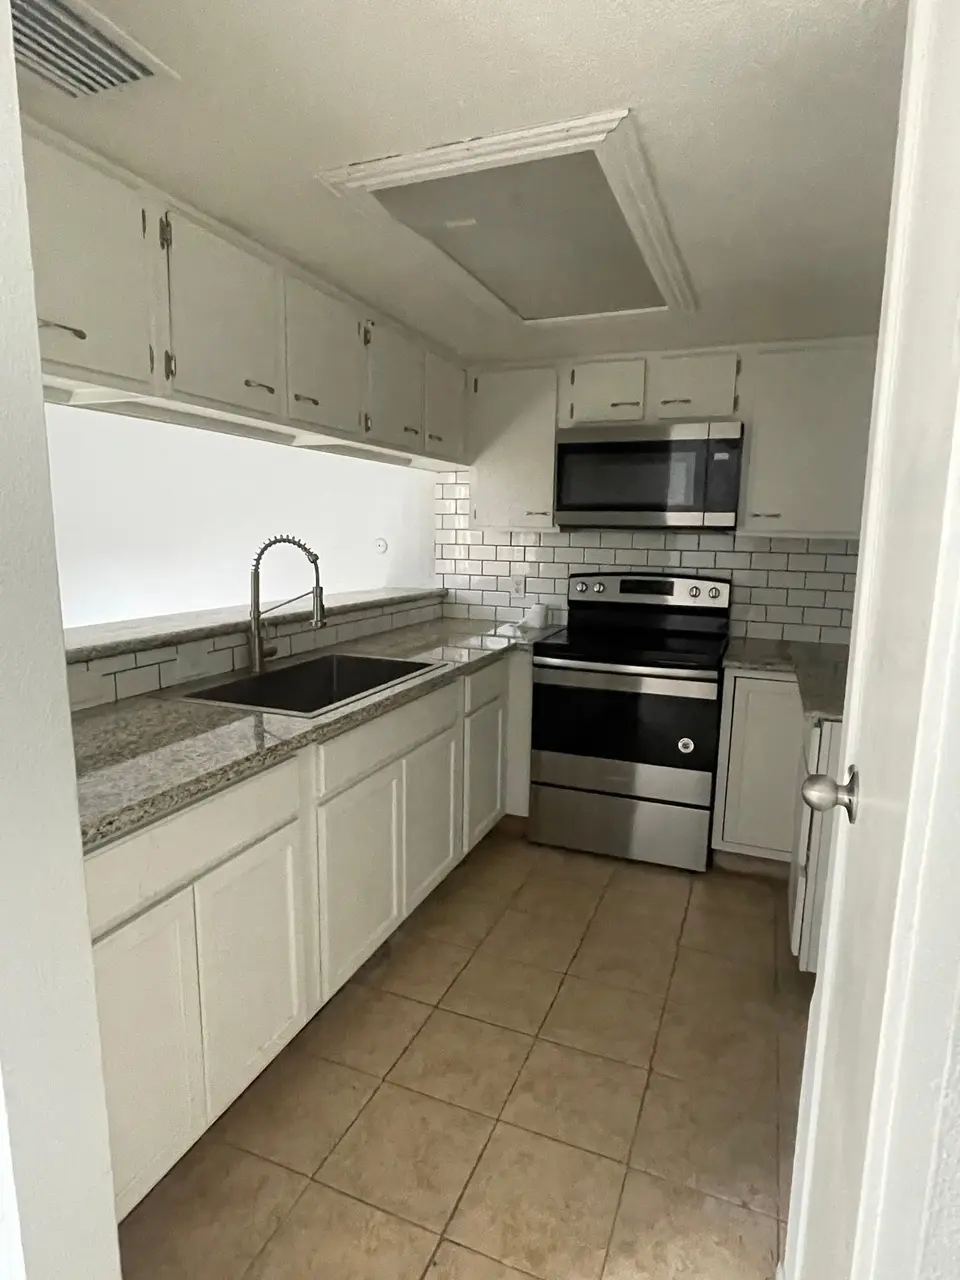
Two bedroom condo with easy access to US 59 and Intercontinental Airport. Trash is included in monthly HOA fee. Both bedrooms are downstairs, with a gameroom/flexroom upstairs. Two car attached garage. Corner Unit. Schedule your showing today. Home is currently occupied and needs 2 hrs notice.
Key facts
- Easy access to us 59
- Corner unit
- $168 HOA
Tags
Neighborhood map
What this means for you Summary
Snapshot
- This is a 2-bed/1.5-bath townhouse listed at $105k.
Deal economics
- At list price, monthly cash flow is $-69 ($-824/yr) — negative.
- To cash-flow at today's rent, offer at most $93k (11.6% below list).
- Meets the 1% rule at list price ($1k rent vs $105k).
- Recommended offer: $92k (12.0% below list) — sets the bar for market timing.
- Cap rate 6.3% vs local median 3.2% in Houston — top-decile yield for the area; either an underpriced asset or a hidden risk that comps aren't pricing in. Stress-test before assuming the spread holds.
Location & tenants
- Location reads 74/100 on livability (#184 in TX, #4,771 nationally) — a middle-class / working-renter tenant base. Strengths: amenities A+, cost of living A+, housing A+; Watch: crime F.
- Aldine ISD (suburban): math 16% / reading 21% proficiency, ranked #790 of 826 in TX (top 96%) — low school quality limits family demand, transient renter base, plan for 1-2y turnover; 79% free/reduced lunch — lower-income household profile, screen leases tightly.
- Zoned schools: Johnson El (math 14% / reading 11%, grade F, #4,167 of 4,322 statewide, top 97%, 597 students, 98% FRL); Hambrick Middle (math 12% / reading 22%, grade F, #1,520 of 1,662 statewide, top 92%, 1,021 students, 93% FRL); Macarthur H S (math 16% / reading 24%, grade F, #1,397 of 1,632 statewide, top 87%, 3,571 students, 85% FRL).
- Market conditions: 84 active listings in the ZIP; 11 comparable units currently listed for rent nearby; rentals at typical pace (median 24d on market — plan ~3-4 weeks tenant-placement turnaround); 29,883 units permitted in Harris County in 2024 (8,621 in 5+ unit buildings).
- This rent runs 32% of the median local income ($47k/yr) — at the standard rent-burdened threshold; future hikes will face affordability resistance.
Forward outlook
- Local home prices are declining (-3.0%/yr); year-one equity from $726 of loan paydown is wiped out by about $3k of value loss. Plan a longer hold.
- Harris County population projected at +47% by 2050 — long-run rental-demand tailwind backs the buy-and-hold thesis.
Negotiation context
- It's been on market 227 days — a 12% lower offer ($92k) is reasonable based on typical stale-listing flexibility.
- 12 sale attempts since 12y ago with the ask held roughly flat each time — persistent listings suggest the price (not the market) is what's stuck; bring a comps-based counter.
Risks & watch-outs
- Watch-outs: property tax is 2.7% of price; flood insurance adds $66/mo.
- Climate carrying-cost: major flood risk; severe wind risk, 99% chance of damaging wind over 30y; extreme-heat days projected 7→24/yr by 2055 (HVAC capex compounding) — expect insurance premiums to compound above CPI over the hold.
Questions for the listing agent
- What do current leases actually rent for vs. the listed asking? Can we see a recent rent roll and the last 12 months of T-12 income?
- It's been on market 227 days. Have you received any prior offers? Is the seller open to a 12% concession, seller financing, or rate buy-down credit?
- Built in 1979 — when were the roof, HVAC, electrical panel, plumbing, and water heater last replaced?
- Property tax is high relative to price — has the assessment been appealed recently, and will the sale trigger a re-assessment?
- What's the actual annual flood-insurance premium (NFIP or private), and is the property in a SFHA with mandatory coverage?
- What does the HOA fee cover, when was the last increase, and are there any pending special assessments or reserve-fund shortfalls?
- Why hasn't it sold? Are there any deal-killer items the seller is aware of (foundation, flood, title, zoning, code violations)?
- Is there a deadline driving the sale (1031 exchange, divorce, estate, relocation)? That informs how much negotiation room exists.
- Schools are D-rated, which usually means shorter tenancies and higher turnover. Who's the typical renter profile here, and what's been the actual vacancy rate?
- Crime grade is F in this area — have there been break-ins, vandalism, or insurance claims at this property in the last 3 years? What carrier currently insures it and at what premium?
- The area grade is low — what's the realistic commute time and amenity access for the typical tenant pool here? Any planned neighborhood developments (good or bad) we should know about?
- What's the average days-on-market for RENTAL listings here right now (not sales)? A rising rental-DOM trend means longer vacancies and softer asking-rent achievability than the comps imply.
- What's the recent tenant-quality profile in this submarket — average credit score on applications, eviction rate, late-payment / NSF rate, and stable-employment percentage? A property-management company in the area should have these aggregated.
- How much new for-sale + rental construction is in the pipeline within 1–3 miles? Heavy new supply typically softens prices + rents 12–24 months out; constrained supply supports both.
Investment metrics
- 1% rule
- 1.21% ✓
- Cap rate
- 6.27%
- Cash-on-cash
- -0.09%
- DSCR
- 1.00
- GRM
- 6.9
CMA / ARV
- ARV (median comp)
- $111,742
- List price
- $105,000
- Delta
- -6.03%
- Verdict
- FAIR
- Comps
- 20 within 1.0 mi
Show comp detail 12 sales within ~0.75 mi
| Address | Dist | Beds/Ba | Sqft | Sold | Price | $/sf | Match |
|---|---|---|---|---|---|---|---|
| 12339 W Village Dr Unit D | 0.19mi | 2/1.5 | 1,340 (0%) | 12mo | $55,000 | $41 | 81 |
| 12282 Wild Pine Dr Unit A | 0.12mi | 2/2.0 | 1,313 (-2%) | 11mo | $99,900 | $76 | 80 |
| 5618 Easthampton Dr Unit D | 0.19mi | 2/1.5 | 1,411 (+5%) | 4mo | $64,900 | $46 | 79 |
| 12315 W Village Dr Unit A | 0.21mi | 2/1.5 | 1,340 (0%) | 16mo | $88,000 | $66 | 77 |
| 12306 Wild Pine Dr Unit D | 0.11mi | 2/2.5 | 1,196 (-11%) | 4mo | $69,000 | $58 | 69 |
| 12439 W Village Dr Unit B | 0.27mi | 3/2.5 (+1) | 1,320 (-2%) | 15mo | $110,000 | $83 | 64 |
| 5714 Easthampton Dr Unit C | 0.16mi | 3/2.5 (+1) | 1,527 (+14%) | 4mo | $125,000 | $82 | 57 |
| 5710 Easthampton Dr Unit D | 0.17mi | 2/2.0 | 1,200 (-10%) | 20mo | $100,000 | $83 | 56 |
| 12307 W Village Dr Unit C | 0.18mi | 3/2.0 (+1) | 1,491 (+11%) | 15mo | $135,700 | $91 | 54 |
| 12419 W Village Dr Unit A | 0.28mi | 2/1.5 | 1,526 (+14%) | 13mo | $58,000 | $38 | 53 |
| 5715 Easthampton Dr Unit D | 0.12mi | 3/2.0 (+1) | 1,493 (+11%) | 19mo | $160,000 | $107 | 53 |
| 12206 Northwood Forest Dr #3 | 0.73mi | 2/2.5 | 1,224 (-9%) | 17mo | $129,900 | $106 | 33 |
Match score weights: distance 35% · size 25% · config 20% · recency 20%. Top-matched comps best support the ARV.
Projected returns pro-forma
-3.0% appreciation · 3.0% rent growth · sell at horizon
- IRR
- -20.7%
- Equity multiple
- 0.28×
- Total profit
- $-21,159
- Equity at exit
- $15,656
- IRR
- -13.3%
- Equity multiple
- 0.21×
- Total profit
- $-23,125
- Equity at exit
- $9,078
Cash invested: $29,400 (down + closing). Projections, not guarantees.
Landlord ↔ Tenant lean methodology
- Overall (STATE)
- 87 Strongly Landlord-Friendly
- State Texas
- 87 Strongly Landlord-Friendly · R+5
- County
- — inherits STATE
- City
- — inherits STATE
ZIP-level market 77039
- Home prices YoY
- -20.7%
- Active inventory
- 84
- Price-to-rent
- 6.9×
Monthly cashflow live
- Estimated rent
- $1,266 high interval (Pro) →
- Mortgage (P&I)
- −$551
- Tax from tax record
- −$240 /mo · $2,877/yr
- Insurance
- −$44
- Flood insurance flood zone
- −$66 /mo · $798/yr
- HOA
- −$168
- Vacancy / Maint / Mgmt
- −$266
- Net cashflow
- $-69
Break-even live
Sensitivity live
| Price | -10% $-9 | -5% $-39 | +0% $-69 | +5% $-98 | +10% $-128 |
|---|---|---|---|---|---|
| Rent | -10% $-169 | -5% $-119 | +0% $-69 | +5% $-19 | +10% $31 |
| Rate | -1.0pp $-16 | -0.5pp $-42 | base $-69 | +0.5pp $-96 | +1.0pp $-124 |
UW: 25.0% down · 7.5% · 30yr · 1.5% tax · 5.0% vac · 8.0% maint · 8.0% mgmt
Financing live
Cash to close
- Down payment
- $26,250
- Closing costs
- $3,150
- Reserves months
- —
- Total cash needed
- —
Loan-product check · same deal, 3 products live
Conventional
25% down · 7.5% · 30yr
- Down + closing
- —
- Monthly P&I
- —
- Monthly cashflow
- —
- DSCR
- —
- Eligible?
- —
Personal DTI + credit; lowest rate.
DSCR
20% down · 8.5% · 30yr
- Down + closing
- —
- Monthly P&I
- —
- Monthly cashflow
- —
- DSCR
- —
- Eligible?
- —
No personal income docs; deal must DSCR.
Hard money
10% down · 12.0% · 12mo
- Down + closing
- —
- Monthly P&I
- —
- Monthly cashflow
- —
- DSCR
- —
- Eligible?
- —
Short-term bridge; refi at stabilization.
Rent comps 11 comps
| Address | Beds | Baths | Sqft | Rent | $/sqft | DOM | Units | Dist |
|---|---|---|---|---|---|---|---|---|
| 5001 Aldine Mail Route Rd Houston, TX | 1.0–5.0 | 1.0–2.5 | 1065 | $1,006 | $0.94 | 45d | 16 | 0.66mi |
| 11610 Danford Ln Unit B Houston, TX | 3.0 | 2.0 | 1150 | $1,750 | $1.52 | 45d | 1 | 1.05mi |
| 11435 Raincove Dr Unit A Houston, TX | 3.0 | 1.0 | 1000 | $1,345 | $1.34 | 5d | 1 | 1.18mi |
| 5526 Rotan Dr Houston, TX | 3.0 | 2.0 | 1050 | $900 | $0.86 | 20d | 1 | 1.31mi |
| 4610 Anice St Houston, TX | 3.0 | 2.0 | 1786 | $1,566 | $0.88 | 14d | 1 | 1.31mi |
| 4505 Aldine Mail Rte Rd Houston, TX | 1.0–2.0 | 1.0–2.0 | 787 | $1,350 | $1.71 | 2d | 6 | 1.31mi |
| 4505 Aldine Mail Route Rd Unit 712 Houston, TX | 2.0 | 2.0 | 929 | $1,325 | $1.43 | 45d | 1 | 1.35mi |
| 4335 Aldine Mail Route Rd Houston, TX | 1.0–3.0 | 1.0–2.0 | 936 | $1,118 | $1.19 | 3d | 7 | 1.42mi |
| 4335 Aldine Mail Route Rd Houston, TX | 2.0 | 1.0–2.0 | 872 | $983 | $1.13 | 23d | 6 | 1.42mi |
| 4341 Aldine Mail Route Rd Houston, TX | 2.0 | 2.0 | 929 | $1,107 | $1.19 | 45d | 1 | 1.43mi |
| 4341 Aldine Mail Route Rd Houston, TX | 2.0 | 2.0 | 929 | $1,107 | $1.19 | 23d | 1 | 1.43mi |
HOA detail
- Monthly dues
- $168 · $2,016/yr
- Likely covers
- trash
Listing history 50 events
-
2026-06-21days on market $105,000 Active 227 DOM
-
2026-06-18days on market $105,000 Active 224 DOM
-
2026-06-17days on market $105,000 Active 223 DOM
-
2026-06-16days on market $105,000 Active 222 DOM
-
2026-06-15days on market $105,000 Active 221 DOM
-
2026-06-13days on market $105,000 Active 219 DOM
-
2026-06-13days on market $105,000 Active 218 DOM
-
2026-06-09days on market $105,000 Active 215 DOM
-
2026-06-08days on market $105,000 Active 214 DOM
-
2026-06-07days on market $105,000 Active 213 DOM
-
2026-06-04days on market $105,000 Active 210 DOM
-
2026-06-03days on market $105,000 Active 209 DOM
-
2026-06-02days on market $105,000 Active 208 DOM
-
2026-06-01days on market $105,000 Active 207 DOM
-
2026-05-31days on market $105,000 Active 206 DOM
-
2025-11-06$105,000 Active 297-char remark
Show marketing remark (297 chars)
Two bedroom condo with easy access to US 59 and Intercontinental Airport. Trash is included in monthly HOA fee. Both bedrooms are downstairs, with a gameroom/flexroom upstairs. Two car attached garage. Corner Unit. Schedule your showing today. Home is currently occupied and needs 2 hrs notice.
-
2025-11-01historical
-
2025-05-17$105,000 Active
-
2023-06-01historical
-
2023-05-05price $100,000
-
2023-04-14price $101,500
-
2023-04-04status Active
-
2023-03-10status Pending
-
2023-03-02status Option Pending
-
2023-02-03price $103,000
-
2023-01-17price $105,000
-
2022-12-08$110,000 Active
-
2022-11-30historical
-
2022-10-24status Active
-
2022-09-05status Pending
-
2022-08-31status Option Pending
-
2022-07-28price $115,000
-
2022-06-02$125,000 Active
-
2020-01-09historical
-
2019-12-20$55,000 Active
-
2019-12-16historical
-
2019-03-11price $70,000
-
2018-07-30$77,000 Active
-
2015-09-03soldstatus
-
2015-05-27historical
-
2015-04-22$40,900 Active
-
2015-02-01historical
-
2014-12-03$40,900 Active
-
2014-11-21historical
-
2014-11-07price $40,900
-
2014-11-06price $41,900
-
2014-09-16$42,900 Active
-
2014-08-11historical
-
2014-05-09price $41,000
-
2014-02-26$43,000 Active
ⓘ Source: listings_history table (triggers on properties + properties_extension) + one-shot
backfill from property_details.listing_events for pre-trigger history.
Tax reassessment forecast TX · Resets to sale price
- Current annual tax
- $2,877 · $240/mo
- Projected year-2 tax
- $2,877 · $240/mo
- Expected delta
- $0/yr ($0/mo · 0.0%)
ⓘ Screening estimate from a state-policy table — verify with the county assessor before closing.
Climate risk First Street
- Flood 7/10 Severe FEMA zone X (unshaded) · 99% chance over 30 yrs
- Wildfire 4/10 Moderate
- Heat 9/10 Extreme 7 d/yr ≥110°F today · 24 d/yr by 30 yrs out
- Wind 9/10 Extreme 99% chance of damaging wind over 30 yrs
- Air quality 3/10 Moderate 3 unhealthy d/yr today · 3 by 30 yrs out
Nearby sold comps map
Loading sold comps map…
Walkable amenities ~0.75 mi
Loading nearby amenities…
Taxation est. · year 1
- Rental income
- $15,188
- − Mortgage interest
- −$5,882
- − Property taxes
- −$2,877
- − Insurance
- −$1,322
- − Repairs & maintenance
- −$1,215
- − Management
- −$1,215
- − HOA
- −$2,016
- − Depreciation
- −$3,055
- Taxable loss
- −$2,393
- Est. tax savings @ 24.0%
- +$574
- After-tax cash flow
- $-250/yr
For passive investors: Depreciation is non-cash, so a rental often shows a tax loss while cash-flowing — sheltering income. Rental losses are passive: they offset passive income freely, and up to $25,000/yr can offset ordinary (W-2) income if you actively participate and your MAGI is under $100k (phasing out to $0 by $150k); unused losses carry forward. On sale, claimed depreciation is recaptured at up to 25%, and gains may owe capital-gains tax (a 1031 exchange can defer both). Figures are a year-1 estimate at your 24.0% rate — not tax advice; consult a CPA.
Schools (NCES district)
- District
- Aldine ISD
- NCES district ID
- 4807710
- Math proficiency
- 16% ▼ -23.00%
- Reading proficiency
- 21% ▼ -11.00%
- Median HH income
- $37,081
- Composite
- 15.42/100
- National rank
- #9317
- State rank
- #790 of 826 in TX
Livability — Houston
- Score
- 74/100
- State rank
- #184
- US rank
- #4771
Category grades
Schools grade is shown separately in the Schools card above.
Census & demographics
- County
- Harris County · 4,702,590 people
- City population
- 3,226,434
- Metro
- Houston-The Woodlands-Sugar Land, TX
- Population (ZIP)
- 27,862
- Household income
- $47,119
- Rent vs Own
- Severe rent burden
- 1128.0
Population outlook (Harris County) Hauer SSP2
- Today (2025)
- 5,571,493 people
- By 2030
- 6,089,821 · +9.3%
- By 2040
- 7,142,806 · +28.2%
- By 2050
- 8,185,864 · +46.9%
- By 2075
- 10,574,329 · +89.8%
- By 2100
- 12,109,958 · +117.4%
Race, ethnicity, and origin ACS 2023
- Neighborhood character
- Predominantly Hispanic (84%)
- Race & ethnicity
- Hispanic / Latino 84% Two or more races 15% Black 9% White 5% Asian 2% Native American 1%
- Hispanic origin (detail)
- Mexican 71%
- Foreign-born
- 38% · Canada
- Languages at home
- 25% English-only · Spanish 74% Other Asian/Pacific 1%
Political lean MEDSL · Harris
- 2024 margin
- Lean D (+5.5) · D 52.0% · R 46.4% · Other 1.6%
- 2008→2024 swing
- +3.9pp toward D · 2008: 1.6pp · 2024: 5.5pp
- All cycles
- 2024: D+5.5 2020: D+13.3 2016: D+12.4 2012: D+0.1 2008: D+1.6
Not yet ingested
- Civics
- —
Market trends
- HPI YoY
- ▼ -82.88%
- Current HPI
- 316.66
- Rent YoY
- —
- Metro
- Houston-The Woodlands-Sugar Land, TX
- State GDP YoY
- ▲ 3.95%
- F500 in state
- 110
Industry mix (Fortune 500 HQ in TX)
| Industry | F500 HQs | Revenue |
|---|---|---|
| Energy | 16 | $1,198B |
|
||
| Technology | 5 | $198B |
|
||
| Engineering / Construction | 4 | $72B |
|
||
| Energy Services | 3 | $60B |
|
||
| Utilities | 3 | $41B |
|
||
| Healthcare | 2 | $330B |
|
||
Price history
-72.0% since first listed37 events — show timeline
- 2025-11-06 Listed $105,000 HARMLS
- 2025-11-01 Listing Removed — HARMLS
- 2025-05-17 Listed $105,000 HARMLS
- 2023-06-01 Listing Removed — HARMLS
- 2023-05-05 Price Changed $100,000 HARMLS
- 2023-04-14 Price Changed $101,500 HARMLS
- 2023-04-04 Relisted — HARMLS
- 2023-03-10 Pending — HARMLS
- 2023-03-02 Pending — HARMLS
- 2023-02-03 Price Changed $103,000 HARMLS
- 2023-01-17 Price Changed $105,000 HARMLS
- 2022-12-08 Listed $110,000 HARMLS
- 2022-11-30 Listing Removed — HARMLS
- 2022-10-24 Relisted — HARMLS
- 2022-09-05 Pending — HARMLS
- 2022-08-31 Pending — HARMLS
- 2022-07-28 Price Changed $115,000 HARMLS
- 2022-06-02 Listed $125,000 HARMLS
- 2020-01-09 Listing Removed — HARMLS
- 2019-12-20 Listed $55,000 HARMLS
- 2019-12-16 Listing Removed — HARMLS
- 2019-03-11 Price Changed $70,000 HARMLS
- 2018-07-30 Listed $77,000 HARMLS
- 2015-09-03 Sold (Public Records) — Public Records
- 2015-05-27 Listing Removed — HARMLS
- 2015-04-22 Listed $40,900 HARMLS
- 2015-02-01 Listing Removed — HARMLS
- 2014-12-03 Listed $40,900 HARMLS
- 2014-11-21 Listing Removed — HARMLS
- 2014-11-07 Price Changed $40,900 HARMLS
- 2014-11-06 Price Changed $41,900 HARMLS
- 2014-09-16 Listed $42,900 HARMLS
- 2014-08-11 Listing Removed — HARMLS
- 2014-05-09 Price Changed $41,000 HARMLS
- 2014-02-26 Listed $43,000 HARMLS
- 2008-08-05 Sold (Public Records) $375,000 Public Records
- 1990-10-25 Sold (Public Records) — Public Records
Property tax history
+12.8%/yrLatest (2025): $2,877 · -0.5% YoY. Source: county tax records.
Cash-flow waterfall
monthlySold comps — $/sqft
last 12 mo · ≤1 miLoading sold comps…