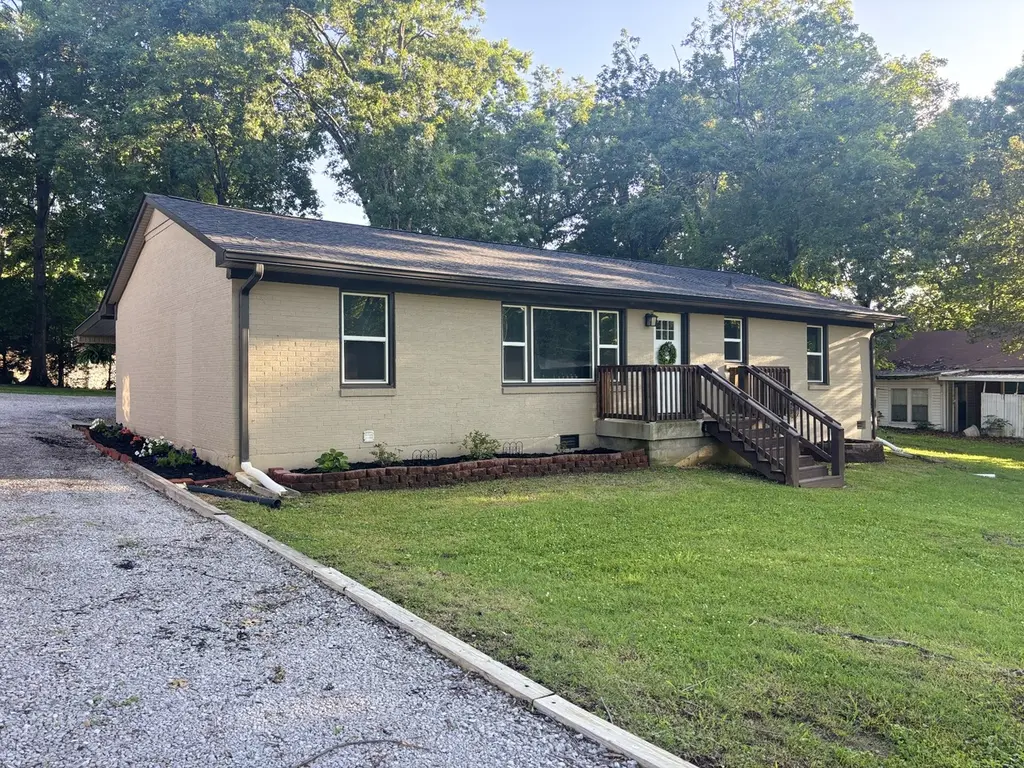
916 Battery Dr · Lewisburg, TN
Flood risk 1/10 · Minimal
- FEMA flood zone
- X (unshaded)
- Chance of flooding over 30 yrs
- 0.0%
- Est. flood insurance / yr
- $473 – $860
Fire risk 4/10 · Minor
- Est. fire insurance / yr
- $949 – $1,763
Heat risk 5/10 · Moderate
- Hot days now (above 105°F)
- 7 days/yr
- Hot days in 30 yrs
- 20 days/yr
Wind risk 4/10 · Minor
- Chance of severe wind over 30 yrs
- 12.0%
Air-quality risk 1/10 · Minimal
- Unhealthy air days now
- 0 days/yr
- Unhealthy air days in 30 yrs
- 0 days/yr
Risk factors via First Street. Map © Google.
Why this score? — see what drove the B- grade
The composite is a weighted blend of 9 inputs, each scored 0–100. Each bar is that input's sub-score; the figure is the points it added to the 100-point composite (weight × sub-score).
- Cash flow +30.0/30.0
- DSCR +10.0/10.0
- 1% rule +8.0/10.0
- ARV discount +6.8/15.0
- Livability +3.0/5.0
- Schools +2.6/10.0
- Rent growth +2.5/5.0
- Condition / age +2.5/5.0
- Appreciation +0.0/10.0
$299,000
🖨 Deal sheet 📄 Offer letter ✓ Due diligence
Listing remarks MLS
Looking for that park like setting for you new home?! This beautiful all brick 3BR 1 Bath completely renovated home has everything you are looking for!! New Features include: Roof, Windows, Painted Exterior, PEX plumbing, tile in kitchen and bath, kitchen cabinets, countertops, REAL hardwood floors, trim, paint, fixtures, facia, soffit, gutters, list goes on and on. Property even includes a covered patio and 24x12 workshop/storage bldg with electricity and gas heat. Extremely hard to find!!!
Key facts
- 0.36 acre lot
- 4 parking spots
- Built 1963
Property features AI
Exterior
- Parking: Four open parking spaces (total 4 parking spaces)
- Utilities: Public water; Public sewer; Natural gas available
- Home design: Single-family residence; One story; Renovated
- Construction: Brick construction; Shingle roof; Crawl space foundation; Built/renovated (year listed as renovated)
- Exterior features: Covered patio; Level lot; Storage structure
Interior
- Kitchen: Gas oven; Gas range; Dishwasher; Microwave; Stainless steel appliances
- Bedrooms: Three bedrooms (all on the main level); Bedroom sizes: 15 x 13, 13 x 13, 13 x 11
- Flooring: Wood; Tile; Vinyl
- Bathrooms: One full bathroom
- Heating & cooling: Central heating (natural gas); Central air conditioning
- Interior features: Ceiling fan(s)
- Laundry & utility: Washer hookup; Electric dryer hookup
Neighborhood map
What this means for you Summary
Snapshot
- This is a 3-bed/1.0-bath single-family listed at $299k.
Deal economics
- At list price, monthly cash flow is $1k ($15k/yr) — positive.
- The deal already cash-flows at list — no discount required.
- Meets the 1% rule at list price ($4k rent vs $299k).
- Recommended offer: $295k (1.5% below list) — sets the bar for market timing.
- Cap rate 11.3% vs local median 3.6% in Lewisburg — top-decile yield for the area; either an underpriced asset or a hidden risk that comps aren't pricing in. Stress-test before assuming the spread holds.
Location & tenants
- Location reads 59/100 on livability (#284 in TN) — a working-class tenant base; expect higher turnover. Strengths: cost of living A+, housing A+, health & safety A+; Watch: crime F, amenities F, commute F.
- Marshall County (rural): math 31% / reading 29% proficiency, ranked #58 of 139 in TN (top 42%) — families likely to look elsewhere, expect single-tenant / working-renter base with shorter leases.
- Zoned schools: Marshall Elementary (math 27% / reading 27%, grade F, #496 of 952 statewide, top 55%, 388 students, 0% FRL); Marshall Co High School (math 17% / reading 35%, grade F, #117 of 332 statewide, top 37%, 815 students, 0% FRL) — zoned schools average 0% FRL vs 48% district-wide (48 pts lower); this property's tenant base skews higher-income than the district average.
- Market conditions: 274 active listings in the ZIP; 4 comparable units currently listed for rent nearby; rentals lingering (median 44d on market — plan ~5-8 weeks vacancy on turnover, expect pricing pressure); 75% of comp listings sitting > 30 days — soft ceiling on asking rent; 400 units permitted in Marshall County in 2024 (75 in 5+ unit buildings).
Forward outlook
- Local home prices are declining (-3.0%/yr); year-one equity from $2k of loan paydown is wiped out by about $9k of value loss. Plan a longer hold.
- Marshall County population projected at +5% by 2050 — modest demand growth; plan on rents tracking national, not racing it.
- At projected returns (-3.0% appreciation + 3.0% rent growth), your $84k cash investment doubles in ~7 years — after that, you're playing with house money.
Negotiation context
- It's been on market 15 days — a 2% lower offer ($295k) is reasonable based on typical stale-listing flexibility.
- Current owner paid $221k; 35% above their basis — modest negotiation headroom, anchor on the comps not their cost.
Risks & watch-outs
- Climate carrying-cost: extreme-heat days projected 7→20/yr by 2055 (HVAC capex compounding) — expect insurance premiums to compound above CPI over the hold.
Questions for the listing agent
- Built in 1963 — when were the roof, HVAC, electrical panel, plumbing, and water heater last replaced?
- Is there a deadline driving the sale (1031 exchange, divorce, estate, relocation)? That informs how much negotiation room exists.
- Schools are F-rated, which usually means shorter tenancies and higher turnover. Who's the typical renter profile here, and what's been the actual vacancy rate?
- Crime grade is F in this area — have there been break-ins, vandalism, or insurance claims at this property in the last 3 years? What carrier currently insures it and at what premium?
- What's the average days-on-market for RENTAL listings here right now (not sales)? A rising rental-DOM trend means longer vacancies and softer asking-rent achievability than the comps imply.
- What's the recent tenant-quality profile in this submarket — average credit score on applications, eviction rate, late-payment / NSF rate, and stable-employment percentage? A property-management company in the area should have these aggregated.
- How much new for-sale + rental construction is in the pipeline within 1–3 miles? Heavy new supply typically softens prices + rents 12–24 months out; constrained supply supports both.
Investment metrics
- 1% rule
- 1.30% ✓
- Cap rate
- 11.29%
- Cash-on-cash
- 17.83%
- DSCR
- 1.79
- GRM
- 6.4
CMA / ARV
- ARV (on-the-fly)
- $294,372
- Comps found
- 12
Show comp detail 12 sales within ~0.75 mi
| Address | Dist | Beds/Ba | Sqft | Sold | Price | $/sf | Match |
|---|---|---|---|---|---|---|---|
| 930 Oak St | 0.06mi | 3/2.0 | 1,361 (+3%) | 9mo | $240,000 | $176 | 82 |
| 330 Hickory Cir | 0.05mi | 3/2.0 | 1,248 (-6%) | 5mo | $265,000 | $212 | 79 |
| 411 Elm Ave | 0.15mi | 3/2.0 | 1,200 (-10%) | 3mo | $289,000 | $241 | 70 |
| 301 East Ave | 0.35mi | 3/1.0 | 1,256 (-5%) | 7mo | $150,000 | $119 | 69 |
| 131 Isabela Dr | 0.20mi | 3/2.0 | 1,172 (-12%) | 3mo | $269,900 | $230 | 65 |
| 1080 Finley Beech Rd | 0.42mi | 3/2.0 | 1,359 (+2%) | 10mo | $305,000 | $224 | 64 |
| 371 Elm Ave | 0.22mi | 3/2.0 | 1,200 (-10%) | 8mo | $275,000 | $229 | 63 |
| 948 Oak St | 0.08mi | 3/2.0 | 1,497 (+13%) | 12mo | $271,000 | $181 | 61 |
| 188 Trey Dr | 0.38mi | 3/2.0 | 1,430 (+8%) | 5mo | $275,000 | $192 | 61 |
| 141 Isabela Dr | 0.23mi | 3/2.0 | 1,172 (-12%) | 6mo | $259,900 | $222 | 61 |
| 310 Lexie Dr | 0.53mi | 3/2.0 | 1,354 (+2%) | 10mo | $315,000 | $233 | 60 |
| 155 Landon Ln | 0.47mi | 3/2.0 | 1,158 (-13%) | 2mo | $255,000 | $220 | 51 |
Match score weights: distance 35% · size 25% · config 20% · recency 20%. Top-matched comps best support the ARV.
Projected returns pro-forma
-3.0% appreciation · 3.0% rent growth · sell at horizon
- IRR
- 9.3%
- Equity multiple
- 1.37×
- Total profit
- $30,689
- Equity at exit
- $44,582
- IRR
- 18.5%
- Equity multiple
- 2.53×
- Total profit
- $128,401
- Equity at exit
- $25,852
Cash invested: $83,720 (down + closing). Projections, not guarantees.
Landlord ↔ Tenant lean methodology
- Overall (STATE)
- 87 Strongly Landlord-Friendly
- State Tennessee
- 87 Strongly Landlord-Friendly · R+13
- County
- — inherits STATE
- City
- — inherits STATE
ZIP-level market 37091
- Home prices YoY
- -14.6%
- Active inventory
- 274
- Price-to-rent
- 6.4×
Monthly cashflow live
- Estimated rent
- $3,900 medium interval (Pro) →
- Mortgage (P&I)
- −$1,568
- Tax from tax record
- −$144 /mo · $1,730/yr
- Insurance
- −$125
- HOA
- −$0
- Vacancy / Maint / Mgmt
- −$819
- Net cashflow
- $1,244
Break-even live
UW: 25.0% down · 7.5% · 30yr · 1.5% tax · 5.0% vac · 8.0% maint · 8.0% mgmt
Financing live
Cash to close
- Down payment
- $74,750
- Closing costs
- $8,970
- Reserves months
- —
- Total cash needed
- —
Loan-product check · same deal, 3 products live
Conventional
25% down · 7.5% · 30yr
- Down + closing
- —
- Monthly P&I
- —
- Monthly cashflow
- —
- DSCR
- —
- Eligible?
- —
Personal DTI + credit; lowest rate.
DSCR
20% down · 8.5% · 30yr
- Down + closing
- —
- Monthly P&I
- —
- Monthly cashflow
- —
- DSCR
- —
- Eligible?
- —
No personal income docs; deal must DSCR.
Hard money
10% down · 12.0% · 12mo
- Down + closing
- —
- Monthly P&I
- —
- Monthly cashflow
- —
- DSCR
- —
- Eligible?
- —
Short-term bridge; refi at stabilization.
Rent comps 4 comps
| Address | Beds | Baths | Sqft | Rent | $/sqft | DOM | Units | Dist |
|---|---|---|---|---|---|---|---|---|
| 328 E Church St Lewisburg, TN | 2.0 | 2.0 | 1000 | $4,000 | $4.00 | 43d | 1 | 0.83mi |
| 335 E Hill Ave Lewisburg, TN | 3.0 | 2.0 | 1800 | $5,000 | $2.78 | 43d | 1 | 0.87mi |
| 566 1st Ave N Lewisburg, TN | 2.0 | 1.0 | 950 | $2,250 | $2.37 | 43d | 1 | 1.16mi |
| 423 4th Ave N Lewisburg, TN | 2.0 | 1.0 | 1086 | $790 | $0.73 | 23d | 1 | 1.25mi |
Listing history 10 events
-
2026-06-18days on market $299,000 Active 15 DOM
-
2026-06-17days on market $299,000 Active 14 DOM
-
2026-06-16days on market $299,000 Active 13 DOM
-
2026-06-15days on market $299,000 Active 12 DOM
-
2026-06-13days on market $299,000 Active 10 DOM
-
2026-06-09days on market $299,000 Active 6 DOM
-
2026-06-08days on market $299,000 Active 5 DOM
-
2026-06-07statusdays on market $299,000 Active 4 DOM
-
2026-06-02remarks 495-char remark
-
2026-06-02$299,000 Coming Soon 1 DOM
ⓘ Source: listings_history table (triggers on properties + properties_extension) + one-shot
backfill from property_details.listing_events for pre-trigger history.
Tax reassessment forecast TN · Resets to sale price
- Current annual tax
- $1,730 · $144/mo
- Projected year-2 tax
- $2,123 · $177/mo
- Expected delta
- +$393/yr (+$33/mo · 22.7%)
ⓘ Screening estimate from a state-policy table — verify with the county assessor before closing.
Climate risk First Street
- Flood 1/10 Low FEMA zone X (unshaded) · 0% chance over 30 yrs
- Wildfire 4/10 Moderate
- Heat 5/10 Major 7 d/yr ≥105°F today · 20 d/yr by 30 yrs out
- Wind 4/10 Moderate 12% chance of damaging wind over 30 yrs
- Air quality 1/10 Low 0 unhealthy d/yr today · 0 by 30 yrs out
Nearby sold comps map
Loading sold comps map…
Walkable amenities ~0.75 mi
Loading nearby amenities…
Taxation est. · year 1
- Rental income
- $46,794
- − Mortgage interest
- −$16,749
- − Property taxes
- −$1,730
- − Insurance
- −$1,495
- − Repairs & maintenance
- −$3,744
- − Management
- −$3,744
- − Depreciation
- −$8,698
- Taxable income
- $10,635
- Est. tax owed @ 24.0%
- −$2,552
- After-tax cash flow
- $12,374/yr
For passive investors: Depreciation is non-cash, so a rental often shows a tax loss while cash-flowing — sheltering income. Rental losses are passive: they offset passive income freely, and up to $25,000/yr can offset ordinary (W-2) income if you actively participate and your MAGI is under $100k (phasing out to $0 by $150k); unused losses carry forward. On sale, claimed depreciation is recaptured at up to 25%, and gains may owe capital-gains tax (a 1031 exchange can defer both). Figures are a year-1 estimate at your 24.0% rate — not tax advice; consult a CPA.
Schools (NCES district)
- District
- Marshall County
- NCES district ID
- 4702670
- Math proficiency
- 31% ▼ -9.00%
- Reading proficiency
- 29% ▼ -5.00%
- Median HH income
- $43,058
- Composite
- 25.56/100
- National rank
- #7426
- State rank
- #58 of 139 in TN
Livability — Lewisburg
- Score
- 59/100
- State rank
- #284
- US rank
- #20031
Category grades
Schools grade is shown separately in the Schools card above.
Census & demographics
- Census place
- Lewisburg, TN
- Population (ZIP)
- 23,991
Population outlook (Marshall County) Hauer SSP2
- Today (2025)
- 33,222 people
- By 2030
- 33,867 · +1.9%
- By 2040
- 34,743 · +4.6%
- By 2050
- 34,954 · +5.2%
- By 2075
- 34,652 · +4.3%
- By 2100
- 31,862 · -4.1%
Race, ethnicity, and origin ACS 2023
- Neighborhood character
- Predominantly White (82%)
- Race & ethnicity
- White 82% Hispanic / Latino 8% Black 5% Two or more races 4%
- Hispanic origin (detail)
- Mexican 7%
- Common ancestry
- Serbian 4% Slovak 2% Romanian 1%
- Foreign-born
- 3% · Canada, Jamaica, Vietnam
- Languages at home
- 92% English-only · Spanish 7%
Political lean MEDSL · Marshall
- 2024 margin
- Solid R (+56.6) · D 21.2% · R 77.8%
- 2008→2024 swing
- -17.0pp toward R · 2008: -39.6pp · 2024: -56.6pp
- All cycles
- 2024: R+56.6 2020: R+50.0 2016: R+46.6 2012: R+28.9 2008: R+39.6
Not yet ingested
- Civics
- —
Market trends
- HPI YoY
- ▼ -59.86%
- Current HPI
- 350.5306
- Rent YoY
- —
- Metro
- —
- State GDP YoY
- ▲ 2.78%
- F500 in state
- 22
Industry mix (Fortune 500 HQ in TN)
| Industry | F500 HQs | Revenue |
|---|---|---|
| Healthcare | 3 | $91B |
|
||
| Retail | 3 | $72B |
|
||
| Transportation / Logistics | 1 | $88B |
|
||
| Paper / Packaging | 1 | $19B |
|
||
| Insurance | 1 | $13B |
|
||
| Energy | 1 | $12B |
|
||
Price history
+498.0% since first listed7 events — show timeline
- 2026-06-02 Coming Soon $299,000 REALTRACS as Distributed by MLS Grid
- 2021-06-25 Sold (Public Records) $221,000 Public Records
- 2021-06-24 Sold (MLS) $221,000 REALTRACS as Distributed by MLS Grid
- 2021-06-18 Pending — REALTRACS as Distributed by MLS Grid
- 2021-06-04 Contingent — REALTRACS as Distributed by MLS Grid
- 2021-05-21 Listed $224,900 REALTRACS as Distributed by MLS Grid
- 2020-10-05 Sold (Public Records) $50,000 Public Records
Property tax history
+8.0%/yrLatest (2025): $1,730 · +7.9% YoY. Source: county tax records.
Cash-flow waterfall
monthlySold comps — $/sqft
last 12 mo · ≤1 miLoading sold comps…